. 2021 Aug 27;12(1):5157.
doi: 10.1038/s41467-021-25418-5.

CTCF and transcription influence chromatin structure re-configuration after mitosis

Affiliations

CTCF and transcription influence chromatin structure re-configuration after mitosis

Haoyue Zhang et al. Nat Commun. .

Abstract

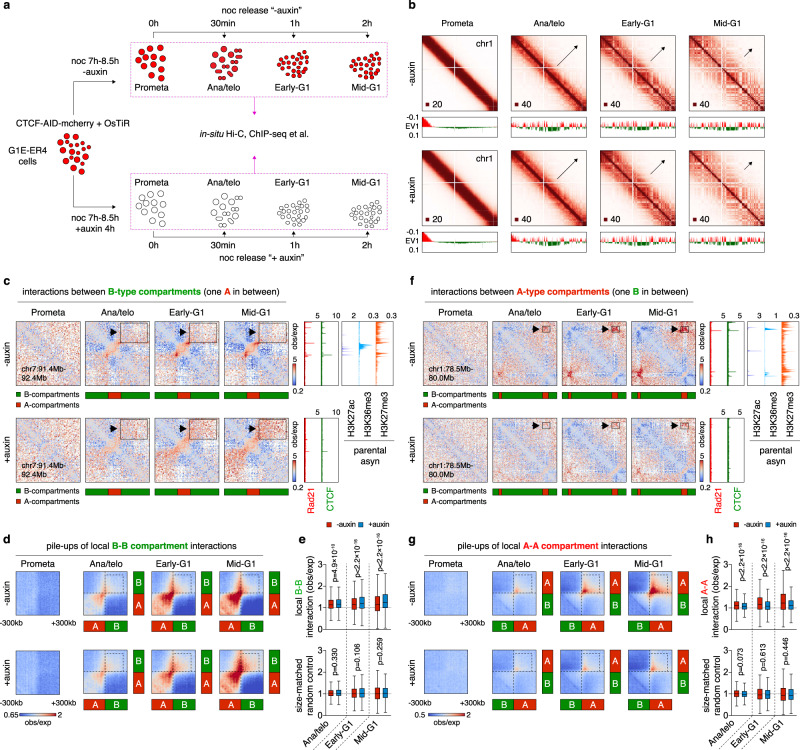
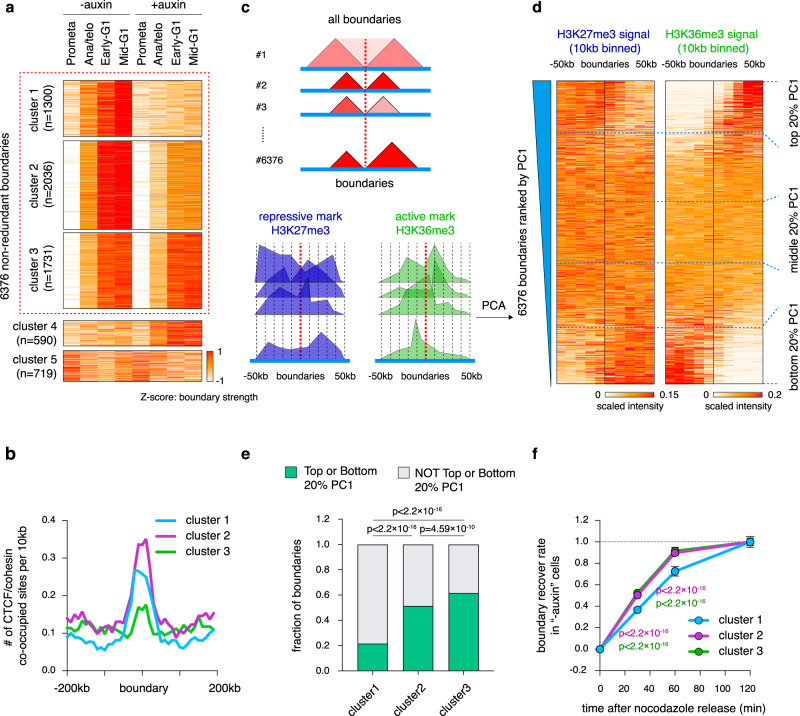
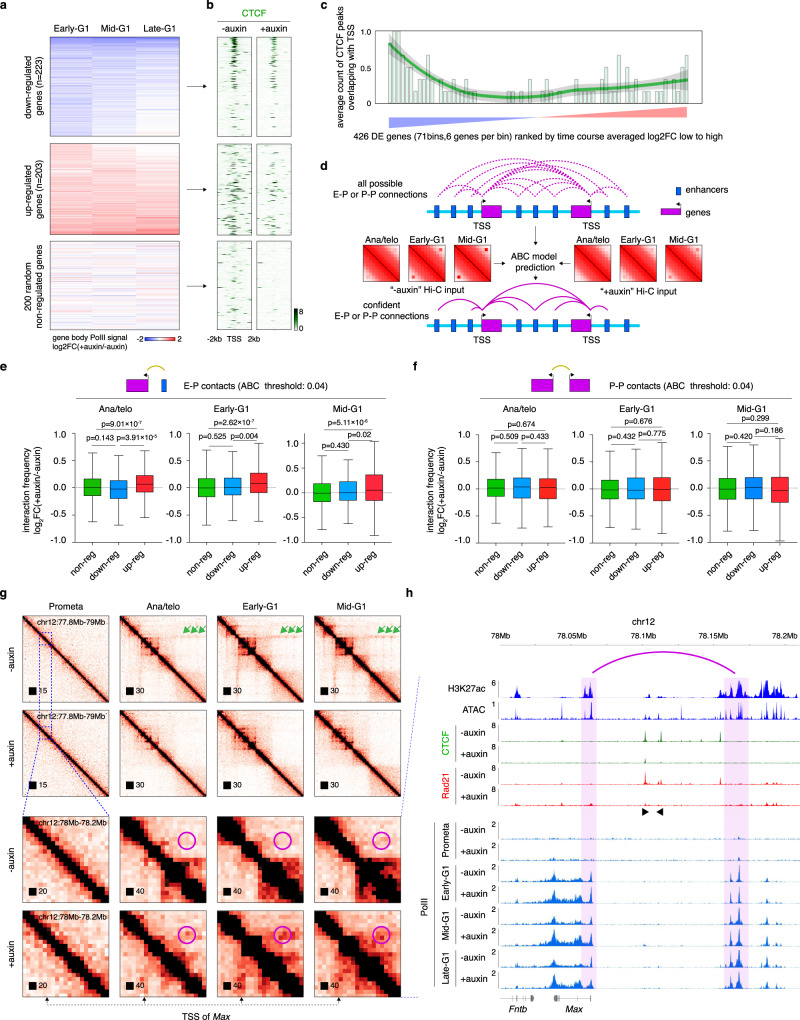
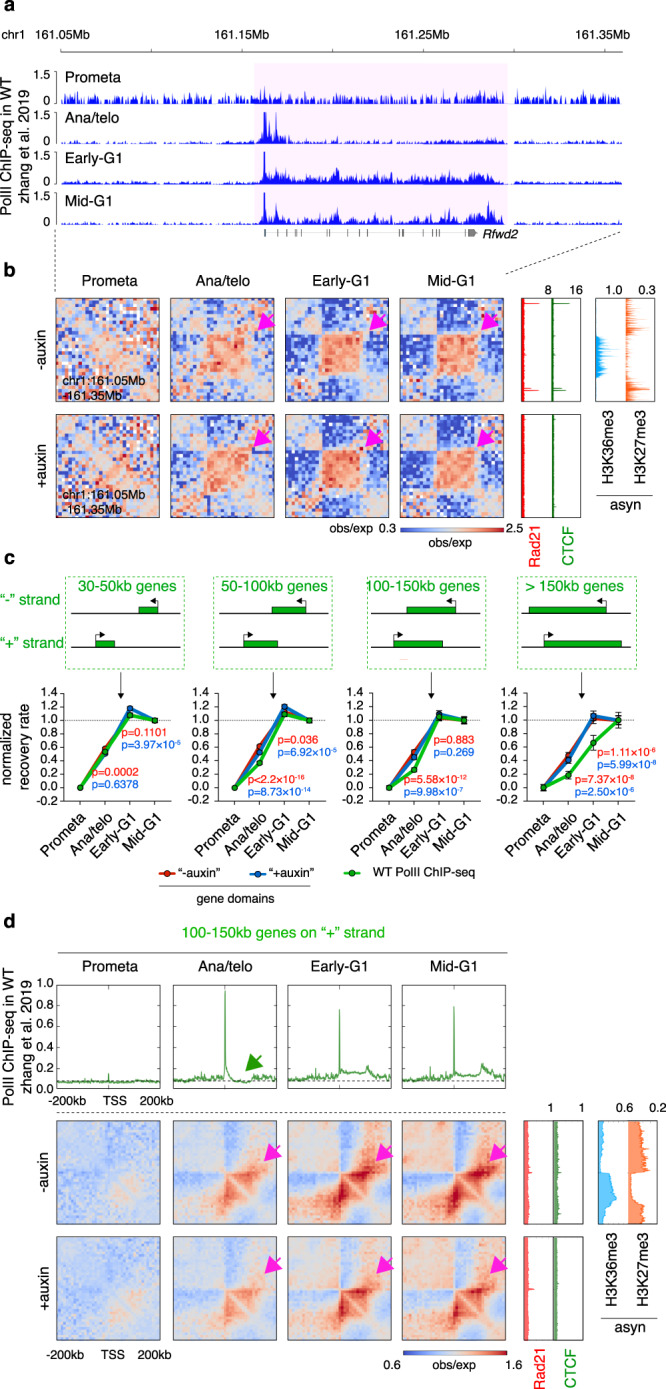
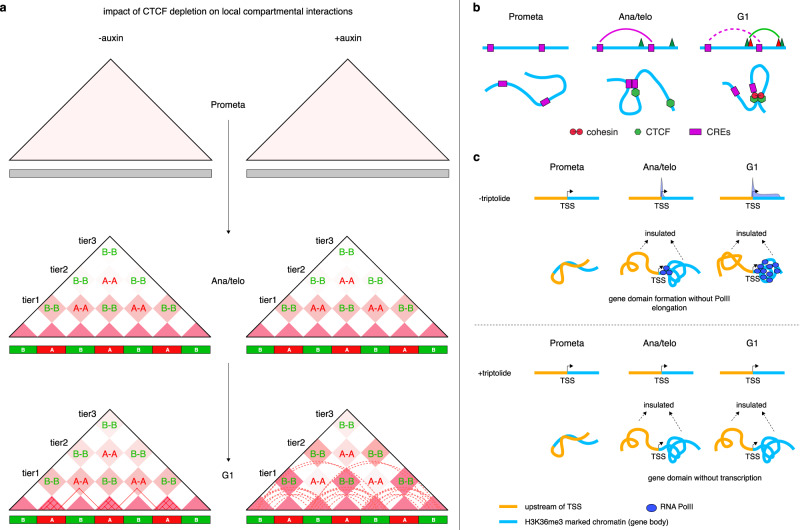
During mitosis, transcription is globally attenuated and chromatin architecture is dramatically reconfigured. We exploited the M- to G1-phase progression to interrogate the contributions of the architectural factor CTCF and the process of transcription to genome re-sculpting in newborn nuclei. Depletion of CTCF during the M- to G1-phase transition alters short-range compartmentalization after mitosis. Chromatin domain boundary re-formation is impaired upon CTCF loss, but a subset of boundaries, characterized by transitions in chromatin states, is established normally. Without CTCF, structural loops fail to form, leading to illegitimate contacts between cis-regulatory elements (CREs). Transient CRE contacts that are normally resolved after telophase persist deeply into G1-phase in CTCF-depleted cells. CTCF loss-associated gains in transcription are often linked to increased, normally illegitimate enhancer-promoter contacts. In contrast, at genes whose expression declines upon CTCF loss, CTCF seems to function as a conventional transcription activator, independent of its architectural role. CTCF-anchored structural loops facilitate formation of CRE loops nested within them, especially those involving weak CREs. Transcription inhibition does not significantly affect global architecture or transcription start site-associated boundaries. However, ongoing transcription contributes considerably to the formation of gene domains, regions of enriched contacts along gene bodies. Notably, gene domains emerge in ana/telophase prior to completion of the first round of transcription, suggesting that epigenetic features in gene bodies contribute to genome reconfiguration prior to transcription. The focus on the de novo formation of nuclear architecture during G1 entry yields insights into the contributions of CTCF and transcription to chromatin architecture dynamics during the mitosis to G1-phase progression.


Conflict of interest statement

The authors declare no competing interests.

Figures

Fig. 1
Fig. 1. Alteration of local compartmentalization upon CTCF removal.
a Strategy for harvesting mitotic and post-mitotic populations with or without CTCF. b KR balanced Hi-C contact matrices showing global compartment reformation of chr1 in untreated and auxin-treated cells after mitosis. Bin size: 100 kb. Black arrows indicate the progressive spreading of compartments throughout the entire chromosome. Browser tracks with compartment PC1 values are shown for each contact map. c KR balanced Hi-C contact matrices showing representative local B–B interaction changes with or without CTCF depletion after mitosis. Bin size: 10 kb. Arrows and boxes highlight the increased local B–B interactions after CTCF depletion across cell cycle stages. Tracks of CTCF and Rad21 with or without auxin treatment, as well as histone, marks H3K27ac, H3K36me3, and H27me3 are from asynchronous G1E-ER4 cells. d Pile-up Hi-C matrices showing the increased local interactions between all consecutive (with one A-type in between) B-type compartment domains. Bin size: 10 kb. Dotted boxes indicate the increased local B–B interactions genome-wide. e Upper panel: Boxplots showing quantification of interactions in the dotted boxes (250 kb × 250 kb) in (d) (n = 1604 pairs of short-range B–B interactions). Lower panel: Boxplots showing the effect of CTCF depletion on the interactions between randomly selected genomic pairs (n = 465) that are distance-matched to the upper panel. Boxplots present upper and lower quartiles with the centerline as the median. Whiskers denote 1.5 × interquartile range (IQR). P values were calculated using a two-sided paired Wilcoxon signed-rank test. f, g Similar to c and d, showing examples and pile-ups of local consecutive (with one B-type in between) A–A interactions genome-wide. h Upper panel: Boxplots showing quantification of interactions in the dotted boxes (250 kb × 250 kb) in (g) (n = 1612 pairs of short-range A–A interactions). Lower panel: Boxplots showing the effect of CTCF depletion on the interactions between randomly selected genomic pairs (n = 469) that are distance-matched to the upper panel. Boxplots present upper and lower quartiles with the centerline as the median. Whiskers denote 1.5 × interquartile range (IQR). P values were calculated using a two-sided paired Wilcoxon signed-rank test.
Fig. 2
Fig. 2. Reformation of boundaries displays distinct responses to CTCF loss.
ak-means clustering of boundaries depending on their sensitivity to CTCF depletion. The z-scores in prometaphase for cluster1 boundaries should not be interpreted as the absolute insulation intensity, because they are calculated as relative values across all time points (see the absolute insulation intensity in Supplementary Fig. 4f–h). b Average occupancy of CTCF/cohesin peaks per 10 kb for boundaries from cluster1–3. c Schematic of the principal component analysis (PCA)-based method using the H3k36me3 and H3K27me3 histone marks to assess boundaries as defined here as chromatin state transitions. d ChIP-seq signal intensities of H3K27me3 and H3K36me3 in a 100 kb window centered on boundaries. Boundaries were ranked by their PC1 projections in descending order. The top and bottom regions (20%) of the heatmap indicate the transition of chromatin state from 5′ inactive to 3′ active and 5′ active to 3′ inactive, respectively. e Bar graphs showing the fraction of boundaries from each cluster with top or bottom 20% PC1 values. P values were computed by two-sided Fisher’s exact test. n = 282, 1050, 1068 for cluster1, 2, and 3 boundaries with top or bottom 20% PC1 respectively. n = 1018, 986, 663 for cluster1, 2, and 3 boundaries not with top or bottom 20% PC1, respectively. f Line graph showing the kinetics of boundary formation of cluster1–3 in untreated cells. Error bars denote 95% confidence interval. Purple and green colored P values are calculated from comparisons between cluster1 (n = 1300) and cluster2 (n = 2036) or cluster3 (n = 1731) boundaries, respectively. Two-sided Wilcoxon signed-rank test.
Fig. 3
Fig. 3. CTCF loops constrain CRE contacts after mitosis.
a Schematic showing the stratification of loops (“structural loops”, “dual-function loops”, and “CRE loops”) based on the presence at their anchors of CTCF/cohesin co-occupied sites and CREs. CRE denotes cis-regulatory element. b APA plots showing the signals of loop categories before and after CTCF depletion across cell cycle stages. Bin size: 10 kb. c KR balanced Hi-C contact matrices of representative regions containing structural loops. Bin size: 10 kb. Tracks of CTCF and Rad21 with or without auxin treatment as well as H3K27ac, H3K4me3, and H3K4me1 were from asynchronous G1E-ER4 cells. d Similar to (c), KR balanced Hi-C contact matrices of representative regions containing dual-function loops. Bin size: 10 kb. e Venn diagram of CRE loops. f Heatmap displaying intensities of the 1410 newly gained loops after CTCF depletion. g Heatmap showing the result of k-means clustering on the 3232 CRE loops detected in untreated control samples. h Similar to c, d, KR balanced Hi-C contact matrices of a representative region containing a cluster1-P transient CRE loop. Additional tracks of CTCF and Rad21 from parental cells across designated cell cycle stages are shown.
Fig. 4
Fig. 4. CTCF loss alters transcription reactivation profiles after mitosis.
a Heatmap displaying differentially expressed genes based on PolII ChIP-seq read counts over the gene bodies (+500 from TSS to TES), plotted as log2 fold-change (FC). b Meta-region plots of CTCF ChIP-seq signals from asynchronous cells before and after auxin treatment, centered on down-regulated, up-regulated, or 200 random non-regulated gene TSS. Plots were generated by Deeptools (2.5.4). c Quantification of (b) showing the number of CTCF peaks overlapping with TSS. The green line represents lowess smoothing of bar plots. Error band denotes 95% confidence interval. d Schematic showing the implementation of the ABC (activity by contact) model to predict confidently E–P (enhancer–promoter) and P–P (promoter–promoter) interactions using input asynchronous H3K27ac ChIP-seq and ATAC-seq data from G1E-ER4 cells as well as in-situ Hi-C datasets from this study. e Boxplots showing the log2 fold change upon CTCF depletion of interaction strength of E–P pairs (ABC score cutoff = 0.04) associated with either non-regulated (n = 7211 E–P pairs), down-regulated (n = 188 E–P pairs), or up-regulated (n = 318 E–P pairs) genes. log2 fold change of interaction strength was calculated using the LIMMA R package for each cell cycle stage. Boxplots present upper and lower quartiles with the centerline as the median. Whiskers denote 1.5 × interquartile range (IQR). P values were calculated using a two-sided Wilcoxon signed-rank test. f Similar to (e) showing the interaction changes of P–P pairs after CTCF depletion. n = 11,117, 349, and 291 P–P pairs for non-regulated, down-regulated, and up-regulated genes respectively. P values were calculated using a two-sided Wilcoxon signed-rank test. g KR balanced Hi-C contact matrices showing the Max locus across cell cycle stages in control and auxin-treated samples. Bin size: 10 kb. Green arrows indicate the structural loops that insulate the Max promoter from a nearby enhancer. Purple circles demarcate the increase of interactions between the Max promoter and a nearby enhancer upon CTCF depletion after mitosis. Note that the gain in interactions occurs at the earliest tested time point. h ChIP-seq genome browser tracks of the same region as that shown in the lower panel in (g). Note increased expression of Max after mitosis in auxin-treated samples. Purple arch annotates the elevated interaction between the Max promoter and the nearby enhancer. Black arrows indicate the motif orientation of CTCF-binding sites.
Fig. 5
Fig. 5. Gene domains emerge prior to completion of the first round of transcription after mitosis.
a PolII ChIP-seq genome browser tracks at the Rfwd2 locus across cell cycle stages in parental cells. Note that in ana/telophase PolII is detected at the promoter region but the initial round of transcription has not been completed. b KR balanced Hi-C contact matrices of the same region as in (a) across cell cycle stages in control and auxin-treated samples. Bin size: 10 kb. Purple arrows indicate the domain of the Rfwd2 gene in post-mitotic stages. Tracks of CTCF and Rad21 with or without auxin treatment as well as histone marks H3K36me3 and H27me3 are from asynchronously growing G1E-ER4 cells. c Upper panel: Schematic of genes with different sizes. Lower panel: Line graphs of recovery rates of gene domains in the control and auxin-treated samples and the recovery rate of PolII occupancy over the gene body. Genes corresponding to the size ranges in the upper panel were separately plotted. n = 952, 846, 260, and 119 genes with size ranges of 30–50, 50–100, 100–150 kb, and over 150 kb, respectively. P values were calculated using a two-sided paired Wilcoxon signed-rank test. Red and blue asterisks represent comparisons between PolII and gene domains in untreated control or auxin-treated samples, respectively. Error bars denote SEM. d Upper panel: Meta-region pile-up plots of PolII ChIP-seq signals corresponding to the 100–150kb genes on the plus strand across cell cycle stages. Plots are centered on TSS. Lower panel: Pile-up Hi-C matrices showing the domains of the genes corresponding to the upper panel across cell cycle stages in untreated and auxin treated samples. Bin size: 10 kb. Plots are centered on TSS. Gene domains are labeled with purple arrows. Meta-region plots of CTCF and Rad21 with or without auxin treatment, as well as H3K36me3 and H3K27me3, are shown on the right.
Fig. 6
Fig. 6. Mechanistic models.
a Schematic showing how CTCF removal can impact local but not distal interactions between the same type of compartments. Short-range B–B interactions were enhanced potentially due to increased extrusion loop size from A compartments after CTCF removal. Note, the effect was progressively observed in the G1 phase because of the gradual action of loop extrusion. Solid lines in the bottom panel represent structural loops formed and stabilized within A-type compartment domains in CTCF repleted conditions. Dotted lines represent actively extruding loops that are unleashed from A-type compartment domains into flanking B-type compartment domains due to CTCF depletion. b Schematic showing the rapid dissolution of established CRE loops as nearby disruptive structural loops emerge after mitosis. c Schematic showing that a gene domain is already partially established prior to full coverage of the gene body by PolII.

References

    1. Zhang H, et al. Chromatin structure dynamics during the mitosis-to-G1 phase transition. Nature. 2019;576:158–162. doi: 10.1038/s41586-019-1778-y. - DOI - PMC - PubMed
    1. Abramo K, et al. A chromosome folding intermediate at the condensin-to-cohesin transition during telophase. Nat. Cell Biol. 2019;21:1393–1402. doi: 10.1038/s41556-019-0406-2. - DOI - PMC - PubMed
    1. Gibcus, J. H. et al. A pathway for mitotic chromosome formation. Science359, eaao6135 (2018). - PMC - PubMed
    1. Naumova N, et al. Organization of the mitotic chromosome. Science. 2013;342:948–953. doi: 10.1126/science.1236083. - DOI - PMC - PubMed
    1. Pelham-Webb B, et al. H3K27ac bookmarking promotes rapid post-mitotic activation of the pluripotent stem cell program without impacting 3D chromatin reorganization. Mol. Cell. 2021;81:1732–1748 e8. doi: 10.1016/j.molcel.2021.02.032. - DOI - PMC - PubMed

Publication types