. 2021 Aug 27;12(1):5168.
doi: 10.1038/s41467-021-25500-y.

Four dimensions characterize attributions from faces using a representative set of English trait words

Affiliations

Four dimensions characterize attributions from faces using a representative set of English trait words

Chujun Lin et al. Nat Commun. .

Abstract

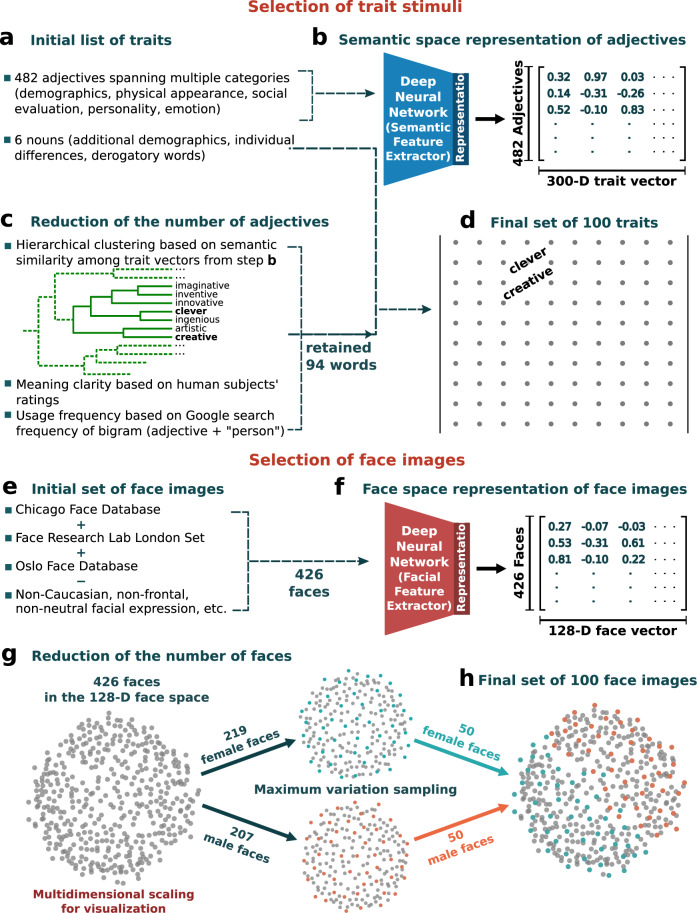
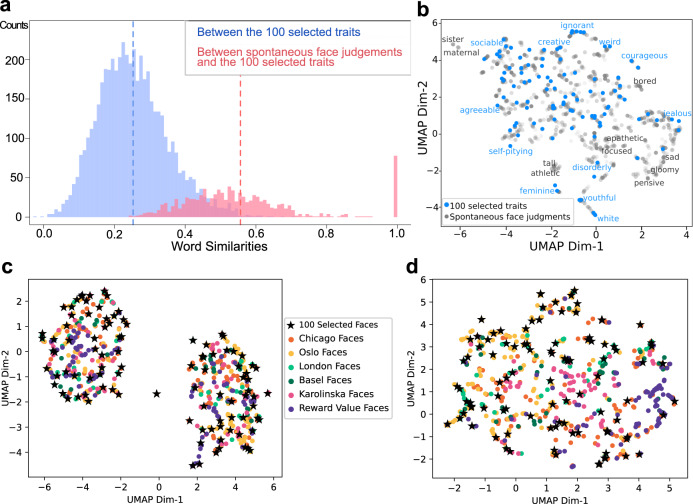
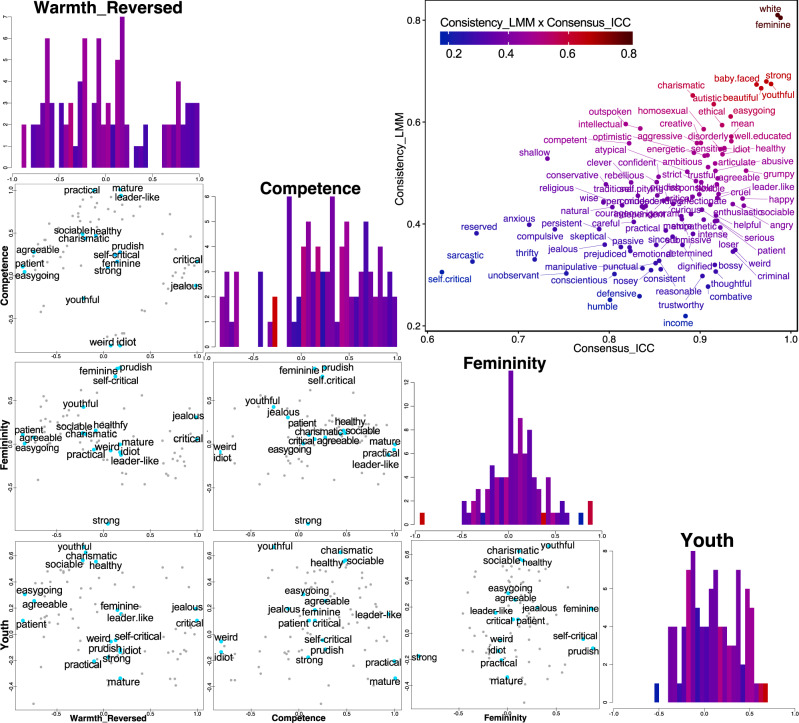
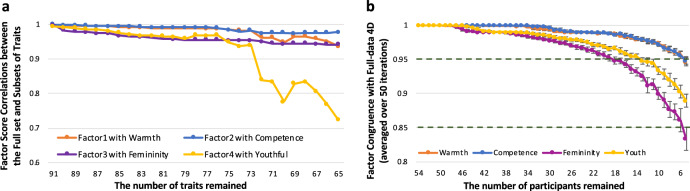
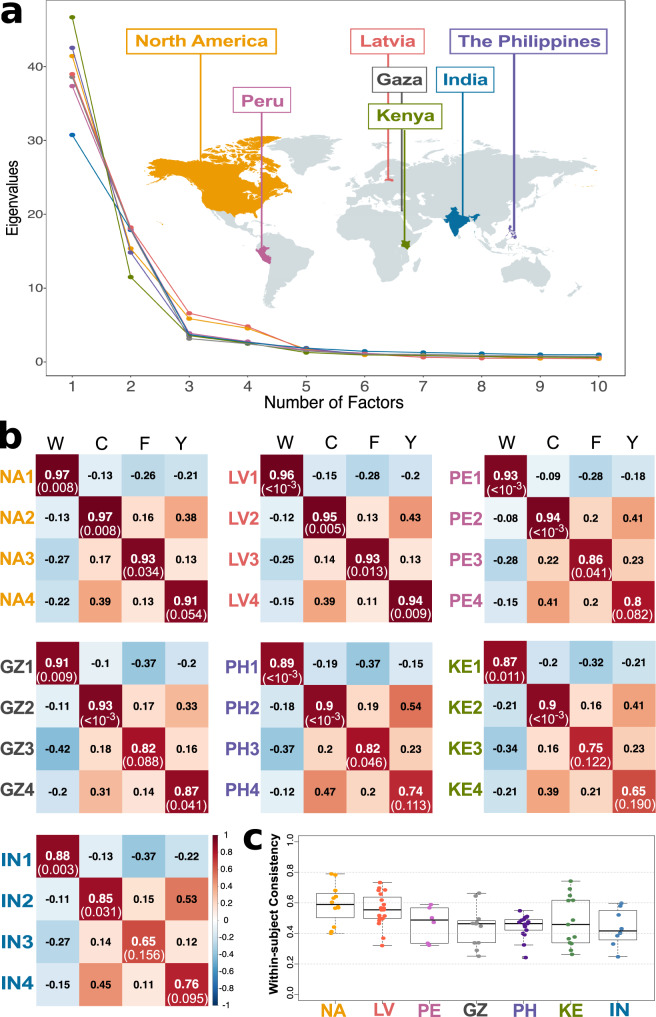
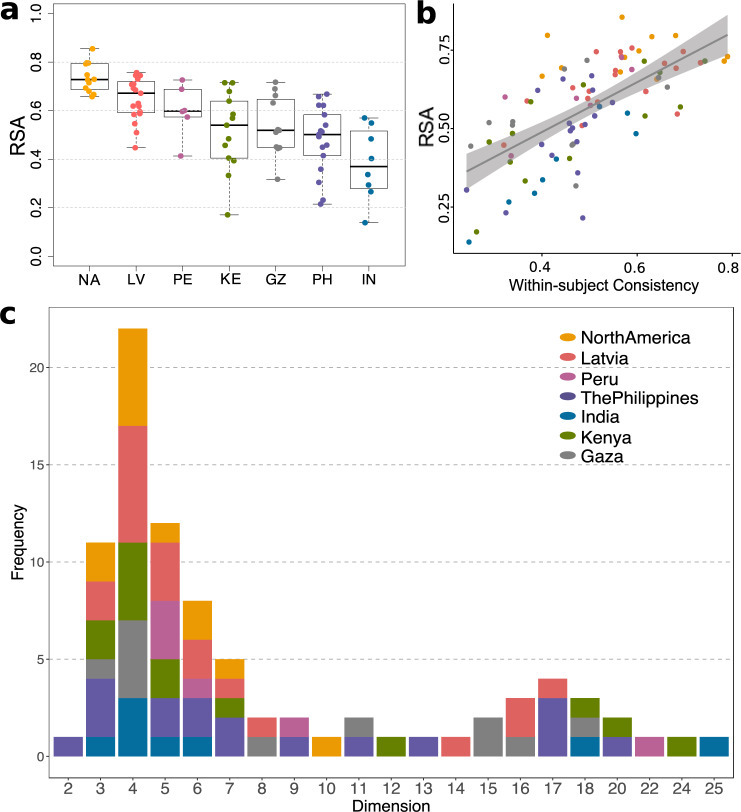
People readily (but often inaccurately) attribute traits to others based on faces. While the details of attributions depend on the language available to describe social traits, psychological theories argue that two or three dimensions (such as valence and dominance) summarize social trait attributions from faces. However, prior work has used only a small number of trait words (12 to 18), limiting conclusions to date. In two large-scale, preregistered studies we ask participants to rate 100 faces (obtained from existing face stimuli sets), using a list of 100 English trait words that we derived using deep neural network analysis of words that have been used by other participants in prior studies to describe faces. In study 1 we find that these attributions are best described by four psychological dimensions, which we interpret as "warmth", "competence", "femininity", and "youth". In study 2 we partially reproduce these four dimensions using the same stimuli among additional participant raters from multiple regions around the world, in both aggregated and individual-level data. These results provide a comprehensive characterization of trait attributions from faces, although we note our conclusions are limited by the scope of our study (in particular we note only white faces and English trait words were included).


Conflict of interest statement

The authors declare no competing interests.

Figures

Fig. 1
Fig. 1. Sampling traits a–d and face images e–h to generate a comprehensive set.
a Sampling of traits began by assembling an extensive list of trait words–,,,–,,– spanning all-important categories of trait attributions from faces. b Each adjective was represented with a vector of 300 semantic features that describe word embeddings and text classification using a state-of-the-art neural network that had been pretrained to assign words to their contexts across 600 billion words. c Three filters were applied to remove words with similar meanings, unclear meaning, and infrequent usage (see Methods). d The final set of 100 traits consisted of the sampled adjectives and nouns (see Supplementary Table 1). e Sampling of face images began by assembling a set of frontal, neutral, white faces from three popular face databases. f, Each face was represented with a vector of 128 facial features that are used to classify individual identities using a neural network pretrained to identify individuals across millions of faces of all different aspects and races. g Maximum variation sampling was applied to select faces with maximum variability in facial structure in this 128-D space. h Multidimensional scaling visualization of the sampled 100 face images (green and orange dots).
Fig. 2
Fig. 2. Representativeness of the sampled traits a–b and face images c–d.
a Distributions of word similarities. The similarity between two words was assessed with the cosine distance between the 300-feature vectors of the two words. The blue histogram plots the pairwise similarities among the 100 sampled traits. The red histogram plots the similarities between each of the freely generated words during spontaneous face attributions (n = 973, see Supplementary Fig. 1a) and its closest counterpart in the sampled 100 traits. Dashed lines indicate means. All freely generated words were found to be similar to at least one of the sampled traits (all similarities greater than the mean similarity among the sampled traits [except for the words “moving” and “round”]). Eighty-five freely generated words were identical to those in the 100 sampled traits. b Uniform Manifold Approximation and Projection of words (UMAP, a dimensionality reduction technique that generalizes to nonlinearities). Blue dots indicate the 100 sampled traits (examples labeled in blue) and gray dots indicate the freely generated words during spontaneous face attributions (see Methods; nonoverlapping examples labeled in gray, which were mostly momentary mental states rather than temporally stable traits). c UMAP of the final sampled 100 faces (stars) compared with a larger set of frontal, neutral, white faces from various databases (dots, N = 632; see also Supplementary Fig. 1b for comparison with faces in real-world contexts). Each face was represented with 128 facial features as extracted by a state-of-the-art deep neural network. d UMAP of the final sampled 100 faces (stars) compared with the larger set of faces (dots) as in c. Each face was represented here with 30 automatically measured simple facial metrics (e.g., pupillary distance, eye size, nose length, cheekbone prominence). Source data are provided as a Source Data file.
Fig. 3
Fig. 3. Reliability and dimensionality of trait attributions from faces.
Upper right scatterplot: within-subject consistency as assessed with linear mixed-effect modeling (y-axis, regression coefficients) plotted against between-subject consensus as assessed with intraclass correlation coefficients (x-axis) of the 100 traits. The color scale indicates the product between the x- and y-values. We used 94 traits selected from the literature and supplemented the list with additional trait words for which we believe there was no equivalent in the initial list but would reflect vocabulary used to describe first impressions. Four histograms in diagonal: each plots the distribution of the factor loadings across all traits in EFA, on each of the four dimensions (color code as in upper right scatterplot; see also Supplementary Fig. 4a for factor loadings). Six scatterplots in the lower left: each plots the factor loading of all traits in EFA against two of the four dimensions (dots). Labels are shown for a small subset of datapoints (blue dots) due to limited space (see Supplementary Fig. 4b for full labels). Source data are provided as a Source Data file.
Fig. 4
Fig. 4. Dimensionality analysis with artificial neural network and cross-validation.
a An example of an autoencoder model with one hidden layer and four neurons in the hidden layer to learn the underlying representation of the data. b, The means (points) and standard deviations (bars) of the explained variance (n = 50 iterations) on the training data from autoencoders with various numbers of neurons in the hidden layer (red dots in a). Colors indicate different configurations of activation functions in the encoder and decoder layers (linear, tanh, sigmoid, rectified linear activation unit, L1-norm regularization); for example, the blue line indicates configurations with linear functions in both the encoder and decoder layers (AE-linear-linear). c, Means (points) and standard deviations (bars) of the explained variance (n = 50 iterations) on the test data from autoencoders shown in b. Source data are provided as a Source Data file.
Fig. 5
Fig. 5. Robustness of dimensions with respect to the number of traits and participants.
a Pearson’s correlations between factor scores from the full set versus subsets of traits. Colors indicate the four different dimensions. b Tucker indices of factor congruence (with orthogonal Procrustes rotation) between the full set versus subsets of participants. Colors indicate the four different dimensions. Points indicate the means and error bars indicate standard deviations across the 50 iterations. Source data are provided as a Source Data file.
Fig. 6
Fig. 6. Dimensionality of trait attributions from faces across different samples.
a Eigenvalue decomposition. Dots plot the eigenvalues of the first 10 factors across seven samples, indicated by different colors. b Tucker indices of factor congruence. Columns indicate the four dimensions found in Study 1: warmth (W), competence (C), femininity (F), and youth (Y). Rows indicate the four factors derived from the samples in North America (NA), Latvia (LV), Peru (PE), the Philippines (PH), Kenya (KE), India (IN), and Gaza (GZ). Numbers report the Tucker indices (with orthogonal Procrustes rotation). The color scale shows the sign and strength of the indices. Statistical significance (p-value in parentheses) was obtained using permutation test (with orthogonal Procrustes rotation, and permuting both the rows and columns of the compared factor loading matrix over 1000 iterations). c Individual within-subject consistency by sample (assessed with Pearson’s correlations). Every participant in Study 2 had rated a subset of 20 traits twice for all faces to provide an assessment of within-subject consistency (ns = 12, 19, 6, 11, 17, 13, 8 participants from left to right columns who had complete data after exclusion). Boxplots indicate the minima (bottommost line), first quartiles (box bottom), medians (line in box), third quartiles (box top), and maxima (topmost line) of the within-subject consistency. Source data are provided as a Source Data file.
Fig. 7
Fig. 7. Dimensionality of trait attributions from faces in individual data.
a Representational similarity between aggregated data from Study 1 and individual-level data from Study 2 for individuals who had complete data after exclusion (n = 86, see Methods). Colors indicate different samples (as in Fig. 6). Boxplots indicate the minima (bottommost line), first quartiles (box bottom), medians (line in box), third quartiles (box top), and maxima (topmost line) of RSAs. b Correlation between within-subject consistency and RSA (r = 0.66, p = 6.476 × 10−12). Each point plots an individual’s within-subject consistency (x-axis) and that individual’s RSA with the aggregated data in Study 1 (y-axis). The shaded area indicates the error band. c Distribution of the number of dimensions (from parallel analysis) across 86 individual-level datasets. Source data are provided as a Source Data file.

References

    1. Oosterhof NN, Todorov A. The functional basis of face evaluation. Proc. Natl. Acad. Sci. 2008;105:11087–11092. doi: 10.1073/pnas.0805664105. - DOI - PMC - PubMed
    1. Sutherland CAM, et al. Facial first impressions across culture: data-driven modeling of Chinese and British Perceivers’ unconstrained facial impressions. Pers. Soc. Psychol. Bull. 2018;44:521–537. doi: 10.1177/0146167217744194. - DOI - PubMed
    1. Todorov, A. Face value: the irresistible influence of first impressions. (Princeton University Press, 2017).
    1. Abir Y, Sklar AY, Dotsch R, Todorov A, Hassin RR. The determinants of consciousness of human faces. Nat. Hum. Behav. 2018;2:194–199. doi: 10.1038/s41562-017-0266-3. - DOI
    1. Rule, N. O., Slepian, M. L. & Ambady, N. A memory advantage for untrustworthy faces. Cognition.125, 207–218 (2012). - PubMed

Publication types