. 2021 Aug 27;12(1):5167.
doi: 10.1038/s41467-021-25507-5.

Universal scaling of robustness of ecosystem services to species loss

Affiliations

Universal scaling of robustness of ecosystem services to species loss

Samuel R P-J Ross et al. Nat Commun. .

Abstract

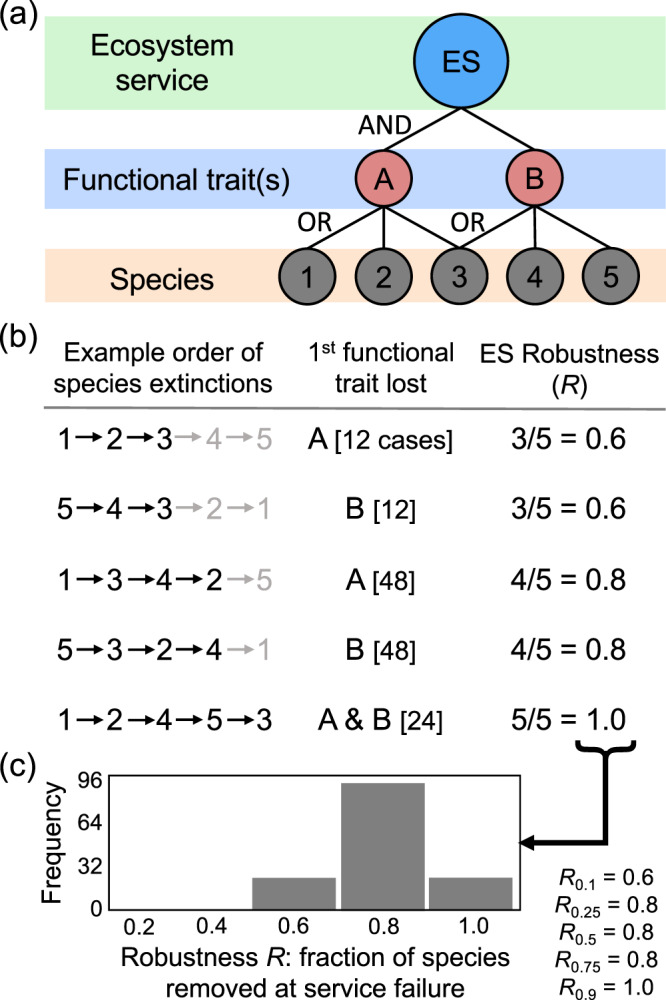
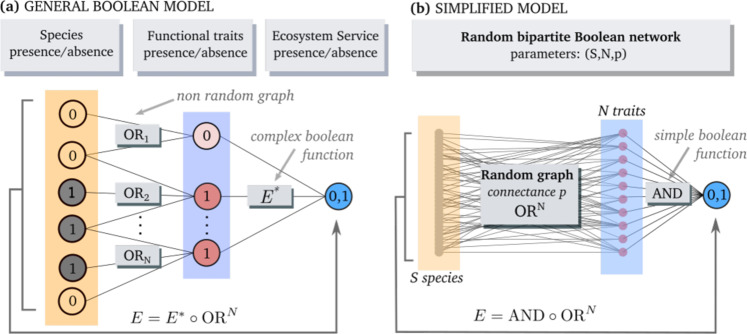
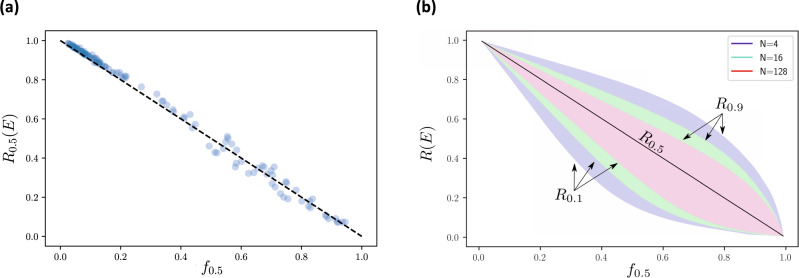
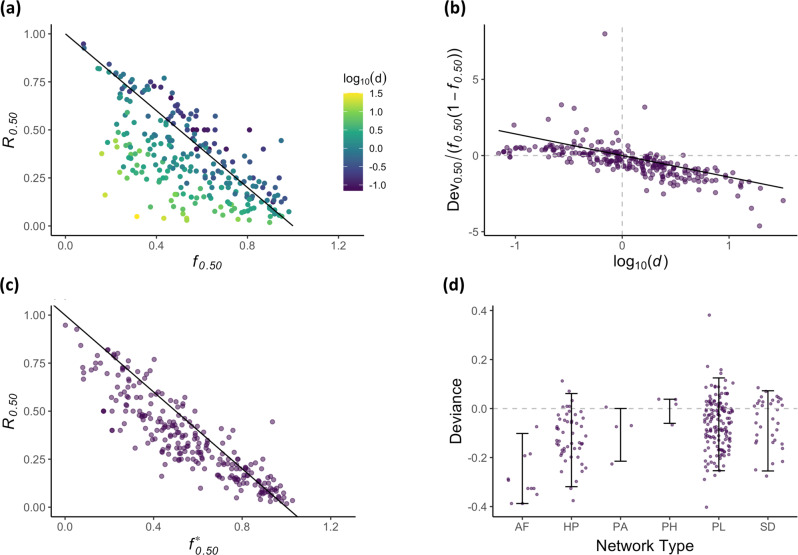
Ensuring reliable supply of services from nature is key to the sustainable development and well-being of human societies. Varied and frequently complex relationships between biodiversity and ecosystem services have, however, frustrated our capacity to quantify and predict the vulnerability of those services to species extinctions. Here, we use a qualitative Boolean modelling framework to identify universal drivers of the robustness of ecosystem service supply to species loss. These drivers comprise simple features of the networks that link species to the functions they perform that, in turn, underpin a service. Together, they define what we call network fragility. Using data from >250 real ecological networks representing services such as pollination and seed-dispersal, we demonstrate that network fragility predicts remarkably well the robustness of empirical ecosystem services. We then show how to quantify contributions of individual species to ecosystem service robustness, enabling quantification of how vulnerability scales from species to services. Our findings provide general insights into the way species, functional traits, and the links between them together determine the vulnerability of ecosystem service supply to biodiversity loss.


Conflict of interest statement

The authors declare no competing interests.

Figures

Fig. 1
Fig. 1. The principles of our approach to measuring the robustness of ecosystem services to species loss.
a We use a qualitative framework (see ‘Methods’ for a detailed description) whereby species [1–5 in this example] are linked to their functional traits [A and B] and are either present or absent from a community. An ecosystem service [ES] is supplied only when all underpinning functional traits are present in the community (the Boolean function AND; see ‘Methods’ and Supplementary Methods for justification). b As species are removed sequentially from the system, a functional trait is present until all species connected to that trait are lost. In this way, species losses are tolerated (the Boolean function OR) until a unique functional trait has been lost. ‘Example order of species extinctions’ presents illustrative examples of the sequential removal of the species in a, with sequences in grey indicating extinctions after service failure. ‘1st functional trait lost’ is the identity of the unique functional trait [A and/or B] first lost from the system—which, under our framework, necessarily causes service loss—with [n cases] indicating the number of extinction sequences for which this result is obtained [reflected also in the histogram (c)]. We measure ‘ES Robustness (R)’ as the fraction of species removals required to bring about loss of a service for each extinction sequence. c This results in a distribution of robustness R values, representing the fraction of species loss tolerated across all extinction scenarios. This distribution of R values can be described via its percentiles [denoted with subscript c] with, for example, the median robustness [R0.5] here equating to 0.8. That is, in 50% of extinction scenarios in this hypothetical example, 4/5 or fewer species extinctions are required to cause service failure.
Fig. 2
Fig. 2. A Boolean model for ecosystem services.
a We view an ecosystem service as a Boolean function E over the presence/absence configurations of S species (leftmost column). We distinguish species from their N functional traits (middle column). The configuration of any trait n is defined by the logical OR function over the Sn species that share that trait. This amounts to writing E as the composition E=E*ORN, which should aim to remove as much functional redundancy as possible from the auxiliary function E* over trait configurations. b We simplify our model further by (i) considering random species-to-trait associations with connectance p and (ii) choosing the logical AND function for E* [that is, the least redundant function, which we show (Supplementary Methods) is representative of a random choice across the space of all Boolean functions]. In this model (see ‘Methods’ for full description), we can deduce analytical expressions for the percentiles of the distribution (considering all possible extinction sequences) of robustness of ecosystem service supply R: the fraction of species loss leading to loss of service supply.
Fig. 3
Fig. 3. Universal behaviour of the robustness of ecosystem service supply as a function of network fragility.
a For 125 random ecosystem services of the form shown in Fig. 2, we uniformly sampled 5 values for species richness S between 10 and 200, 20 for functional traits N between 10 and 100 and 10 for connectance p between 0 and 0.5 and for each considered 600 extinction scenarios leading to a loss of service, drawn uniformly over the set of all possible extinction sequences. We see that the median robustness of ecosystem service supply (that is, R0.5(E)) in our simplified Boolean model behaves as a simple decreasing linear function of median network fragility (f0.5). b For three values of number of traits (that is, N = 4, 16 and 128) and random values of number of species S and connectance p, we used the analytical formula in Eq. (1) to draw the contours of the bulk of the robustness distribution (that is, 10th–90th percentiles) as a function of f0.5, the value of fragility associated with median robustness. We see that, at fixed N, the percentiles can be expressed as functions of f0.5, with the largest spread at intermediate values of network fragility. At fixed fragility, increasing the number of traits N reduces the width of the distribution.
Fig. 4
Fig. 4. Robustness of ecosystem service supply and network fragility in empirical networks.
a The relationship between simulated robustness of ecosystem service supply (Rc = R0.5) and analytically estimated network fragility (fc = f0.5) for 251 empirical networks from the Web of Life follows the linear approximation Rc = 1 − fc. Colour indicates network dispersion [log10(d)]. b The residuals off the linear prediction Rc = 1 − fc correlate with log10(d), which we model as (Rc − 1 + fc)/(fc(1 − fc)) = λclog10(d), where, for the case of R0.5, λ0.5 = −1.42. c Correcting network fragility for dispersion according to fc*=fc+λclog10(d) yields an even closer relationship with robustness of ecosystem service supply. d Residuals from R0.5 − f0.5* by network type show that our model captures well the universal properties, where AF = anemone–fish (n = 10), HP = host–parasite (n = 51), PA = plant–ant (n = 4), PH = plant–herbivore (n = 4), PL = pollination (n = 148), and SD = seed dispersal (n = 34). Error bars show the 5th and 95th quantiles of the data.

References

    1. Costanza R, et al. Twenty years of ecosystem services: how far have we come and how far do we still need to go? Ecosyst. Serv. 2017;28:1–16. doi: 10.1016/j.ecoser.2017.09.008. - DOI
    1. Costanza R, et al. The value of the world’s ecosystem services and natural capital. Nature. 1997;387:253–260. doi: 10.1038/387253a0. - DOI
    1. Mace GM, Norris K, Fitter AH. Biodiversity and ecosystem services: a multilayered relationship. Trends Ecol. Evol. 2012;27:19–26. doi: 10.1016/j.tree.2011.08.006. - DOI - PubMed
    1. Pimm SL, et al. The biodiversity of species and their rates of extinction, distribution, and protection. Science. 2014;344:1246752. doi: 10.1126/science.1246752. - DOI - PubMed
    1. De Vos JM, Joppa LN, Gittleman JL, Stephens PR, Pimm SL. Estimating the normal background rate of species extinction. Conserv. Biol. 2015;29:452–462. doi: 10.1111/cobi.12380. - DOI - PubMed

Publication types