. 2021 Aug 27;11(1):17296.
doi: 10.1038/s41598-021-96537-8.

Effect of extracorporeal shock wave therapy on keratinocytes derived from human hypertrophic scars

Affiliations

Effect of extracorporeal shock wave therapy on keratinocytes derived from human hypertrophic scars

Hui Song Cui et al. Sci Rep. .

Abstract

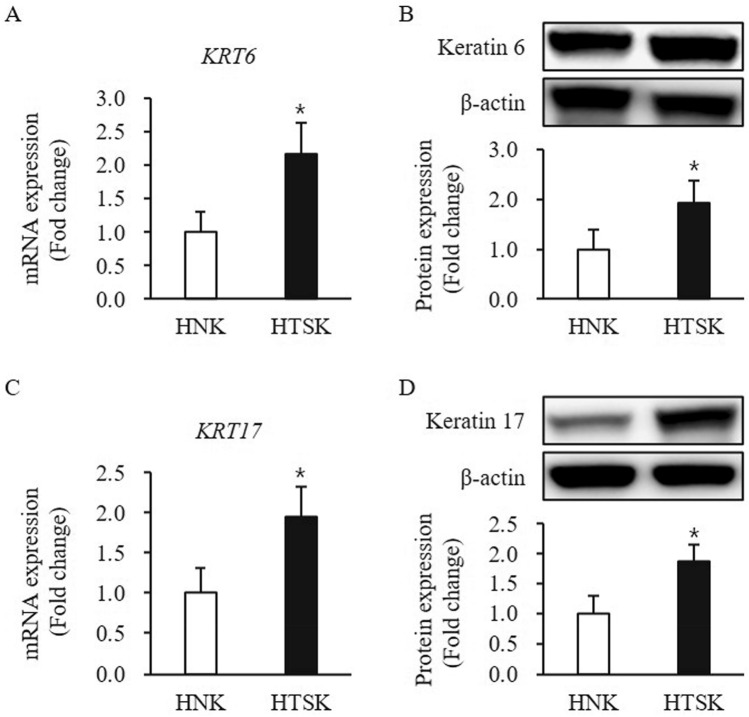
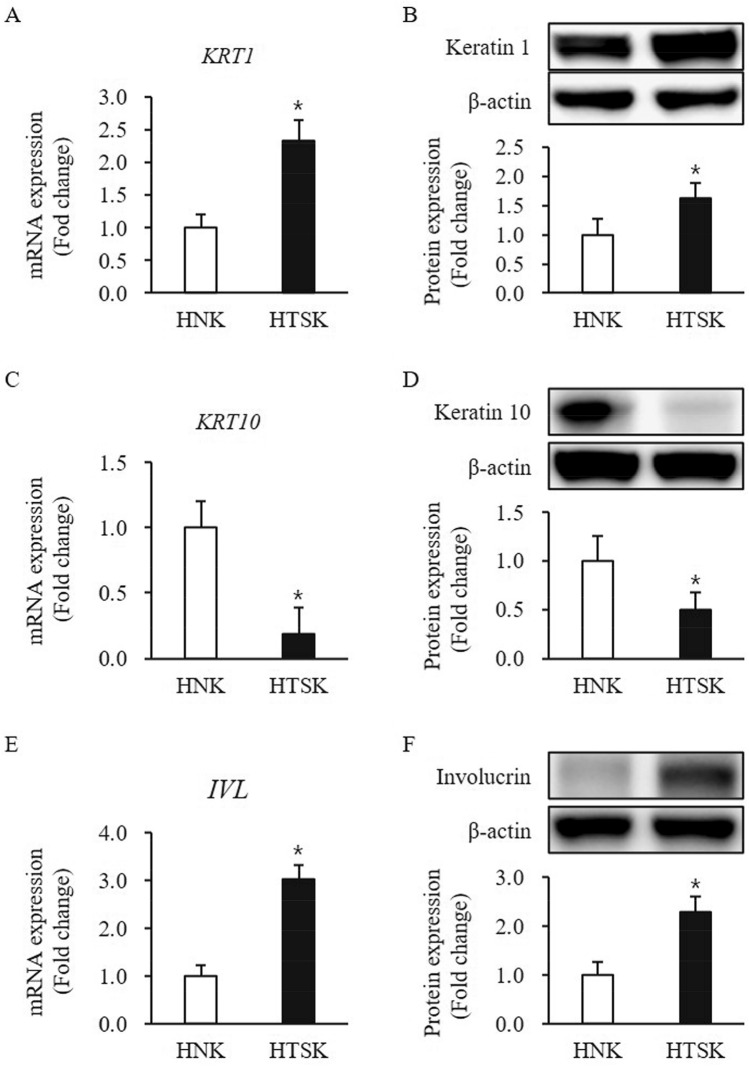
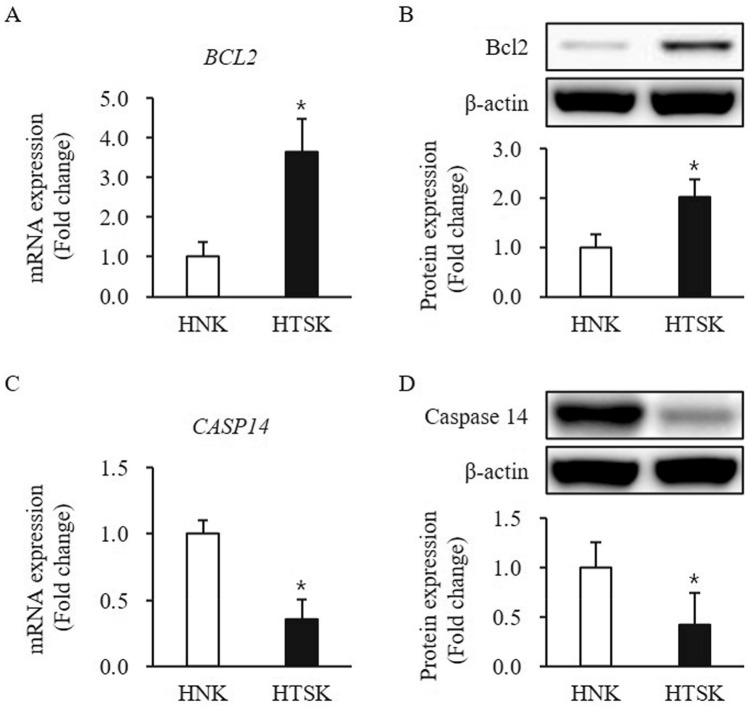
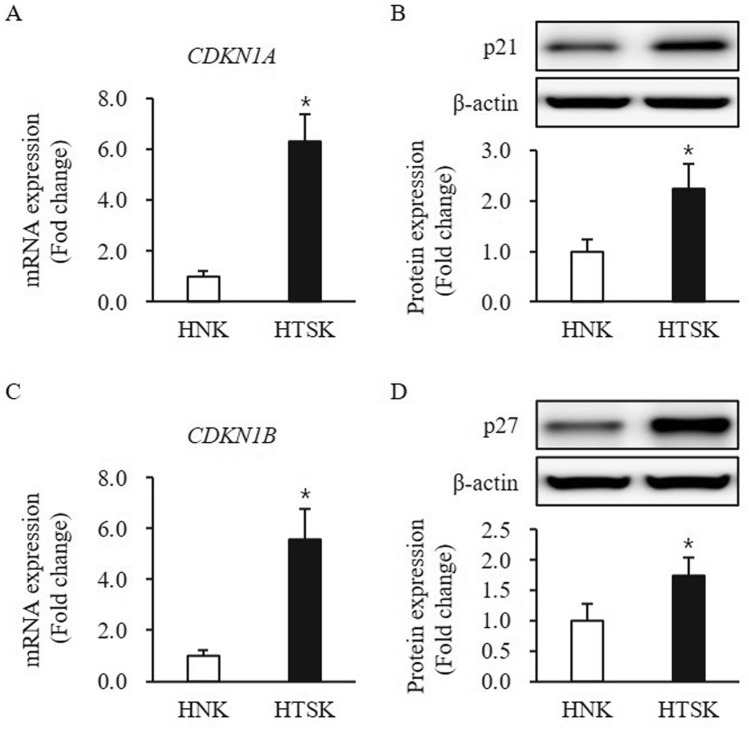
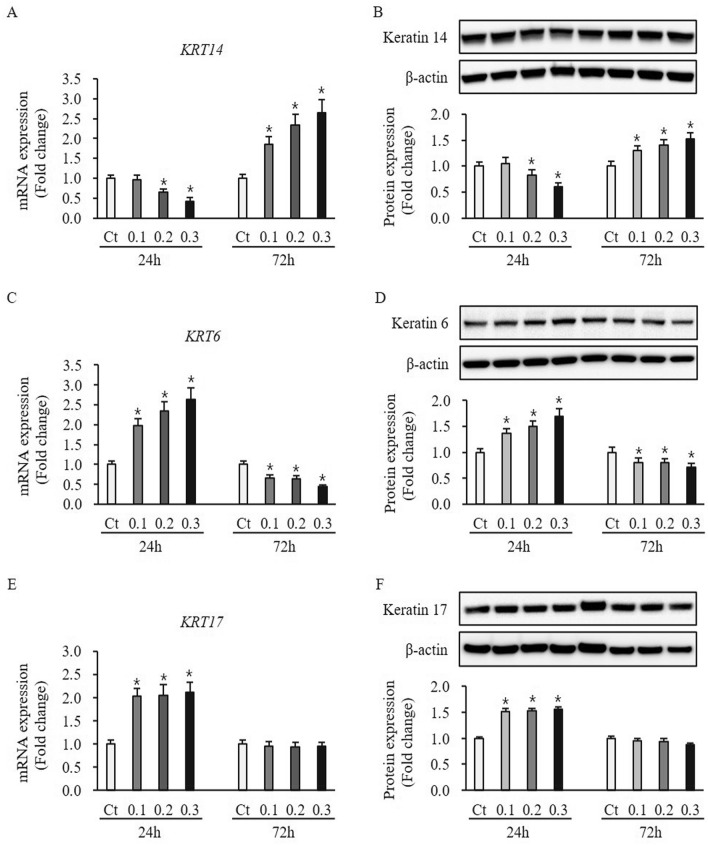
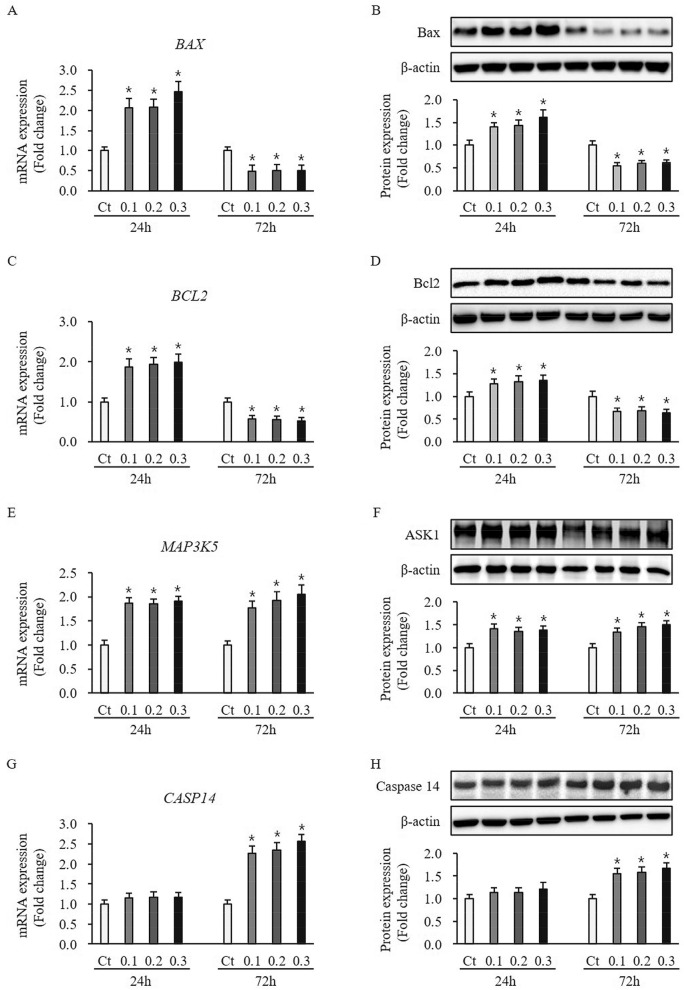
Hypertrophic scars represent a common complication in burn patients. In addition to cosmetic defects, they may cause serious sensory abnormalities such as pain and itching, severe dysfunction depending on the site, and emotional disorders such as anxiety and depression. The present study aimed to identify the molecular mechanisms underlying the use of extracorporeal shock wave therapy in keratinocytes. Keratinocytes derived from hypertrophic scar tissue were cultured and expression of proliferation markers (keratin 5 and 14), activation markers (keratin 6 and 17), differentiation markers (keratin 1, 10, and involucrin), apoptosis factors (Bax, Bcl2, and Caspase 14), and proliferation/differentiation regulators (p21 and p27) was investigated to compared with that of those in keratinocytes derived from normal skin tissue. Scar-derived keratinocytes were treated with extracorporeal shock waves under 1000 impulses at 0.1, 0.2, and 0.3 mJ/mm2. Shock waves altered the molecular pattern of proliferation, activation, differentiation, and apoptosis, as well as proliferation/ differentiation regulators, including Bax, Bcl2, ASK1, p21, p27, and Notch1. In summary, we show that extracorporeal shock wave therapy regulates the proliferation and differentiation of keratinocytes derived from hypertrophic scar to maintain normal epidermal integrity.


Conflict of interest statement

The authors declare no competing interests.

Figures

Figure 1
Figure 1
Expression of activation markers in HTSKs. Significantly increased mRNA levels of genes encoding keratin 6 (KRT6) (A) and keratin 17 (KRT17) (C) in HTSKs compared with those in HNKs. Significantly increased protein levels of keratin 6 (B) and keratin 16 (D) in HTSKs compared with those in HNKs. NHKs and HTSKs were primary cultured from normal skin tissues and HTS tissues, respectively. In the fold change, HNKs marked as value 1; HNK, human normal keratinocyte; HTSK, hypertrophic scar keratinocyte; *P < 0.05 for HTSK vs. the corresponding matched HNK. Data represent means ± SD; n = 4 (HNK) and n = 4 (HTSK).
Figure 2
Figure 2
Expression of differentiation markers in HTSKs. Significantly increased mRNA levels of genes encoding keratin 1 (KRT1) (A), decreased mRNA levels of genes encoding keratin 10 (KRT10) (C), and increased mRNA levels genes encoding involucrin (IVL) (E) in HTSKs compared with those in HNKs. Significantly increased protein levels of keratin 1 (B) and decreased protein levels of keratin 10 (D) and increased protein levels of involucrin (F) in HTSKs compared with those in HNKs. NHKs and HTSKs were primary cultured from normal skin tissues and HTS tissues, respectively. In the fold change, HNKs marked as value 1; HNK, human normal keratinocyte; HTSK, hypertrophic scar keratinocyte; *P < 0.05 for HTSK vs. the corresponding matched HNK. Data represent means ± SD; n = 4 (HNK) and n = 4 (HTSK).
Figure 3
Figure 3
Expression of apoptosis-related factors in HTSKs. Significantly increased mRNA levels of genes encoding bcl2 (BCL2) (A) and decreased mRNA levels of genes encoding caspase 14 (CASP14) (C) in HTSKs compared with those in HNKs. Significantly increased protein levels of bcl2 (B) and decreased protein levels of caspase 14 (D) in HTSKs compared with those in HNKs. NHKs and HTSKs were primary cultured from normal skin tissues and HTS tissues, respectively. In the fold change, HNKs marked as value 1; HNK, human normal keratinocyte; HTSK, hypertrophic scar keratinocyte; *P < 0.05 for HTSK vs. the corresponding matched HNK. Data represent means ± SD; n = 4 (HNK) and n = 4 (HTSK).
Figure 4
Figure 4
Expression of proliferation/differentiation regulators in HTSKs. Significantly decreased mRNA levels of genes encoding p21 (CDKN1A) (A) and p27 (CDKN1B) (C) in HTSKs compared with those in HNKs. Significantly decreased protein levels of p21 (B) and p27 (D) in HTSKs compared with those in HNKs. NHKs and HTSKs were primary cultured from normal skin tissues and HTS tissues, respectively. In the fold change, HNKs marked as value 1; HNK, human normal keratinocyte; HTSK, hypertrophic scar keratinocyte; *P < 0.05 for HTSK vs. the corresponding matched HNK. Data represent means ± SD; n = 4 (HNK) and n = 4 (HTSK).
Figure 5
Figure 5
Expression of proliferation and activation marker in HTSKs after ESWT. Significantly decreased and increased mRNA (A) and protein levels (B) of keratin 14 (KRT14), a proliferation marker in HTSKs at 24 h or 72 h after ESWT under 0.2, and 0.3 mJ/mm2 of energy flux density, comparted with those in untreated control. Significantly increased and decreased mRNA (C) and protein levels (D) of keratin 6 (KRT6), an activation marker in HTSKs at 24 h or 72 h after ESWT under 0.1, 0.2, and 0.3 mJ/mm2 of energy flux density, comparted with those in untreated control. Significantly increased and unchanged mRNA (E) and protein levels (F) of keratin 17 (KRT17), anther activation marker in HTSKs at 24 h or 72 h after ESWT, comparted with those in untreated control. In the fold change, untreated control cells marked as value 1; Ct, untreated control cells; HTSK, hypertrophic scar keratinocyte; *P < 0.05 for ESWT-treated cells vs. the corresponding matched untreated control cells. Data represent means ± SD; n = 4.
Figure 6
Figure 6
Expression of differentiation marker in HTSKs after ESWT. Significantly decreased and increased mRNA (A) and protein levels (B) of keratin 1 (KRT1) in HTSKs at 24 h or 72 h after ESWT under 0.1, 0.2, and 0.3 mJ/mm2 of energy flux density, comparted with those in untreated control. Significantly increased and decreased mRNA (C) and protein levels (D) of involucrin (IVL) in HTSKs at 24 h or 72 h after ESWT, comparted with those in untreated control. In the fold change, untreated control cells marked as value 1; Ct, untreated control cells; HTSK, hypertrophic scar keratinocyte; *P < 0.05 for ESWT-treated cells vs. the corresponding matched untreated control cells. Data represent means ± SD; n = 4.
Figure 7
Figure 7
Expression of apoptosis-related factors in HTSKs. Significantly increased and decreased mRNA levels of bax (BAX) (A) and bcl2 (BCL2) (C) in HTSKs at 24 h or 72 h after ESWT under 0.1, 0.2, and 0.3 mJ/mm2 of energy flux density, comparted with those in untreated control. Significantly increased and decreased protein levels of bax (B) and bcl2 (D) in HTSKs at 24 h or 72 h after ESWT, comparted with those in untreated control. Significantly increased mRNA (E) and protein levels (F) of ASK1 (MAP3K5) in HTSKs at 24 h or 72 h after ESWT, comparted with those in untreated control. Unchanged and significantly increased mRNA (G) and protein levels (H) of caspase 14 (CASP14) in HTSKs at 24 h or 72 h after ESWT, comparted with those in untreated control. In the fold change, untreated control cells marked as value 1; Ct, untreated control cells; HTSK, hypertrophic scar keratinocyte; *P < 0.05 for ESWT-treated cells vs. the corresponding matched untreated control cells. Data represent means ± SD; n = 4.
Figure 8
Figure 8
Expression of proliferation/differentiation regulators in HTSKs after ESWT. Significantly increased mRNA levels of genes encoding p21 (CDKN1A) (A), p27 (CDKN1B) (C), and Notch 1 (NOTCH1) (E) in HTSKs at 24 h after ESWT under 0.2 and 0.3 mJ/mm2 of energy flux density, compared with those in untreated control. Significantly decreased mRNA levels of genes encoding p21 (CDKN1A) (A), p27 (CDKN1B) (C), and Notch 1 (NOTCH1) (E) in HTSKs at 72 h after ESWT under 0.1, 0.2, and 0.3 mJ/mm2 of energy flux density, compared with those in untreated control. Significantly increased protein levels of p21 (B), p27 (D), and Notch 1 (F) in HTSKs at 24 h after ESWT under 0.2 and 0.3 mJ/mm2 of energy flux density, compared with those in untreated control. Significantly decreased protein levels of p21 (B), p27 (D), and Notch 1 (F) in HTSKs at 72 h after ESWT, compared with those in untreated control. In the fold change, untreated control cells marked as value 1; Ct, untreated control cells; HTSK, hypertrophic scar keratinocyte; *P < 0.05 for ESWT-treated cells vs. the corresponding matched untreated control cells. Data represent means ± SD; n = 4.

References

    1. Aarabi S, Longaker MT, Gurtner GC. Hypertrophic scar formation following burns and trauma: New approaches to treatment. PLoS Med. 2007;4:e234. doi: 10.1371/journal.pmed.0040234. - DOI - PMC - PubMed
    1. Choi YH, Kim KM, Kim HO, Jang YC, Kwak IS. Clinical and histological correlation in post-burn hypertrophic scar for pain and itching sensation. Ann. Dermatol. 2013;25:428–433. doi: 10.5021/ad.2013.25.4.428. - DOI - PMC - PubMed
    1. Gauglitz GG, Korting HC, Pavicic T, Ruzicka T, Jeschke MG. Hypertrophic scarring and keloids: Pathomechanisms and current and emerging treatment strategies. Mol. Med. 2011;17:113–125. doi: 10.2119/molmed.2009.00153. - DOI - PMC - PubMed
    1. Wang CJ. Extracorporeal shockwave therapy in musculoskeletal disorders. J. Orthop. Surg. Res. 2012;7:11. doi: 10.1186/1749-799x-7-11. - DOI - PMC - PubMed
    1. Mittermayr R, et al. Extracorporeal shock wave therapy (ESWT) for wound healing: Technology, mechanisms, and clinical efficacy. Wound Repair Regen. 2012;20:456–465. doi: 10.1111/j.1524-475X.2012.00796.x. - DOI - PubMed

Publication types