. 2021 Aug 27;23(5):103.
doi: 10.1208/s12248-021-00623-8.

Quantitative Systems Pharmacology Modeling of Avadomide-Induced Neutropenia Enables Virtual Clinical Dose and Schedule Finding Studies

Affiliations

Quantitative Systems Pharmacology Modeling of Avadomide-Induced Neutropenia Enables Virtual Clinical Dose and Schedule Finding Studies

Roberto A Abbiati et al. AAPS J. .

Erratum in

Abstract

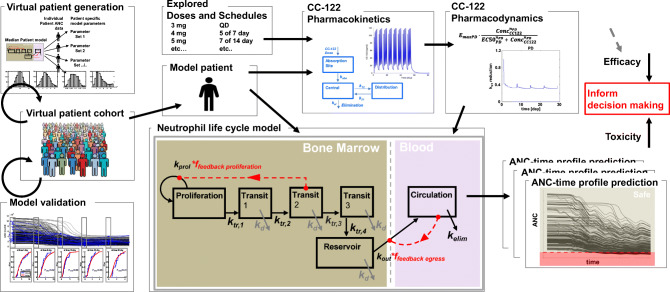
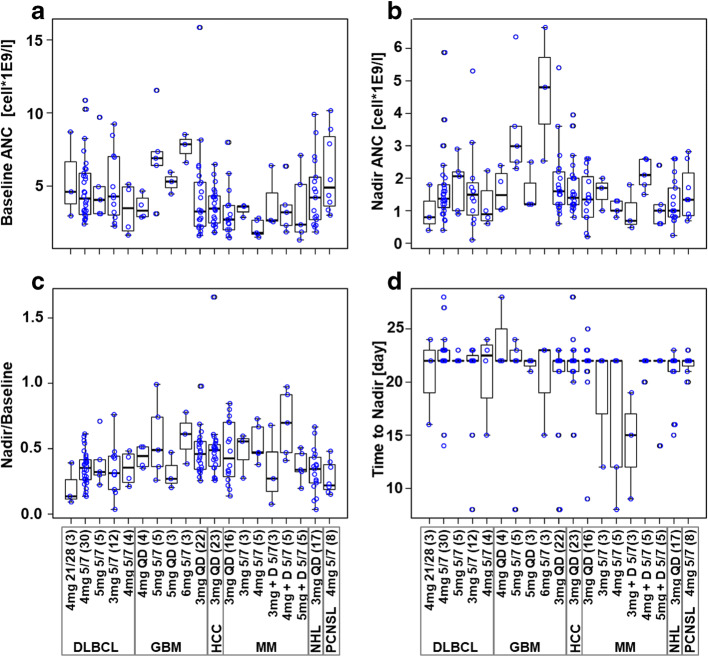
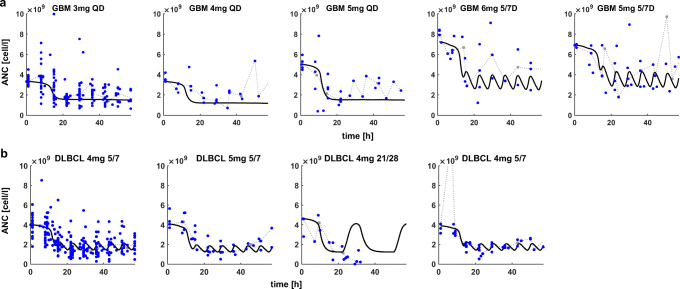
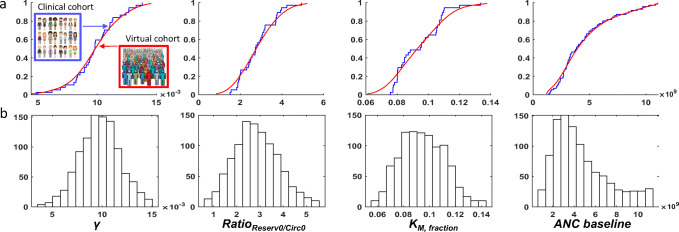
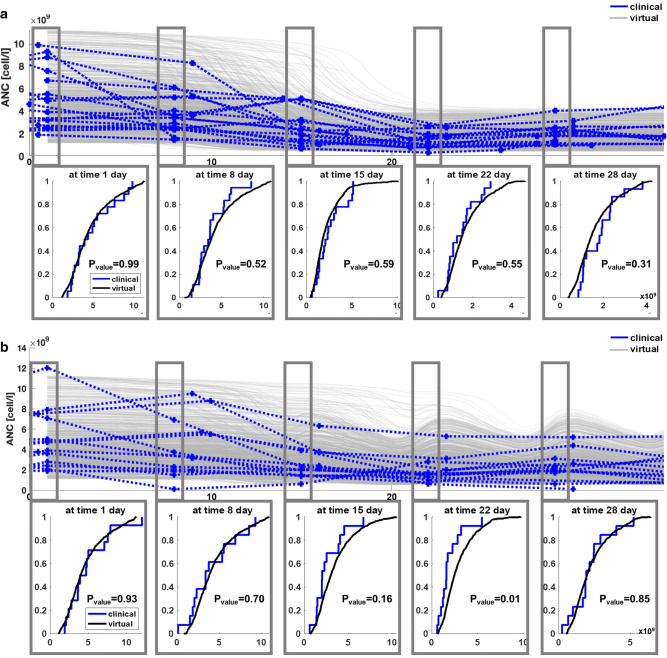
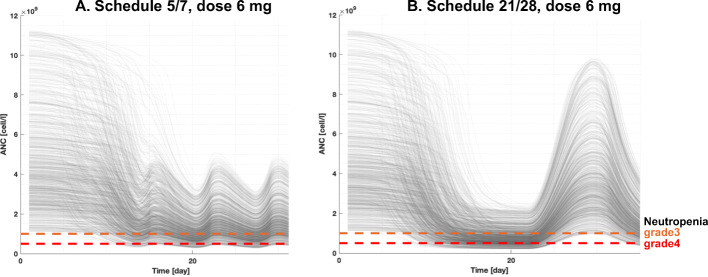
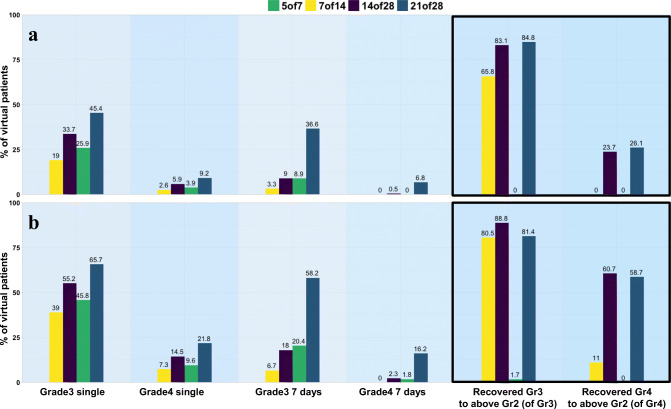
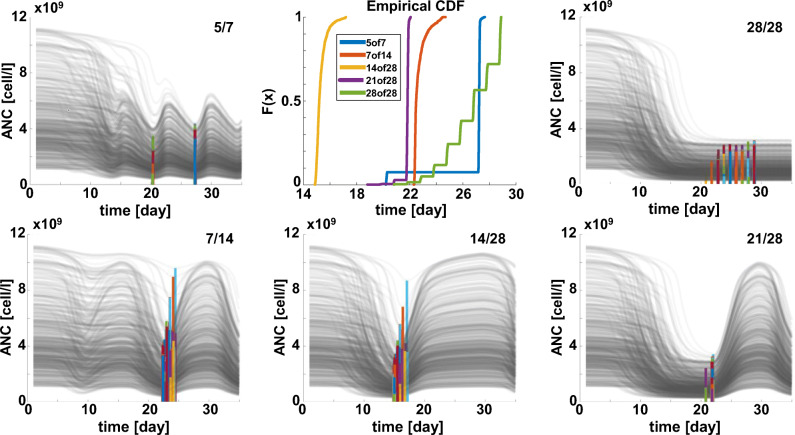
Avadomide is a cereblon E3 ligase modulator and a potent antitumor and immunomodulatory agent. Avadomide trials are challenged by neutropenia as a major adverse event and a dose-limiting toxicity. Intermittent dosing schedules supported by preclinical data provide a strategy to reduce frequency and severity of neutropenia; however, the identification of optimal dosing schedules remains a clinical challenge. Quantitative systems pharmacology (QSP) modeling offers opportunities for virtual screening of efficacy and toxicity levels produced by alternative dose and schedule regimens, thereby supporting decision-making in translational drug development. We formulated a QSP model to capture the mechanism of avadomide-induced neutropenia, which involves cereblon-mediated degradation of transcription factor Ikaros, resulting in a maturation block of the neutrophil lineage. The neutropenia model was integrated with avadomide-specific pharmacokinetic and pharmacodynamic models to capture dose-dependent effects. Additionally, we generated a disease-specific virtual patient population to represent the variability in patient characteristics and response to treatment observed for a diffuse large B-cell lymphoma trial cohort. Model utility was demonstrated by simulating the avadomide effect in the virtual population for various dosing schedules and determining the incidence of high-grade neutropenia, its duration, and the probability of recovery to low-grade neutropenia.

Keywords: CELMoD; QSP; avadomide; neutropenia; virtual patient.


Conflict of interest statement

RAA, MP, SC, DWP, SK, MM, MWBT, RL, and AVR declare employment at Bristol Myers Squibb. MP, SC, DWP, SK, MM, MWBT, RL, CCS, AVR declare equity ownership in Bristol Myers Squibb.

Figures

Figure 1
Figure 1
QSP model workflow. A virtual patient is represented as an appropriately parameterized model describing the neutrophil life cycle. This model can be solved to generate simulations of neutrophil counts in blood under homeostatic or avadomide-perturbed conditions. Avadomide effect is determined by the sequential evaluation of PK, PD, and PD-driven alteration of the neutrophil maturation. Model simulations iterated for a large cohort of virtual patients allow capturing the global pattern of neutropenia in the disease cohort under investigation. Finally, simulation results are postprocessed to compute toxicity endpoints of interest. The neutrophil life cycle model is based on a compartmental structure. The proliferation pool represents committed proliferative neutrophil precursors. From a model idealization standpoint, these cells have specific characteristics: they can proliferate but not self-renew and can proceed to subsequent maturation stages, represented in the model as a sequence of transit compartments. These compartments (i.e., transit 1, transit 2, and transit 3) do not have a direct biological counterpart but here are intended to capture the fact that progressive maturation implies a time delay, in line with previously published implementations of neutrophil maturation models. Once maturation is completed, cells are stored in a bone marrow reservoir pool, awaiting egress into peripheral blood circulation. Circulation pool represents circulating neutrophils (i.e., level of neutrophils in blood, comparable to clinical ANC). Finally, circulating neutrophils are subjected to terminal elimination (cell death)
Figure 2
Figure 2
Boxplots of ANC patterns for avadomide-treated patients in multiple disease cohorts. Blue dots show data for individual patients. a Average of available ANC measurements prior to treatment start; b lowest ANC measured within first treatment cycle; c nadir normalized to baseline; d time of nadir (typically day 22, however this result is conditioned by clinical sampling schedule, true value expected between days 16 and 28). Text boxes at the bottom indicate disease cohorts, specific doses and schedules, and number of patients in parenthesis. For MM cohort, “+D” label means avadomide + dexamethasone. NCT01421524 trial cohorts included patients with glioblastoma (GBM), multiple myeloma (MM), diffuse large B-cell lymphoma (DLBCL), hepatocellular carcinoma (HCC), and primary central nervous system lymphoma (PCNSL). (References to related avadomide clinical trial data and data processing details in Supplementary Materials 1.3)
Figure 3
Figure 3
Clinical measures of ANC (blue dots, individual (processed) clinical ANC; gray-dotted line, clinical ANC median profile) for GBM and DLBCL dose groups. Post-avadomide administration, ANC level are quite stable for the measures at day 1 and 8, followed by a drop at day 15, with nadir typically observed at day 22. a Model best-fit (black-solid line) to ANC data for all GBM dose groups; b model best-fit to ANC data for multiple DLBCL dose groups. Schedules: QD, daily dosing; 5/7, 5 days on, 2 days off; 21/28, 21 days on, 7 days off
Figure 4
Figure 4
Virtual cohort generation. a Cumulative empirical distributions for DLBCL fitted parameter values (blue) vs probability density function estimates (red). b Histograms of final parameter value distributions for 1000 virtual patients
Figure 5
Figure 5
Model validation results. a Avadomide 3-mg QD. Top: longitudinal ANC profiles, virtual cohort (1000 subjects) = gray-solid, clinical cohort (18 patients) = blue-dotted. Bottom: K-S test for equivalence of cumulative distribution profiles (with 5% significance level Pvalue). b Avadomide 3mg 5/7 day. Top: longitudinal ANC profiles, virtual cohort (1000 subjects) = gray-solid, clinical cohort (14 patients) = blue-dotted. Bottom: K-S test for equivalence of cumulative distribution profiles (with 5% significance level Pvalue). Virtual and clinical ANC distributions were taken at day 1, 8, 16, 22, and 28 and compared using the two-sample K-S test. Distribution equivalence rejected only for 3mg 5/7 at day 22 (i.e., equivalence verified at day 1, 8, 16, 28, but not at day 22). The K-S test confirms that all the simulated profiles for the virtual cohort run to a clinically plausible state
Figure 6
Figure 6
Simulation of the same 1000 virtual patients for avadomide 6 mg on a 5/7 (a) or 21/28 (b) schedule. Neutropenia grades 3 (orange) and 4 (red) are represented as horizontal dashed lines. The ANC baseline distribution (i.e., ANC at t=0) is the same because the same virtual patients are simulated for both dosing schedules. The two schedules enable very similar PK exposure over the first treatment cycle; however, the neutropenia pattern is quite different: schedule 21/28 shows deeper ANC drop and protracted toxicity, followed by strong recovery once the treatment is interrupted. In contrast, schedule 5/7 offers a mitigated incidence of high-grade toxicity, with only limited recovery during dose interruption
Figure 7
Figure 7
Bar plot analysis for toxicity and recovery for different schedules at 4 mg (a) and 6 mg (b). Grades 3 and 4 single indicate the percentage of virtual patients experiencing at least one event of neutrophil level below the respective toxic threshold. Grades 3 and 4 7 days indicate percentage of virtual patients experiencing an extended and uninterrupted toxicity for at least 7 days. Recovery Gr3 to above Gr2 and Gr4 to above Gr2 indicate the percentage of patients that recovered to grade 1 (i.e., above grade 2) relative to the patients that experienced toxicity. This analysis is limited to the first treatment cycle
Figure 8
Figure 8
Time of nadir across schedules. Central top panel shows the empirical cumulative distributions of the time of occurrence of nadir for different schedules. Surrounding plots offer a visual justification for the observed nadir-time pattern. These plots show longitudinal ANC profile for 500 virtual patients with graphical visualization of individual nadirs by vertical-colored bars. Bar heigh depends on the individual ANC at nadir

Similar articles

Cited by

References

    1. Hong CW. Current understanding in neutrophil differentiation and heterogeneity. Immune Netw. 2017:298–306. - PMC - PubMed
    1. Hidalgo A, Chilvers ER, Summers C, Koenderman L. The neutrophil life cycle. Trends Immunol. Elsevier Ltd. 2019;40:584–597. - PubMed
    1. Mortaz E, Alipoor SD, Adcock IM, Mumby S, Koenderman L. Update on neutrophil function in severe inflammation. Front Immunol. 2018;9:2171. - PMC - PubMed
    1. von Vietinghoff S, Ley K. Homeostatic regulation of blood neutrophil counts. J Immunol. 2008;181:5183–5188. - PMC - PubMed
    1. FDA. Guidance for Industry. Toxicity grading scale for healthy adult and adolescent volunteers enrolled in preventive vaccine clinical trials. 2007. - PubMed

MeSH terms

Substances

LinkOut - more resources