. 2022 Apr;13(2):219-233.
doi: 10.1007/s13239-021-00568-1. Epub 2021 Aug 27.

Cycle Length Evaluation in Persistent Atrial Fibrillation Using Kernel Density Estimation to Identify Transient and Stable Rapid Atrial Activity

Affiliations

Cycle Length Evaluation in Persistent Atrial Fibrillation Using Kernel Density Estimation to Identify Transient and Stable Rapid Atrial Activity

Szabolcs Z Nagy et al. Cardiovasc Eng Technol. 2022 Apr.

Abstract

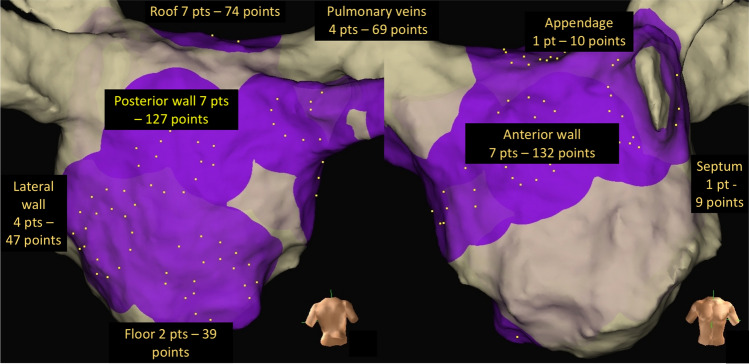
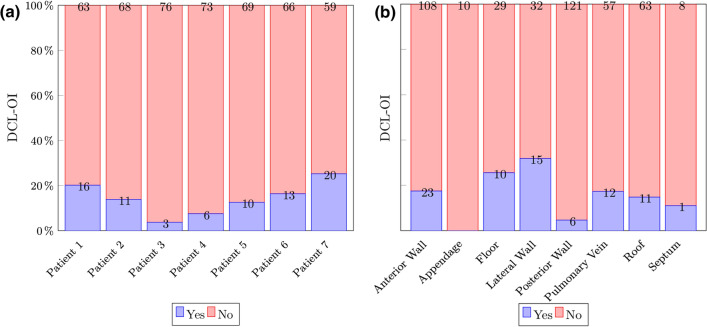
Purpose: Left atrial (LA) rapid AF activity has been shown to co-localise with areas of successful atrial fibrillation termination by catheter ablation. We describe a technique that identifies rapid and regular activity.

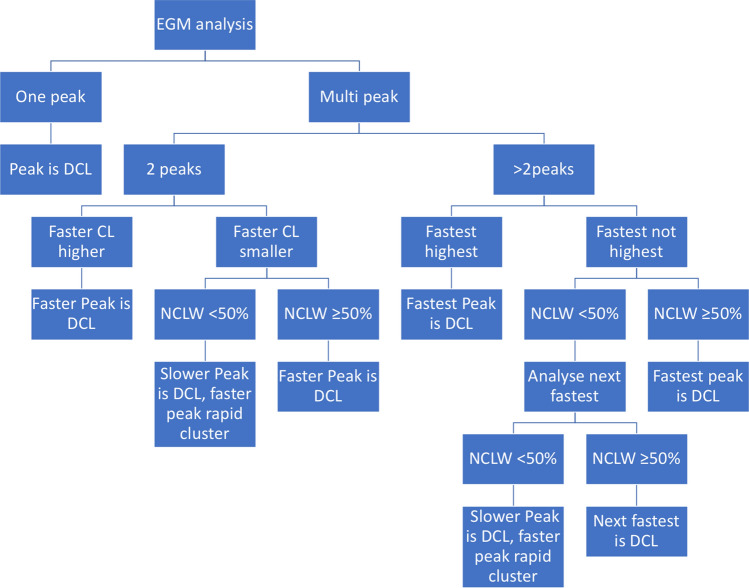
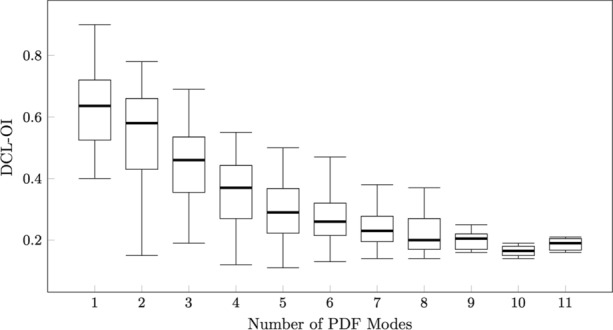
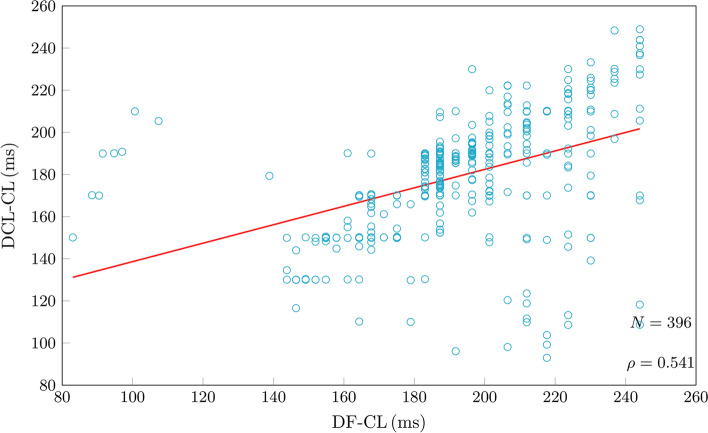
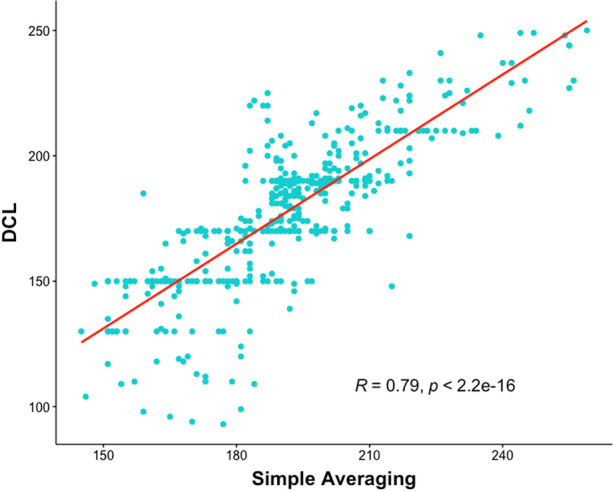
Methods: Eight-second AF electrograms were recorded from LA regions during ablation for psAF. Local activation was annotated manually on bipolar signals and where these were of poor quality, we inspected unipolar signals. Dominant cycle length (DCL) was calculated from annotation pairs representing a single activation interval, using a probability density function (PDF) with kernel density estimation. Cumulative annotation duration compared to total segment length defined electrogram quality. DCL results were compared to dominant frequency (DF) and averaging.

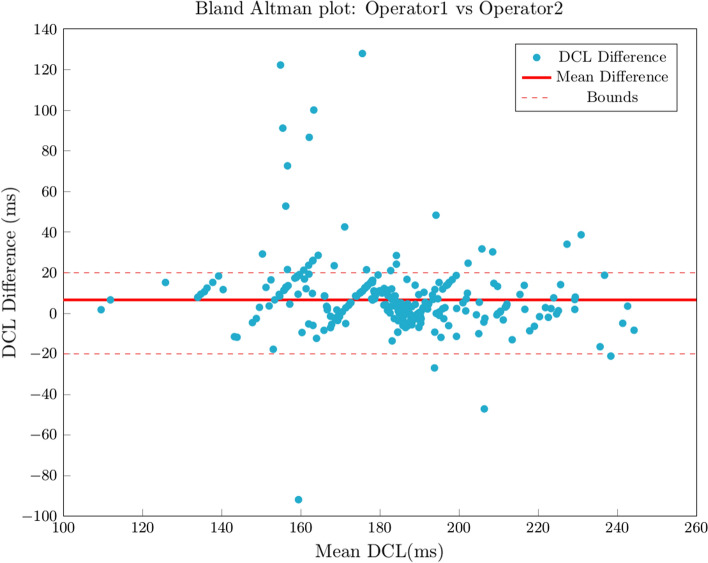
Results: In total 507 8 s AF segments were analysed from 7 patients. Spearman's correlation coefficient was 0.758 between independent annotators (P < 0.001), 0.837-0.94 between 8 s and ≥ 4 s segments (P < 0.001), 0.541 between DCL and DF (P < 0.001), and 0.79 between DCL and averaging (P < 0.001). Poorer segment organization gave greater errors between DCL and DF.

Conclusion: DCL identifies rapid atrial activity that may represent psAF drivers. This study uses DCL as a tool to evaluate the dynamic, patient specific properties of psAF by identifying rapid and regular activity. If automated, this technique could rapidly identify areas for ablation in psAF.

Keywords: Ablation; Biomedical signal processing; Cardiology; Extra pulmonary vein drivers; Intracardiac electrograms.


Conflict of interest statement

Authors Kasi, Afonso, Bird, Pederson, Kim are employees of Abbott, Inc.

Figures

Figure 1
Figure 1
Electrogram samples were collected from all major regions of the left atrium to ensure that the algorithm was tested on electrograms with various characteristics.
Figure 2
Figure 2
Use of unipolar electrogram in identifying local activations. In case of difficult to interpret bipolar electrograms, the corresponding unipolar electrograms can be loaded into the EnSite Electrogram Analysis Tool (EEAT) enabling identification of local activation based on maximum negative dV/dt. Local activations are assessed in pairs. From the left, the pair marked with green concludes at the same point that the next annotation pair marked in blue starts, thereby ensuring that all local activation pairs are taken individually.
Figure 3
Figure 3
Kernel density estimation compared to histogram based analysis. CL AF cycle length from manual annotations, SL AF segment length, OI dominant cycle length organisational index, n local activation pair samples within the peak, span summative time of all local activation pairs within the peak.
Figure 4
Figure 4
Flowchart representing the algorithm used to define dominant cycle length and rapid cluster cycle length within each 8 s atrial fibrillation segment. DCL: dominant cycle length; CL: cycle length; NCLW: number of cycle length data in ± 5 ms window.
Figure 5
Figure 5
Frequency percentage of all valid segments by proportion of segment annotated. The majority of segments had annotations that covered ≥ 50% (4 s) of the segment.
Figure 6
Figure 6
Bland Altman plots describing measurement differences between Operator 1 vs Operator 2. Red line represents mean difference.
Figure 7
Figure 7
Dominant cycle length organisational index (DCL-OI) and Peak number by patient. Patient 1 had the highest DCL-OI and a low number of segments with peak count > 2.
Figure 8
Figure 8
The relationship between dominant cycle length organisational index (DCL-OI) and peak number shows a tendency for higher DCL-OI with fewer peaks.
Figure 9
Figure 9
Regional distribution of Dominant cycle length organisational index (DCL-OI) .
Figure 10
Figure 10
Percentage of highly organised areas according to Dominant cycle length organisational index (DCL-OI), by patient (A) and by region. (B). Highly organized areas appear in blue.
Figure 11
Figure 11
Comparison of manual dominant cycle length (DCL) results and cycle length results based on dominant frequency (DF) analysis. There was moderate correlation and intraclass correlation was poor.
Figure 12
Figure 12
Absolute measurement errors of dominant frequency-based (DF) cycle length compared with manual dominant cycle length (DCL) (left). Bland Altman plot of differences between DF based CL and manual DCL. Red line represents mean difference (right).
Figure 13
Figure 13
Dominant cycle length organisational index (DCL-OI) plotted against absolute measurement errors between dominant frequency-based (DF) results and dominant cyle length (DCL) results (left). Box plot of DCL-OI of segments that had > 20 ms measurement difference compared with those that had  < 20 ms measurement disagreement.
Figure 14
Figure 14
Correlation of results from the dominant cycle length (DCL) algorithm compared with simple averaging. Linear regression line in red, R = Spearman’s rho.

References

    1. Atienza F, Almendral J, Ormaetxe JM, Moya Á, Martínez-Alday JD, Hernández-Madrid A, Castellanos E, Arribas F, Arias MÁ, Tercedor L, Peinado R, Fe Arcocha M, Ortiz M, Martínez-Alzamora N, Arenal Á, Fernández-Avilés F, Jalife J. Comparison of radiofrequency catheter ablation of drivers and circumferential pulmonary vein isolation in atrial fibrillation: A noninferiority randomized multicenter RADAR-AF trial. J. Am. Coll. Cardiol. 2014;64:2455–2467. doi: 10.1016/j.jacc.2014.09.053. - DOI - PubMed
    1. Brooks AG, Stiles MK, Laborderie J, Lau DH, Kuklik P, Shipp NJ, Hsu LF, Sanders P. Outcomes of long-standing persistent atrial fibrillation ablation: a systematic review. Heart Rhythm. 2010;7:835–846. doi: 10.1016/j.hrthm.2010.01.017. - DOI - PubMed
    1. Calvo D, Rubín J, Pérez D, Morís C. Ablation of rotor domains effectively modulates dynamics of human: long-standing persistent atrial fibrillation. Circ. Arrhythmia Electrophysiol. 2017;10:1–14. doi: 10.1161/CIRCEP.117.005740. - DOI - PubMed
    1. Cappato R, Calkins H, Chen S, Davies W, Iesaka Y, Kalman J, Kim Y, Klein G, Natale A, Packer D, Skanes A, Ambrogi F, Biganzoli E. Updated worldwide survey on the methods, efficacy, and safety of catheter ablation for human atrial fibrillation. Circ. Arrhythmia Electrophysiol. 2010;3:32–38. doi: 10.1161/CIRCEP.109.859116. - DOI - PubMed
    1. Cuculich PS, Wang Y, Lindsay BD, Faddis MN, Schuessler RB, Damiano RJ, Li L, Rudy Y. Noninvasive characterization of epicardial activation in humans with diverse atrial fibrillation patterns. Circulation. 2010;122:1364–1372. doi: 10.1161/CIRCULATIONAHA.110.945709. - DOI - PMC - PubMed

Publication types