. 2021 Dec;21(12):3990-4002.
doi: 10.1111/ajt.16818. Epub 2021 Sep 6.

Cellular immunity predominates over humoral immunity after homologous and heterologous mRNA and vector-based COVID-19 vaccine regimens in solid organ transplant recipients

Affiliations

Cellular immunity predominates over humoral immunity after homologous and heterologous mRNA and vector-based COVID-19 vaccine regimens in solid organ transplant recipients

Tina Schmidt et al. Am J Transplant. 2021 Dec.

Abstract

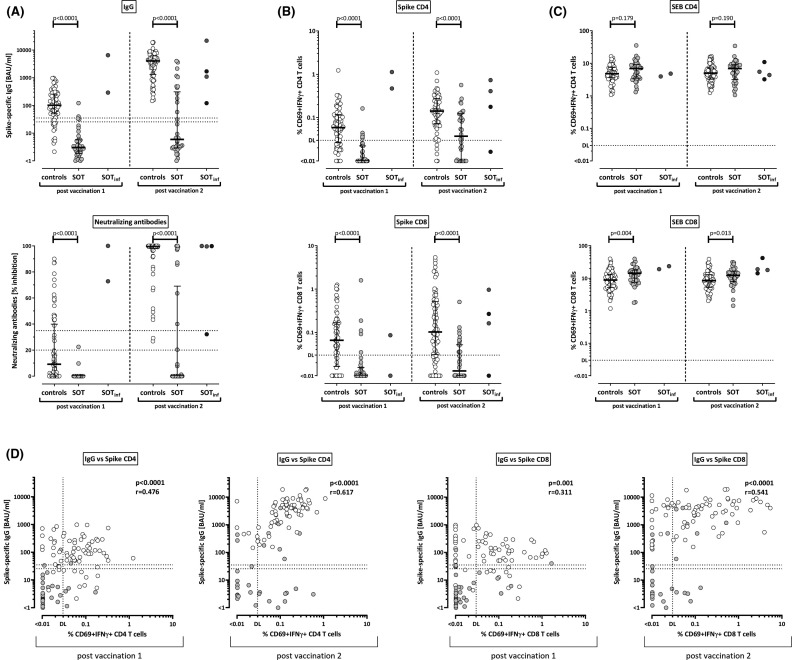
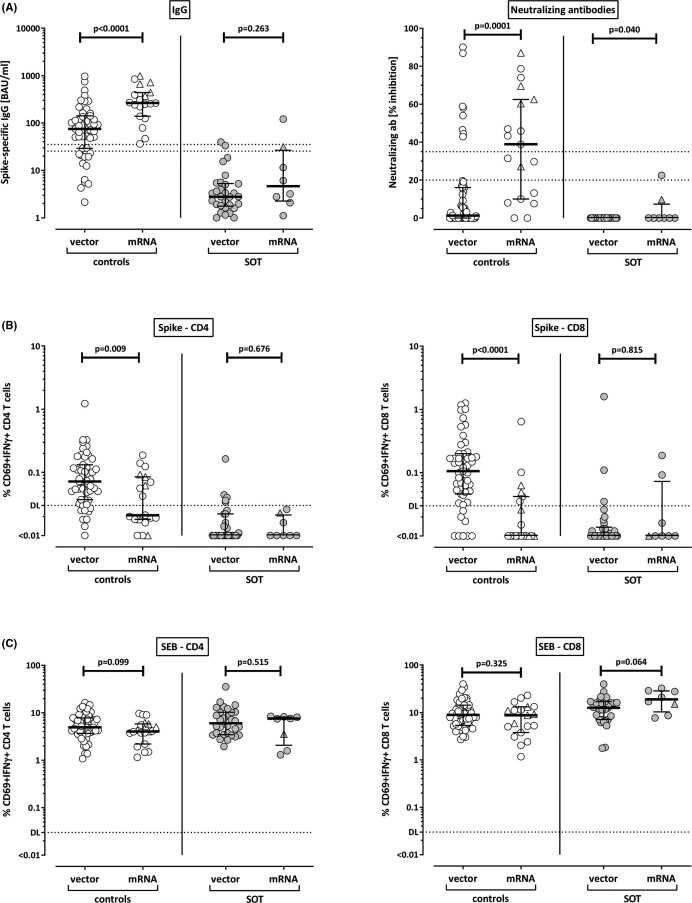
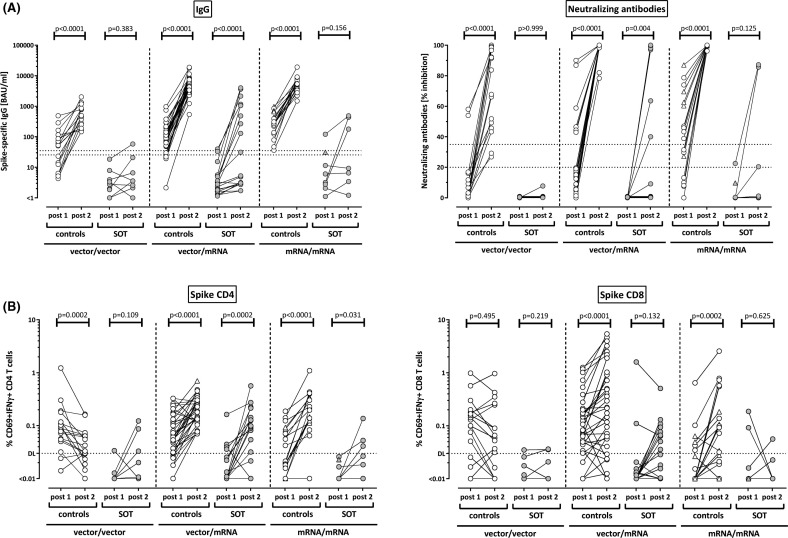
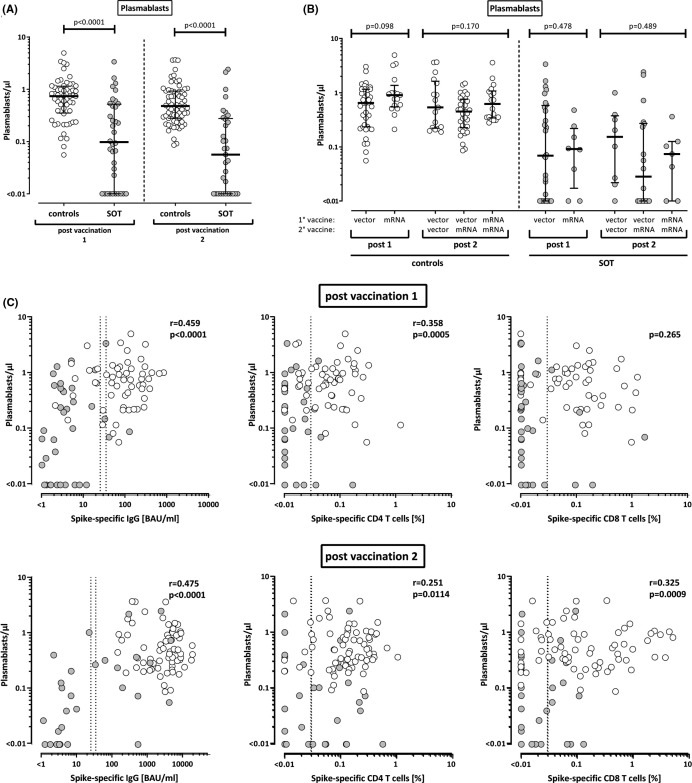
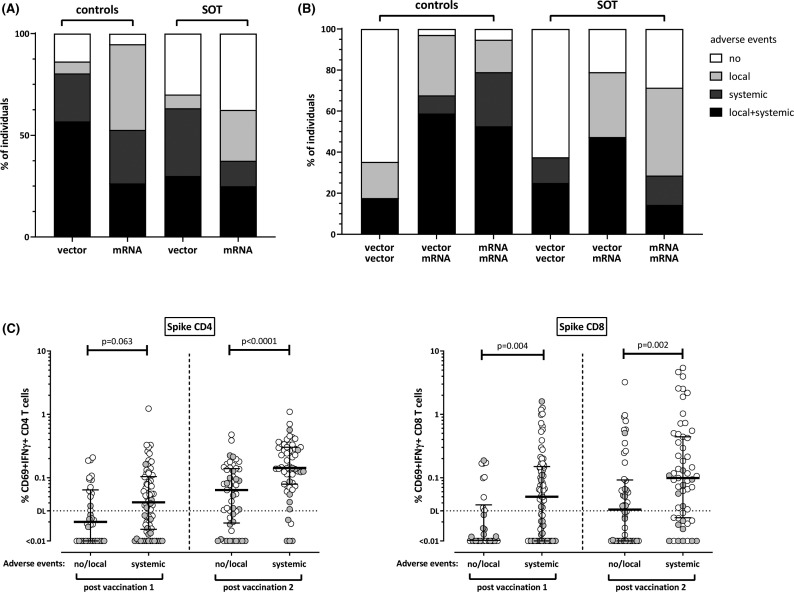
Knowledge on the immunogenicity of vector-based and mRNA-vaccines in solid organ transplant recipients is limited. Therefore, SARS-CoV-2-specific T cells and antibodies were analyzed in 40 transplant recipients and 70 controls after homologous or heterologous vaccine-regimens. Plasmablasts and SARS-CoV-2-specific CD4 and CD8 T cells were quantified using flow cytometry. Specific antibodies were analyzed by ELISA and neutralization assay. The two vaccine types differed after the first vaccination, as IgG and neutralizing activity were more pronounced after mRNA priming (p = .0001 each), whereas CD4 and CD8 T cell levels were higher after vector priming (p = .009; p = .0001). All regimens were well tolerated, and SARS-CoV-2-specific antibodies and/or T cells after second vaccination were induced in 100% of controls and 70.6% of transplant recipients. Although antibody and T cell levels were lower in patients, heterologous vaccination led to the most pronounced induction of antibodies and CD4 T cells. Plasmablast numbers were significantly higher in controls and correlated with SARS-CoV-2-specific IgG- and T cell levels. While antibodies were only detected in 35.3% of patients, cellular immunity was more frequently found (64.7%) indicating that assessment of antibodies is insufficient to identify COVID-19-vaccine responders. In conclusion, heterologous vaccination seems promising in transplant recipients, and combined analysis of humoral and cellular immunity improves the identification of responders among immunocompromised individuals.

Keywords: T cell biology; clinical research/practice; flow cytometry; infection and infectious agents - viral; infectious disease; vaccine.


Figures

FIGURE 1
FIGURE 1
T cell and antibody responses in controls and transplant recipients after SARS-CoV-2–specific vaccination. (A) Levels of spike-specific IgG and neutralizing antibodies were determined by ELISA and neutralization assay, respectively, and compared between healthy controls (open symbols) and solid organ transplant recipients (SOT, filled symbols). Levels of SARS-CoV-2–specific (B) and SEB-reactive (C) CD4 and CD8 T cells were flow cytometrically determined after antigen-specific stimulation in vitro followed by intracellular cytokine staining, and compared between groups. In panels A–C, results of four vaccinated transplant recipients with a previously unknown history of asymptomatic SARS-CoV-2 infection (two before [gray symbols] and two after the first vaccination [black symbols]) are displayed separate from the remaining baseline-negative transplant recipients and excluded from statistical analyses. Bars represent medians with interquartile ranges. Differences between the groups were calculated using Mann–Whitney test. (D) Correlations between IgG titers and SARS-CoV-2–specific CD4 and CD8 T cells are shown (calculated according to Spearman) for controls (white symbols) and transplant recipients (gray symbols). Correlation parameters for controls and transplant recipients as individual groups are summarized in Table S1. Dotted lines indicate limits for IgG and neutralizing antibodies, including negative, intermediate, and positive results, respectively, as per the manufacturer’s instructions, or detection limits (DL) for SARS-CoV-2–specific and SEB-reactive CD4 and CD8 T cells, respectively. All analyses were performed after the first and after the second vaccination. IFN, interferon
FIGURE 2
FIGURE 2
SARS-CoV-2–specific antibodies and T cells after priming stratified according to vector and mRNA vaccines. (A) Levels of SARS-CoV-2–specific IgG and neutralizing antibodies, as well as levels of SARS-CoV-2–specific (B) and SEB-reactive (C) CD4 and CD8 T cells after priming with vector or mRNA vaccines were compared among controls (open symbols) or among solid organ transplant recipients (SOT, filled symbols). Individuals who received the mRNA-1273 vaccine are indicated by triangles (5 controls, 1 SOT). Bars represent medians with interquartile ranges. Differences between the groups were calculated using Mann–Whitney test. Dotted lines in (A) indicate limits for IgG and neutralizing antibodies, including negative, intermediate and positive results, respectively as per manufacturer’s instructions. In (B) and (C) dotted lines indicate detection limits (DL) for SARS-CoV-2–specific and SEB-reactive CD4 and CD8 T cells. IFN, interferon
FIGURE 3
FIGURE 3
Induction of humoral and cellular immunity after homologous and heterologous vaccine regimens in controls and transplant recipients. (A) Levels of SARS-CoV-2–specific IgG and neutralizing antibodies, as well as (B) levels of SARS-CoV-2–specific CD4 and CD8 T cells after homologous vector vaccination (vector/vector), after heterologous vaccination (vector/mRNA) or after homologous mRNA vaccination (mRNA/mRNA) were compared among controls or among solid organ transplant recipients (SOT). Individuals who received the mRNA-1273 vaccine are indicated by triangles (one control in the heterologous vector/mRNA group, five controls and the transplant recipient in the homologous mRNA/mRNA group, who had evidence of infection after the first vaccination). Differences between priming and boosting were calculated by the Wilcoxon matched pairs test. Dotted lines in (A) indicate limits for IgG and neutralizing antibodies, including negative, intermediate, and positive results, respectively, as per the manufacturer’s instructions. In (B) dotted lines indicate detection limits (DL) for SARS-CoV-2–specific CD4 and CD8 T cells. IFN, interferon
FIGURE 4
FIGURE 4
Levels of plasmablasts in healthy controls and transplant recipients after SARS-CoV-2 vaccination and correlation with antibody and T cell responses. Numbers of plasmablasts were compared (A) between healthy controls (n = 56 after first and n = 68 after second vaccination) and solid organ transplant recipients (SOT, n = 36 and n = 33, respectively) and (B) between individuals after immunization with vector-based and/or mRNA vaccines. (C) Plasmablasts were correlated with levels of SARS-CoV-2 spike-specific IgG and CD4 and CD8 T cells. Correlation parameters for controls (white symbols) and transplant recipients (gray symbols) as individual groups are summarized in Table S1. Individuals who received the mRNA-1273 vaccine are indicated by triangles in (B) (1 control in the heterologous vector/mRNA group, 4 controls and 1 transplant recipient in the homologous mRNA/mRNA group). Bars in (A) and (B) represent medians with interquartile ranges. Differences between the groups were calculated using Mann-Whitney test or Kruskal-Wallis test for comparison of two or three groups, respectively. Correlations in (C) were analyzed according to Spearman. Dotted lines indicate detection limits for IgG, indicating negative, intermediate, and positive levels, respectively, as per the manufacturer’s instructions (left panel) or detection limit for SARS-CoV-2–specific CD4 and CD8 T cells (middle and right panels, respectively)
FIGURE 5
FIGURE 5
Increased levels of SARS-CoV-2–specific T cells in individuals with systemic adverse events after vaccination. Controls and solid organ transplant recipients (SOT) were subdivided according to occurrence of adverse events (no, local, systemic, local, and systemic) after immunization with vector-based or mRNA vaccines after (A) first and (B) second vaccination. Local adverse events included pain, swelling, or redness at the injection site. Systemic adverse events included tiredness, fatigue, fever, headache, chills, myalgia, arthralgia, nausea, vomiting, diarrhea, dizziness, and or allergic reactions. Controls after primary vector vaccination reported more systemic adverse events than controls after mRNA priming (p = .033, Fisher´s test). (C) SARS-CoV-2–specific CD4 and CD8 T cell levels were compared between individuals with no or local adverse events and individuals with systemic symptoms. Controls and transplant recipients are denoted with white and grey symbols, respectively. Bars represent medians with interquartile ranges. Differences between the groups were calculated using Mann–Whitney test. Dotted lines indicate detection limits for SARS-CoV-2–specific T cells

References

    1. Voysey M, Clemens SAC, Madhi SA, et al. Safety and efficacy of the ChAdOx1 nCoV-19 vaccine (AZD1222) against SARS-CoV-2: an interim analysis of four randomised controlled trials in Brazil, South Africa, and the UK. Lancet. 2021;397(10269):99–111. - PMC - PubMed
    1. Baden LR, El Sahly HM, Essink B, et al. Efficacy and safety of the mRNA-1273 SARS-CoV-2 vaccine. N Engl J Med. 2021;384(5):403–416. - PMC - PubMed
    1. Polack FP, Thomas SJ, Kitchin N, et al. Safety and efficacy of the BNT162b2 mRNA Covid-19 vaccine. N Engl J Med. 2020;383(27):2603–2615. - PMC - PubMed
    1. Schmidt T, Klemis V, Schub D, et al. Immunogenicity and reactogenicity of heterologous ChAdOx1 nCoV-19/mRNA vaccination. Nat Med. 2021; 10.1038/s41591-021-01464-w. - DOI - PMC - PubMed
    1. Danziger-Isakov L, Blumberg EA, Manuel O, Sester M. Impact of COVID-19 in solid organ transplant recipients. Am J Transplant. 2021;21(3):925–937. - PMC - PubMed

LinkOut - more resources