. 2021 Sep 14;54(9):2133-2142.e3.
doi: 10.1016/j.immuni.2021.08.001. Epub 2021 Aug 13.

Rapid induction of antigen-specific CD4+ T cells is associated with coordinated humoral and cellular immunity to SARS-CoV-2 mRNA vaccination

Affiliations

Rapid induction of antigen-specific CD4+ T cells is associated with coordinated humoral and cellular immunity to SARS-CoV-2 mRNA vaccination

Mark M Painter et al. Immunity. .

Abstract

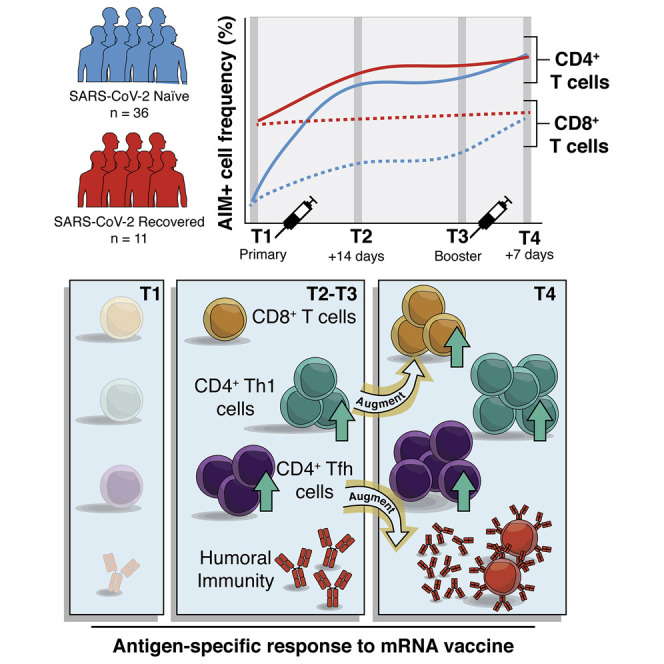
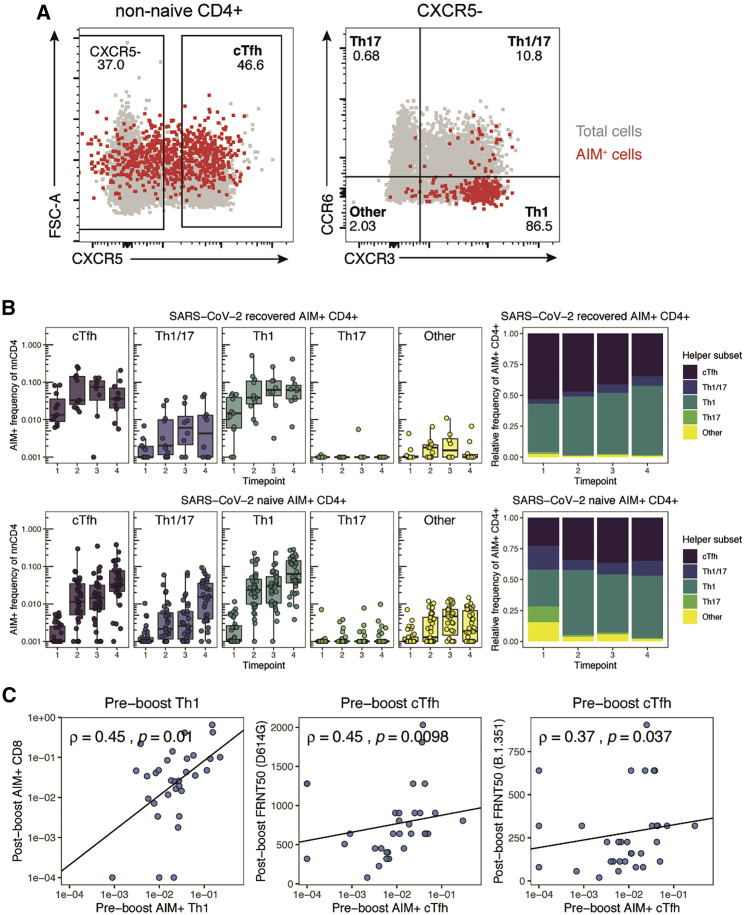
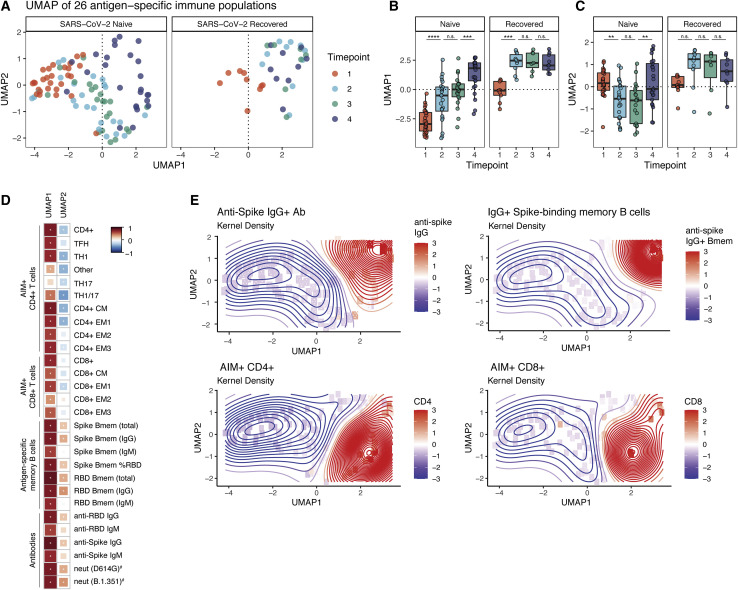
SARS-CoV-2 mRNA vaccines have shown remarkable clinical efficacy, but questions remain about the nature and kinetics of T cell priming. We performed longitudinal antigen-specific T cell analyses on healthy SARS-CoV-2-naive and recovered individuals prior to and following mRNA prime and boost vaccination. Vaccination induced rapid antigen-specific CD4+ T cell responses in naive subjects after the first dose, whereas CD8+ T cell responses developed gradually and were variable in magnitude. Vaccine-induced Th1 and Tfh cell responses following the first dose correlated with post-boost CD8+ T cells and neutralizing antibodies, respectively. Integrated analysis revealed coordinated immune responses with distinct trajectories in SARS-CoV-2-naive and recovered individuals. Last, whereas booster vaccination improved T cell responses in SARS-CoV-2-naive subjects, the second dose had little effect in SARS-CoV-2-recovered individuals. These findings highlight the role of rapidly primed CD4+ T cells in coordinating responses to the second vaccine dose in SARS-CoV-2-naive individuals.

Keywords: AIM; SARS-CoV-2; T cells; T follicular helper; Tfh; Th1; activation induced markers; immunological memory; mRNA vaccine.


Conflict of interest statement

Declaration of interests S.E.H. has received consultancy fees from Sanofi Pasteur, Lumen, Novavax, and Merk for work unrelated to this study. E.J.W. is a consultant or an adviser for Merck, Elstar, Janssen, Related Sciences, Synthekine, and Surface Oncology. E.J.W. is a founder of Surface Oncology and Arsenal Biosciences. E.J.W. is an inventor on a patent (U.S. Patent No. 10,370,446) submitted by Emory University that covers the use of PD-1 blockade to treat infections and cancer. A.S. is a consultant for Gritstone, Flow Pharma, CellCarta, Arcturus, Oxfordimmunotech, and Avalia. La Jolla Institute for Immunology has filed for patent protection for various aspects of T cell epitope and vaccine design work.

Figures

None
Graphical abstract
Figure 1
Figure 1
mRNA vaccination elicits antigen-specific CD4+ and CD8+ T cell responses (A) Longitudinal study design and representative flow cytometry plots for identifying AIM+ CD4+ T cells (left) and visualizing AIM+ CD8+ T cells (right). Numbers represent the frequency of total non-naive CD4+ or CD8+ T cells. The CD4-S peptide megapool was used for analysis of CD4+ T cells, while the CD8-E peptide megapool was used for analysis of CD8+ T cells. (B) Summary plots of AIM+ CD4+ (left) and CD8+ (right) T cells defined as indicated above each plot. AIM+ CD8+ T cells were quantified throughout the study on the basis of expression of at least four of five activation induced markers (CD200, CD40L, 41BB, CD107a, and intracellular IFN-γ), as in Figure S1C. Values represent the frequency of AIM+ non-naive cells after subtracting the frequency from paired unstimulated samples. Solid lines connect individual donors sampled longitudinally. Statistics were calculated using unpaired Wilcoxon test. n.s., not significant. ∗p < 0.05, ∗∗p < 0.01, ∗∗∗p < 0.001, ∗∗∗∗p < 0.0001. Blue indicates SARS-CoV-2-naive, red indicates SARS-CoV-2-recovered individuals. Longitudinal samples from 36 SARS-CoV-2-naive and 11 SARS-CoV-2-recovered individuals were used for each experiment, analyzed in nine independent batches. All paired longitudinal samples were analyzed within a single batch. See also Figures S1 and S2.
Figure 2
Figure 2
mRNA vaccination induces antigen-specific memory T cells that mirror memory T cell responses from natural infection (A and C) Representative flow cytometric plots depicting the gating of AIM+ CD4+ (CD200+CD40L+; A) and CD8+ (four of five markers; C) T cells to identify the indicated memory T cell subsets in a SARS-CoV-2-naive donor at time point 4. Red events depict AIM+ cells, gray events depict total CD4+ (A) or CD8+ (C) T cells from the same donor. Numbers indicate the frequency of AIM+ cells falling within each gate. (B and D) Frequency of memory T cell subsets in AIM+ CD4+ (B) and AIM+ CD8+ (D) T cells. Top panels depict SARS-CoV-2-recovered donors. Bottom panels depict SARS-CoV-2-naive donors. Left panels depict the background-subtracted percentage of non-naive T cells that are AIM+ cells of each subset. Right panels depict the relative frequency of each memory T cell subset in the background-subtracted AIM+ population. CM, CD45RA CD27+ CCR7+; EM1, CD45RA CD27+ CCR7; EM2, CD45RA CD27 CCR7+; EM3, CD45RA CD27 CCR7; EMRA, CD45RA+ CD27 CCR7. Time points are as defined in Figure 1A. Boxplots represent median with interquartile range. Longitudinal samples from 36 SARS-CoV-2-naive and 11 SARS-CoV-2-recovered individuals were used for each experiment, analyzed in nine independent batches. All paired longitudinal samples were analyzed within a single batch. See also Figure S3.
Figure 3
Figure 3
Early antigen-specific CD4+ helper T cell responses shape humoral and cellular adaptive immune responses to mRNA vaccination (A) Representative flow cytometric plots depicting the gating of AIM+ (CD200+CD40L+) CD4+ T cells to identify the indicated helper subsets in a SARS-CoV-2-naive donor at time point 4. Red events depict AIM+ T cells, gray events depict total CD4+ T cells from the same donor. (B) Frequency of T helper subsets in AIM+ CD4+ T cells. Top panel depicts SARS-CoV-2-recovered donors. Bottom panel depicts SARS-CoV-2-naive donors. Left panel depicts the background-subtracted percentage of non-naive CD4+ T cells that are AIM+ helper T cells in each subset. Right panel depicts the relative frequency of each helper T cell subset in the background-subtracted AIM+ population. cTfh, CXCR5+ of non-naive CD4+ T cells; Th1, CXCR5 CXCR3+ CCR6; Th17, CXCR5 CXCR3 CCR6+; Th1/17, CXCR5 CXCR3+ CCR6+; Other, CXCR5 CXCR3 CCR6. Boxplots represent median with interquartile range. (C) Correlations between the frequency of pre-boost (time point 2) AIM+ Th1 or AIM+ cTfh cells with post-boost (time point 4) AIM+ CD8+ T cells or neutralizing titers against dominant (D614G) or variant (B.1.351) strains of SARS-CoV-2 as published in a previous study of the same cohort (Goel et al., 2021). FRNT50, focus reduction neutralization titer 50%. Only SARS-CoV-2-naive donors were considered for these correlations. Associations were calculated using Spearman rank correlation and are shown with Pearson trend lines for visualization. Time points are as defined in Figure 1A. Longitudinal samples from 36 SARS-CoV-2-naive and 11 SARS-CoV-2-recovered individuals were used for each experiment, analyzed in nine independent batches. All paired longitudinal samples were analyzed within a single batch. See also Figure S3.
Figure 4
Figure 4
mRNA vaccination provokes a coordinated immune response in SARS-CoV-2-naive and recovered individuals (A) UMAP projections of aggregated antigen-specific data for T cell, memory B cell, and antibody responses over time. Memory B cell and antibody data were taken from a previously published dataset using 29 SARS-CoV-2-naive and 10 SARS-CoV-2-recovered subjects from the same cohort (Goel et al., 2021). Colors represent time points at which PBMCs were collected throughout the study. Parameters were considered as frequency of non-naive T cells or memory B cells, capturing both the magnitude and skewing of responses. (B and C) Summary plots of UMAP1 (B) and UMAP2 (C) coordinates over time. Individual points represent individual participants. Statistics were calculated using unpaired Wilcoxon test. n.s., not significant. ∗p < 0.05, ∗∗p < 0.01, ∗∗∗p < 0.001, ∗∗∗∗p < 0.0001. Boxplots represent median with interquartile range. (D) Correlations of the individual antigen-specific features used to train the UMAP against the UMAP1 and UMAP2 axes. Red indicates positive correlations and blue indicates negative correlations. = FDR < 0.05. #Features that were not used to train the original UMAP. (E) Kernel density plots displaying the variation of selected antigen-specific features across UMAP space. Time points are as defined in Figure 1A. Longitudinal samples from 29 SARS-CoV-2-naive and 10 SARS-CoV-2-recovered individuals were used for each experiment, analyzed in eight independent batches. All paired longitudinal samples were analyzed within a single batch. See also Figure S4.

References

    1. Abu Jabal K., Ben-Amram H., Beiruti K., Batheesh Y., Sussan C., Zarka S., Edelstein M. Impact of age, ethnicity, sex and prior infection status on immunogenicity following a single dose of the BNT162b2 mRNA COVID-19 vaccine: real-world evidence from healthcare workers, Israel, December 2020 to January 2021. Euro Surveil. 2021;26:2100096. - PMC - PubMed
    1. Acosta-Rodriguez E.V., Rivino L., Geginat J., Jarrossay D., Gattorno M., Lanzavecchia A., Sallusto F., Napolitani G. Surface phenotype and antigenic specificity of human interleukin 17-producing T helper memory cells. Nat. Immunol. 2007;8:639–646. - PubMed
    1. Akondy R.S., Fitch M., Edupuganti S., Yang S., Kissick H.T., Li K.W., Youngblood B.A., Abdelsamed H.A., McGuire D.J., Cohen K.W., et al. Origin and differentiation of human memory CD8 T cells after vaccination. Nature. 2017;552:362–367. - PMC - PubMed
    1. Anderson E.J., Rouphael N.G., Widge A.T., Jackson L.A., Roberts P.C., Makhene M., Chappell J.D., Denison M.R., Stevens L.J., Pruijssers A.J., et al. mRNA-1273 Study Group Safety and immunogenicity of SARS-CoV-2 mRNA-1273 vaccine in older adults. N. Engl. J. Med. 2020;383:2427–2438. - PMC - PubMed
    1. Angyal A., Longet S., Moore S., Payne R.P., Harding A., Tipton T., Rongkard P., Ali M., Hering L.M., Meardon N., et al. T-cell and antibody responses to first BNT162b2 vaccine dose in previously SARS-CoV-2-infected and infection-naive UK healthcare workers: a multicentre, prospective, observational cohort study. 2021. https://papers.ssrn.com/sol3/papers.cfm?abstract_id=3820576 - PMC - PubMed

Publication types

MeSH terms