. 2021 Oct 25;31(20):4659-4666.e2.
doi: 10.1016/j.cub.2021.08.016. Epub 2021 Aug 27.

Energy compensation and adiposity in humans

Vincent Careau  1 Lewis G Halsey  2 Herman Pontzer  3 Philip N Ainslie  4 Lene F Andersen  5 Liam J Anderson  6 Lenore Arab  7 Issad Baddou  8 Kweku Bedu-Addo  9 Ellen E Blaak  10 Stephane Blanc  11 Alberto G Bonomi  12 Carlijn V C Bouten  13 Maciej S Buchowski  14 Nancy F Butte  15 Stefan G J A Camps  10 Graeme L Close  4 Jamie A Cooper  16 Sai Krupa Das  17 Richard Cooper  18 Lara R Dugas  19 Simon D Eaton  20 Ulf Ekelund  21 Sonja Entringer  22 Terrence Forrester  23 Barry W Fudge  24 Annelies H Goris  10 Michael Gurven  25 Catherine Hambly  26 Asmaa El Hamdouchi  8 Marije B Hoos  10 Sumei Hu  27 Noorjehan Joonas  28 Annemiek M Joosen  10 Peter Katzmarzyk  29 Kitty P Kempen  10 Misaka Kimura  30 William E Kraus  31 Robert F Kushner  32 Estelle V Lambert  33 William R Leonard  34 Nader Lessan  35 Corby K Martin  29 Anine C Medin  36 Erwin P Meijer  10 James C Morehen  37 James P Morton  4 Marian L Neuhouser  38 Theresa A Nicklas  15 Robert M Ojiambo  39 Kirsi H Pietiläinen  40 Yannis P Pitsiladis  41 Jacob Plange-Rhule  9 Guy Plasqui  42 Ross L Prentice  38 Roberto A Rabinovich  43 Susan B Racette  44 David A Raichlen  45 Eric Ravussin  28 John J Reilly  46 Rebecca M Reynolds  47 Susan B Roberts  17 Albertine J Schuit  48 Anders M Sjödin  49 Eric Stice  50 Samuel S Urlacher  51 Giulio Valenti  10 Ludo M Van Etten  10 Edgar A Van Mil  52 Jonathan C K Wells  53 George Wilson  4 Brian M Wood  54 Jack Yanovski  55 Tsukasa Yoshida  56 Xueying Zhang  57 Alexia J Murphy-Alford  58 Cornelia U Loechl  58 Amy H Luke  59 Jennifer Rood  60 Hiroyuki Sagayama  61 Dale A Schoeller  62 William W Wong  63 Yosuke Yamada  64 John R Speakman  65 IAEA DLW database group
Affiliations

Energy compensation and adiposity in humans

Vincent Careau et al. Curr Biol. .

Abstract

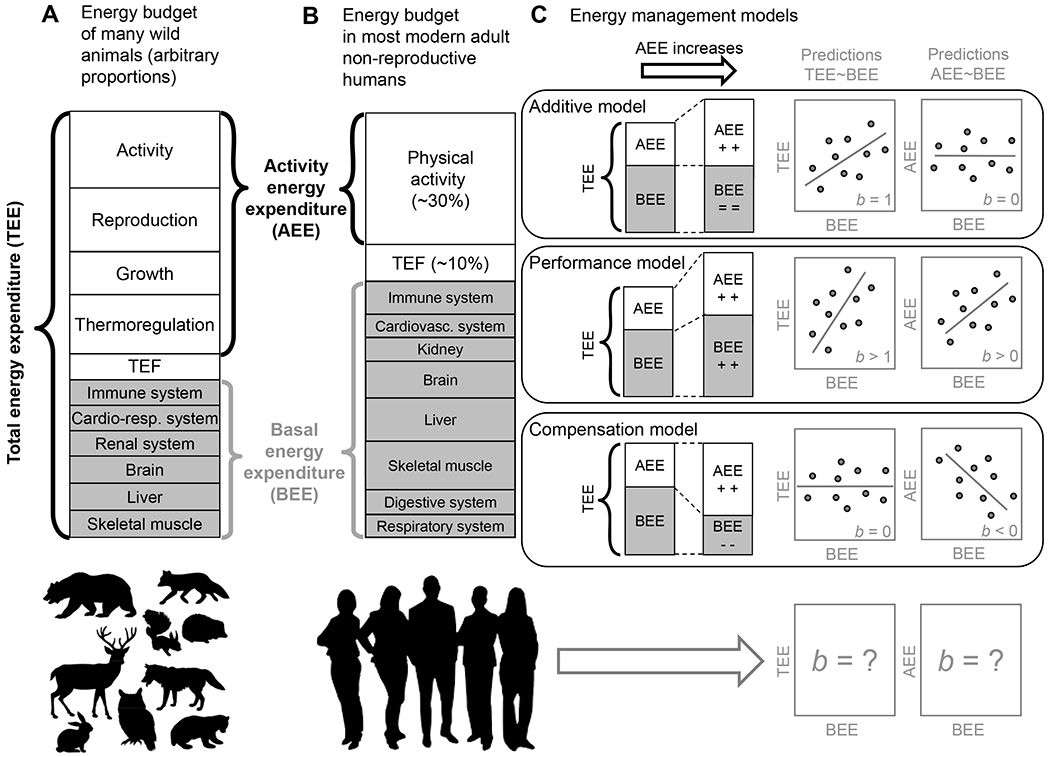
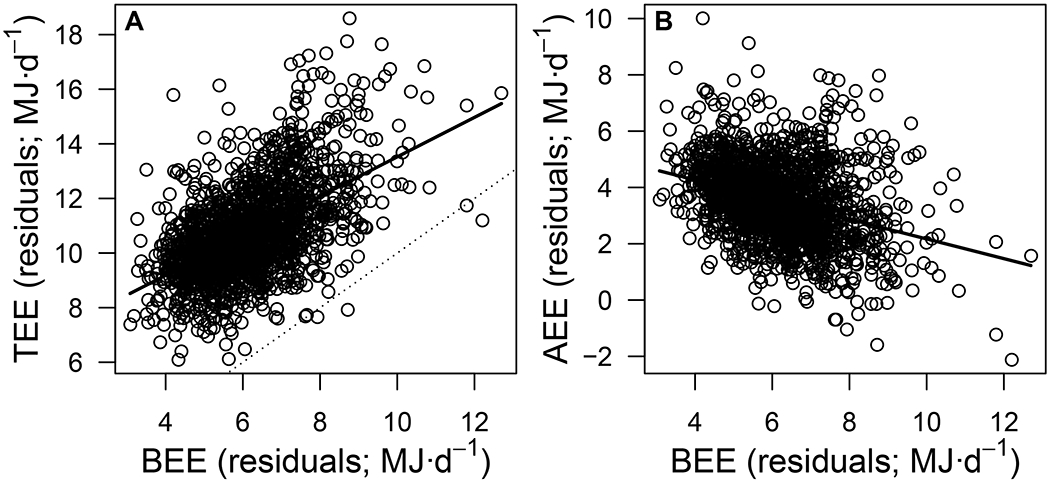
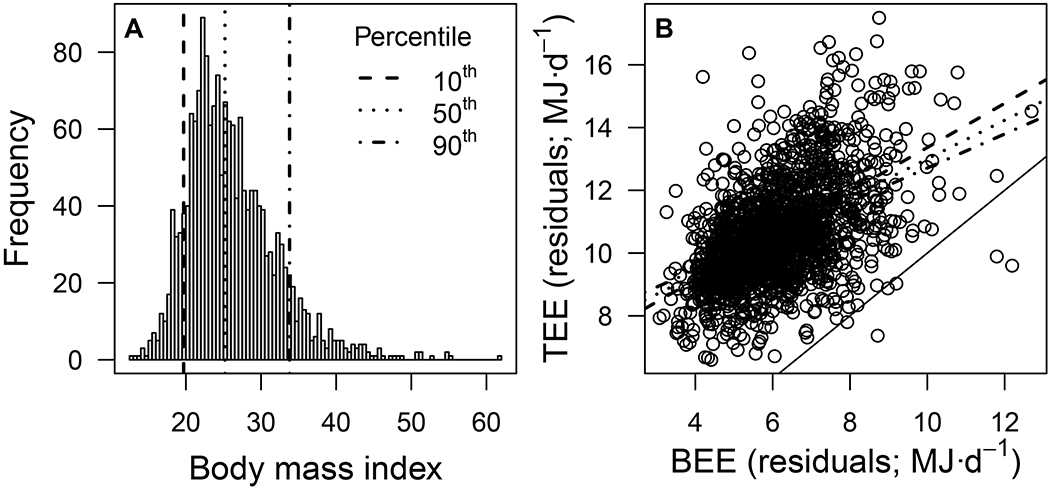
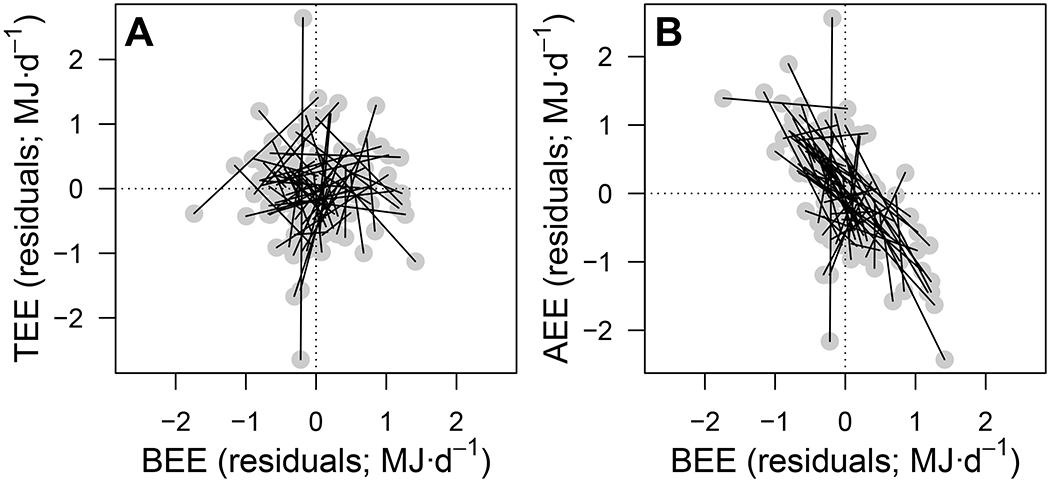
Understanding the impacts of activity on energy balance is crucial. Increasing levels of activity may bring diminishing returns in energy expenditure because of compensatory responses in non-activity energy expenditures.1-3 This suggestion has profound implications for both the evolution of metabolism and human health. It implies that a long-term increase in activity does not directly translate into an increase in total energy expenditure (TEE) because other components of TEE may decrease in response-energy compensation. We used the largest dataset compiled on adult TEE and basal energy expenditure (BEE) (n = 1,754) of people living normal lives to find that energy compensation by a typical human averages 28% due to reduced BEE; this suggests that only 72% of the extra calories we burn from additional activity translates into extra calories burned that day. Moreover, the degree of energy compensation varied considerably between people of different body compositions. This association between compensation and adiposity could be due to among-individual differences in compensation: people who compensate more may be more likely to accumulate body fat. Alternatively, the process might occur within individuals: as we get fatter, our body might compensate more strongly for the calories burned during activity, making losing fat progressively more difficult. Determining the causality of the relationship between energy compensation and adiposity will be key to improving public health strategies regarding obesity.

Keywords: Homo sapiens; activity; basal metabolic rate; daily energy expenditure; energy compensation; energy management models; exercise; trade-offs; weight loss.


Conflict of interest statement

Declaration of interests The authors have no conflicts of interest to declare.

Figures

Figure 1.
Figure 1.. Energy budgets and competing hypotheses.
(A) Representation of the total energy expenditure (TEE) of endothermic animals as the sum of the energy invested in activity, reproduction, growth, thermoregulation, digestion (thermic effect of food; TEF), and basal energy expenditure (BEE; the minimum amount of energy required for the functioning [e.g., breathing] and the maintenance [e.g., tissue turnover] of vital systems). Proportions are somewhat arbitrary but recognize that in vertebrates BEE is typically a minor element of TEE . Any source of energy expenditure above BEE (except TEF) is apportioned as activity energy expenditure (AEE), which includes the costs of thermoregulation, reproduction and growth when present. (B) Representation of the TEE of most non-reproductive adult humans, in which there are no energy costs of growth or reproduction, and the cost of thermoregulation is assumed to be negligible. In this simplified energy budget, the proportions recognize that in adult humans ~60% of energy is spent on BEE (categorized into proportions based loosely on ) and most of the AEE component is indeed represented by activity: locomotion, posture and ‘fidgeting’ . (C) Illustration of the various models that have been proposed to describe how humans and other animals manage their energy budget , and their associated predictions about the slope (b) of the relationship between TEE and BEE and between AEE and BEE. The left stack bar shows a simplified baseline version of TEE as the sum of BEE and AEE. Comparing the left vs. right stacks shows the mean effect of an increase in AEE on BEE and TEE. The regression lines in the panels to the right show the predicted relationships between TEE and BEE and between AEE and BEE; example individual data points have been included to illustrate the predicted relationship in addition to some unexplained variation. The additive model assumes that AEE and BEE are independent, thus uncorrelated. Therefore, variation in BEE should add up to variation in TEE, with a b = 1 due to part-whole correlation. In other words, the additive model predicts that additional calories burned by undertaking extra activity results in an equivalent increase in total energy expenditure. By contrast, the performance model assumes that a greater ‘metabolic machinery’ is needed to support higher AEE due to increased assimilation of energy, and thus a b > 1 for the relationship between TEE and BEE. That is, the performance model predicts that the resultant total calories burned due to activity will be higher than just the calories expended during the activity because of additional energy spent on subsequent physical recovery and maintenance of a more expensive metabolic machinery to support this behaviour. Alternatively, both humans and animals may respond to greater energy being expended on activity over the long term by reducing the energy expended on other processes, a phenomenon captured by the compensation model. The compensation model assumes that energy budgets are somewhat constrained which forces trade-offs between energy invested into AEE and BEE, thus predicting a negative relationship between AEE and BEE and therefore a b < 1 for the relationship between TEE and BEE. It is currently unknown whether energy compensation occurs only under extreme conditions, or at least only during periods of prescribed exercise, where measured or inferred energy compensation has been documented on a number of occasions , or instead whether it is the default model of energy expenditure in humans living typical lives, who naturally adjust their activity and energy intake over time.
Figure 2.
Figure 2.. Energy compensation in humans.
(A) Total energy expenditure (TEE; MJ·d−1) and (B) activity energy expenditure (AEE; MJ·d−1) as a function of basal energy expenditure (BEE; MJ·d−1) in 1,754 subjects included in this study, controlling for sex, age, and body composition. Panel A illustrates how the slope of the TEE-BEE relationship is <1 (compared to the 1:1 dotted line), whereas panel B illustrates the negative relationship between AEE and BEE.
Figure 3.
Figure 3.. Compensation increases with fat mass.
(A) Frequency distribution of body mass index in the 1,754 subjects included in this study, showing where lie the 10th, 50th, and 90th percentiles (long dash, short dash, and dash-dot lines, respectively). (B) Total energy expenditure (TEE; MJ·d−1) as a function of basal energy expenditure (BEE; MJ·d−1), controlling for sex, age, and body composition. This figure illustrates the significant BEE × fat mass interaction (Table S1B), showing how compensation increases from 29.7% in people at the 10th percentile of the BMI distribution (red long dash line), to 45.8% in people at the 90th percentile of the BMI distribution (blue dash-dot line). Relationships are plotted separately for three broad BMI categories, but fat mass is treated as a continuous variable in the analysis (see Table S1B for estimates). The thin solid line indicates a 1:1 relationship.
Figure 4.
Figure 4.. Energy trade-offs within individuals.
Residual (A) total energy expenditure (TEE; MJ·d−1) and (B) activity energy expenditure (AEE; MJ·d−1) as a function of basal energy expenditure (BEE; MJ·d−1) in elderly men and women (N = 68) with two pairs of TEE-BEE measures each. Within-individual slopes are illustrated by the thin black lines connecting the two residual values (grey dots; extracted from the bivariate mixed model, see Table S2) for each individual.

Similar articles

Cited by

References

    1. Pontzer H, Durazo-Arvizu R, Dugas LR, Plange-Rhule J, Bovet P, Forrester TE, Lambert EV, Cooper RS, Schoeller DA, and Luke A (2016). Constrained total energy expenditure and metabolic adaptation to physical activity in adult humans. Curr. Biol 26, 410–417. - PMC - PubMed
    1. Halsey LG (2021). The mystery of energy compensation. In arxiv. - PubMed
    1. Halsey LG, Green JA, Twiss SD, Arnold W, Burthe SJ, Butler PJ, Cooke SJ, Grémillet D, Ruf T, and Hicks O (2019). Flexibility, variability and constraint in energy management patterns across vertebrate taxa revealed by long-term heart rate measurements. Func. Ecol 33, 260–272.
    1. Riou M-È, Jomphe-Tremblay S, Lamothe G, Stacey D, Szczotka A, and Doucet É (2015). Predictors of energy compensation during exercise interventions: a systematic review. Nutrients 7, 3677–3704. - PMC - PubMed
    1. Halsey L (In Press). The mystery of energy compensation. Phys. Biochem. Zool - PubMed

Publication types

Grants and funding