. 2021 Oct 7;81(19):3919-3933.e7.
doi: 10.1016/j.molcel.2021.07.039. Epub 2021 Aug 27.

Conformational equilibria in allosteric control of Hsp70 chaperones

Affiliations

Conformational equilibria in allosteric control of Hsp70 chaperones

Wei Wang et al. Mol Cell. .

Abstract

Heat-shock proteins of 70 kDa (Hsp70s) are vital for all life and are notably important in protein folding. Hsp70s use ATP binding and hydrolysis at a nucleotide-binding domain (NBD) to control the binding and release of client polypeptides at a substrate-binding domain (SBD); however, the mechanistic basis for this allostery has been elusive. Here, we first characterize biochemical properties of selected domain-interface mutants in bacterial Hsp70 DnaK. We then develop a theoretical model for allosteric equilibria among Hsp70 conformational states to explain the observations: a restraining state, Hsp70R-ATP, restricts ATP hydrolysis and binds peptides poorly, whereas a stimulating state, Hsp70S-ATP, hydrolyzes ATP rapidly and has high intrinsic substrate affinity but rapid binding kinetics. We support this model for allosteric regulation with DnaK structures obtained in the postulated stimulating state S with biochemical tests of the S-state interface and with improved peptide-binding-site definition in an R-state structure.

Keywords: DnaK; Hsp70; allosteric regulation; crystal structure; molecular chaperone; protein folding.


Conflict of interest statement

Declaration of interests The authors declare no competing interests.

Figures

Figure 1.
Figure 1.. Construction and biochemical characterization of mutant variant DnaK proteins.
(A) Schematics of Hsp70 domain structure. Boundaries and sites of mutation in E. coli DnaK are marked (upper) and the WT∷NR fusion protein is shown (lower). Color assignments: NBD blue, NBD-SBD Linker purple, SBDβ green, SBDα red and NR peptide (NRLLLTG) orange. (B) Ribbon diagram of DnaK-ATPR showing mutated residues. Backbone coloring is as in 1A; side chains of mutated residues and W102 are in orange and yellow, respectively. (C) Diagrammatic illustration of the WT∷NR fusion protein. Coloring is as in 1A. (D) Allosteric coupling. The ADP-to-ATP shift in wavelength of maximal fluorescence for each variant is compared to that for WT DnaK. (E) Effect of substrate peptide binding on ATP hydrolysis. ATP hydrolysis as measured by single-turnover kinetics is compared to WT for each variant minus peptide substrates and plus 400 μM NR peptide. (F) Peptide binding in the presence of ADP (100 μM). Fluorescence anisotropy measured from fluorescein-labeled NR peptide (10 nM) as a function of DnaK concentration for each variant in comparison to WT DnaK. The key associates symbols with proteins. (G) Peptide binding in the presence of ATP (2 mM). Binding was assayed as in 1F, but in ATP instead of ADP with symbols as in 1F.
Figure 2.
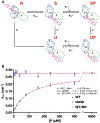
Figure 2.. Theory for allosteric control of ATP hydrolysis by Hsp70 proteins.
(A) Theoretical model. The restraining state of Hsp70R-ATP (R) is postulated here to have no affinity for substrate peptide and to hydrolyze ATP at the basal rate k′ to Hsp70U-ADP (U). Hsp70R-ATP (R) is proposed to be in equilibrium (KeqS) with stimulating state Hsp70S-ATP (S), which in the presence of substrate peptide (PS) is in equilibrium (KD0S) with the complex Hsp70S-ATP-peptide (SP). Both S and SP hydrolyze ATP at an elevated rate k′ to U and UP, respectively. Structural cartoons are color coded in accord with 1A. Orange dots () connote peptide substrates and («) symbols connote α-lid mobility. (B) Fittings of the allosteric theory to hydrolysis data. ATP hydrolysis rates measured by single-turnover kinetics at 20°C (Table S1), are shown as a function of NR peptide concentration [P], for WT DnaK and for the I483D and WT∷NR mutant variants. The fitting to the WT data by theory Eq. (3) is drawn in purple, and the fitted asymptotic value k′(WT) is shown as a horizontal line in comparison to the observed measurements for the fully disengaged I483D and WT∷NR proteins where KeqS = 0 and kcat = k′. The effective local concentration on NR peptide in the WT∷NR fusion protein is estimated to be 6.8 mM based on the length of flexible linker (Zhou, 2001).
Figure 3.
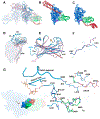
Figure 3.. Conformational distinctions in the S and R states.
(A) Comparison of R- and S-state structures. R (ΔL3,4 DnaK610) and S (DnaK540∷NR) dimers are drawn as ribbons with the NBDs of right-side protomers superimposed. The right-side S is colored by domain as in 1A; otherwise, R is pink and S is light blue with left-side partners subdued. (B) R-state structure of E47C/F529C DnaK600. The polypeptide trace of chain D is shown in worm representation with coloring as in 1A. (C) S-state structure of DnaK609∷NR (chain A). NBD is oriented as superimposed onto that of R in 3B. Presentation is as in 3B with the NR peptide orange. (D) Comparison of SBD domains with NBD domains (surface rendering) superimposed. Ribbons are shown from 387 onward. Coloring: S (light blue), S axis blue), R (pink), R axis (red), NR (orange). (E) Comparison of SBDβ subdomains as superimposed on inner loops. Coloring as in 3D. (F) Comparison of NBD-SBD linker segments. Coloring as in 3D. (G) S-state interface of SBDβ (green) and SBDα (red) with NBD (blue). Contacts of SBD loop L6,7 (479–485) with NBD loop β10-αF (143–151) and of the SBD β8-αA linker (505–510) with NBD β14 (219–222) of the R-S switch segment and the end of αK (326–328), as well as an ATP interaction, are shown in atomic detail. Selected NBD segments are shown as backbone worms.
Figure 4.
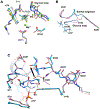
Figure 4.. Structural basis for regulation of ATP hydrolysis.
(A) Relative dispositions of groups associated with the Pγ phosphate group of ATP as bound in conformational states S (blue), R(pink) & SP (olive). (B) Comparison of R-S switch segments (220–231) and associated glycine loops (196–199) and ATP in S (blue) and R (pink) states. (C) Atomic details of R-S switch segment associations with the glycine loop (196–199) and NBD αC (70, 71) and of tyrosine Y145 in S (blue) and R (pink) interactions.
Figure 5.
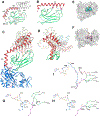
Figure 5.. Structural basis for effects of ATP on peptide-binding kinetics.
(A) SBDα disposition in DnaKS-ATP (green and red) compared with that in the isolated domain, SBDU (grey). Superposition is based on SBDβ. (B) Collisions (Molprobity clash symbols in magenta) that would occur between residues of helix αB and outer loops L3,4 and L5,6 if αB were extended as in SBDU from residue 536 of SBDS in 5A. (C & D) Orthogonal views of DnaK609∷NR. The experimental α-lid domain of subunit A from the cubic-lattice tetramer (Fig. S8) is in red, and four alternatively disposed α-lid models that fit into lattice voids are subdued. (A) SBD orientation similar to 5A but with αA vertical. (B) View rotated 90° to the left of 5A. (E) SBDβ surface in the S-state complex of DnaK540∷NR. The NR peptide is an orange worm with stick bonds for central leucine residue L4. The SBDβ surface is grey except for L4 pocket-lining residues V436, I438, F426 and I472 (cyan). (F) SBDβ surface in the R-state structure of DnaK600. The rendering is as for 5E, except for the L4 pocket-lining residues (pink). R is superimposed on S based on inner loop segments 319–412 and 443–452, and peptide NR is included from S for reference. (G-I) Allosteric interaction pathways between ATP and client peptide sites. ATP is drawn as stick bonds and relevant protein segments are drawn as Cα backbones in 1A domain coloring. Each panel has the same orientation and scaling. (G) Pathway from ATP to peptide-contacting loops L1,2 and L3,4 in R-state DnaK. (H) Disrupted ATP-peptide pathway in S-state DnaK. (I) Pathway from ATP to α-lid displacements in S-state DnaK.
Figure 6.
Figure 6.. Characterization of mutant variants at the S-state interface.
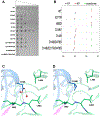
(A) Cell viability tests of chaperone activity for mutations at E217, D148 and D479. Expression plasmids mutated as indicated were introduced in appropriate null backgrounds and tested in serial dilutions for overnight growth on agar plates at 40° C for heat stress. (B) Tryptophan fluorescence assays of DnaK conformation for indicated mutant proteins, testing each in ADP and in ATP. Wavelengths of peak fluorescence are indicated by vertical bars. (C) R-state structure in the vicinity of D148, showing associated water molecules and H-bonding from the carboxylate group to backbone NH 484. Domain coloring has NBD (blue), SBDβ (green), and NBD-SBD linker (purple). (D) R-state structure modeled for the D148I mutant, drawn as for 6C but replacing waters and showing vdW contacts of the mutant isoleucine with hydrophobic side chains.
Figure 7.
Figure 7.. Hsp70 chaperone cycle.
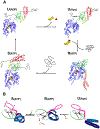
(A) The cycle in DnaK atomic structures. Proceeding clockwise from upper left, DnaKU(ADP, peptide) is first in an uncoupled state with ADP/Pi bound to NBD and a client polypeptide bound to SBD; DnaKU (apo, peptide) obtains after release of ADP (upper right); rebinding of ATP to NDB generates DnaKR (ATP, no client) with consequent release of the polypeptide (lower right); the equilibrium between R and S then permits the rebinding of a client polypeptide to SBD in the S state, DnaKS (ATP, rebound client); and ATP hydrolysis breaks the NBD-SBD coupling and returns to the starting point (lower left). Each step of the cycle is represented here by an experiment-based structure: DnaKU (ADP) is adapted from the NMR-based model for the disposition of SBD relative to NBD (PDBid 2kho), but has NBD replaced by our actual structure of the ADP complex (PDBid 7n46); DnaKU (apo) has NBD replaced by the empty domain from the complex with GrpE (PDBid 1dkg); and DnaKR and DnaKU are from this work. Coloring is as in 1A except that SBD αA is yellow to distinguish it in the R state. (B) Schematic drawings of peptide sites apo in Hsp70U (right), Hsp70R (center), and Hsp70S (left). Segments from the NBD-SB linker through β8 are drawn faithfully within schematic SBDβ outlines viewed from the side. Domain outlines are colored as in 1A, with NBD lobe I a lighter blue and lobe II darker. As in 2A, orange dots () connote bound peptides and («) symbols connote α-lid mobility. Orientations are roughly from the right of corresponding panels in 7A panels. The S-state distance from ATP Pγ to Cα of the NR central leucine is 46 Å.

Similar articles

Cited by

References

    1. Adams PD, Afonine PV, Bunkóczi G, Chen VB, Davis IW, Echols N, Headd JJ, Hung L-W, Kapral GJ, Grosse-Kunstleve RW, McCoy AJ, Moriarty NW, Oeffner R, Read RJ, Richardson DC, Richardson JS, Terwilliger TC, and Zwart PH (2010). PHENIX: a comprehensive Python-based system for macromolecular structure solution. Acta Crystallogr. D 66, 213–221. - PMC - PubMed
    1. Anfinsen CB (1973). Principles that govern the folding of protein chains. Science 181, 223–230. - PubMed
    1. Bertelsen EB, Chang L, Gestwicki JE, and Zuiderweg ER (2009). Solution conformation of wild-type E. coli Hsp70 (DnaK) chaperone complexed with ADP and substrate. Proc. Natl. Acad. Sci. USA 106, 8471–8476. - PMC - PubMed
    1. Buchberger A, Theyssen H, Schroder H, McCarty JS, Virgallita G, Milkereit P, Reinstein J, and Bukau B (1995). Nucleotide-induced conformational changes in the ATPase and substrate binding domains of the DnaK chaperone provide evidence for interdomain communication. J. Biol. Chem 270, 16903–16910. - PubMed
    1. Burkholder WF, Zhao X, Zhu X, Hendrickson WA, Gragerov A, and Gottesman ME (1996). Mutations in the C-terminal fragment of DnaK affecting peptide binding. Proc. Natl. Acad. Sci. USA 93, 10632–10637. - PMC - PubMed

Publication types

MeSH terms

Substances

LinkOut - more resources