. 2021 Oct 21;81(20):4258-4270.e4.
doi: 10.1016/j.molcel.2021.08.003. Epub 2021 Aug 27.

Repeated strand invasion and extensive branch migration are hallmarks of meiotic recombination

Affiliations

Repeated strand invasion and extensive branch migration are hallmarks of meiotic recombination

Jasvinder S Ahuja et al. Mol Cell. .

Abstract

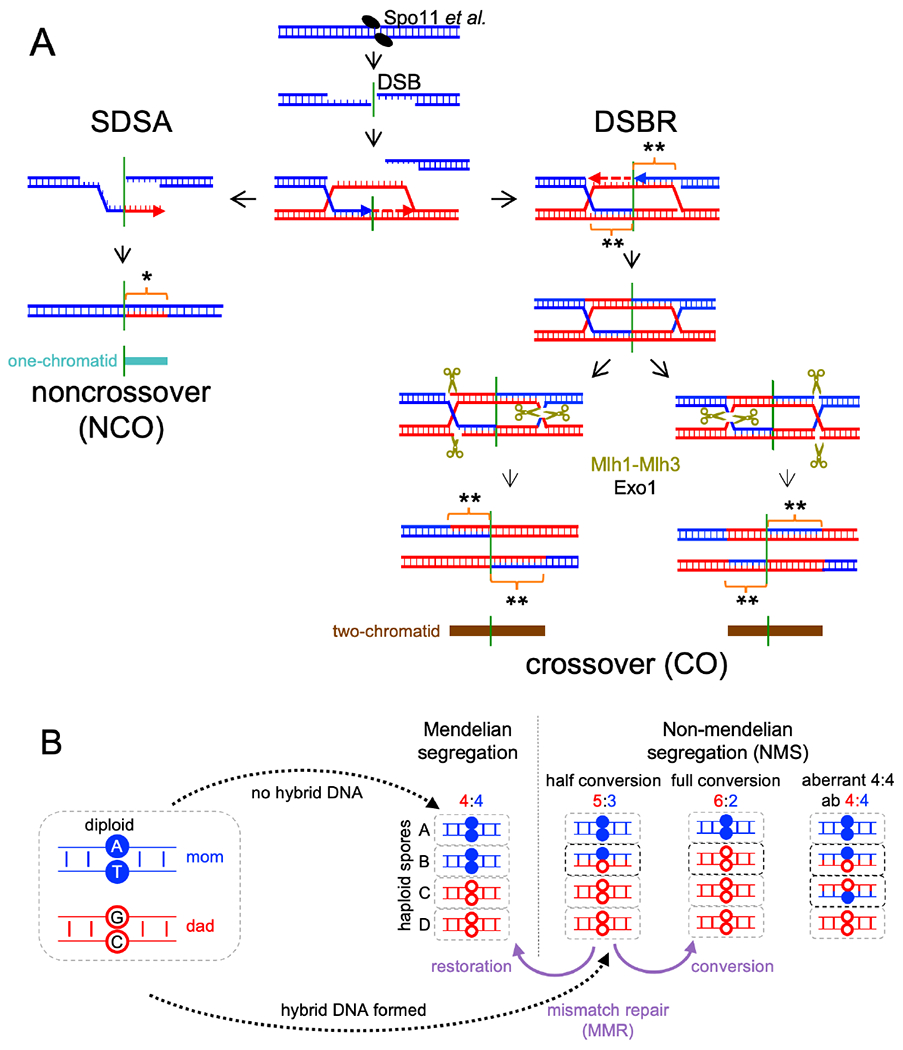
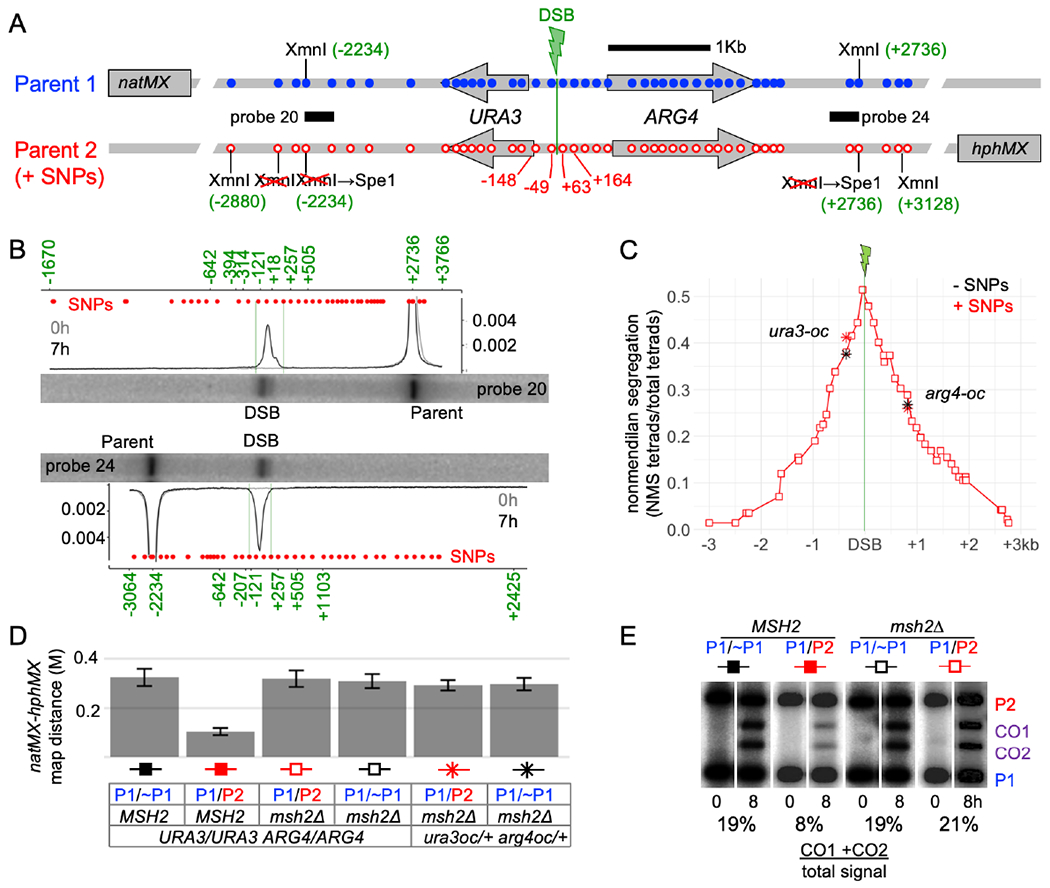
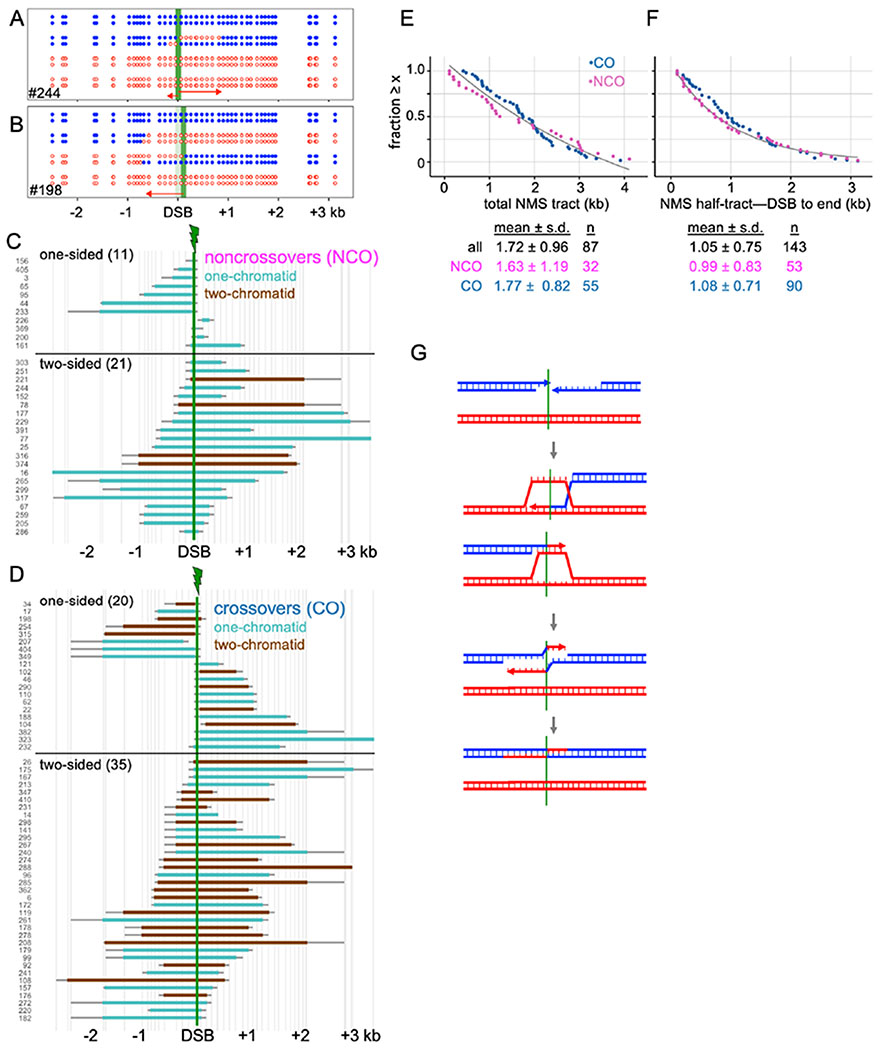
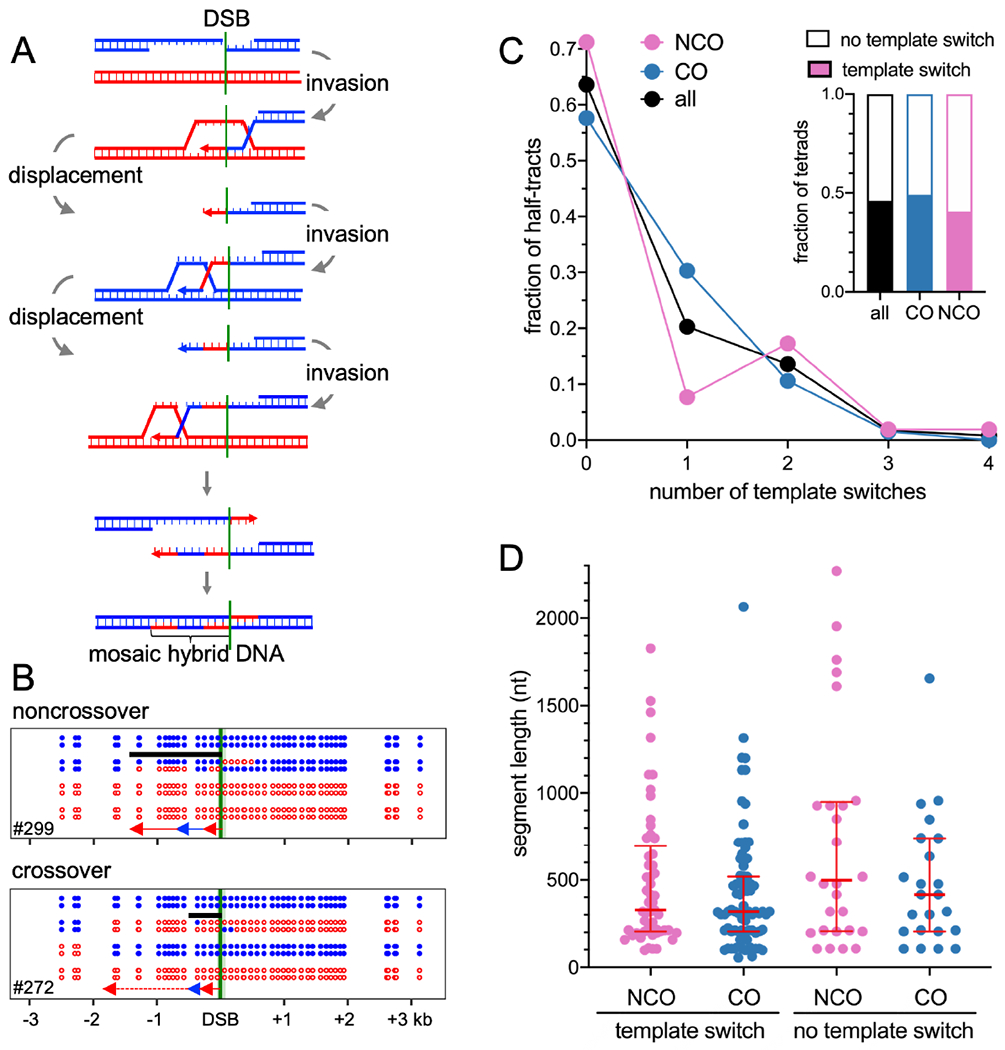
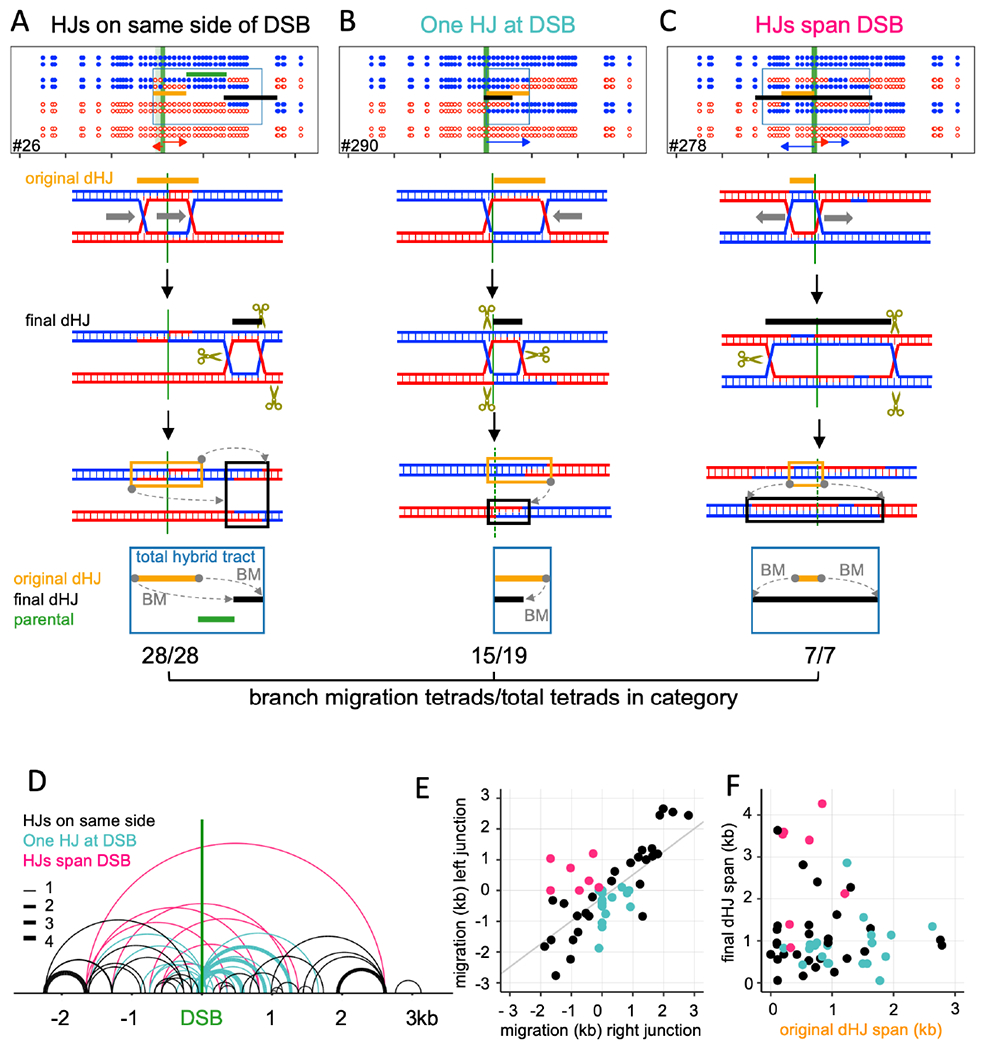
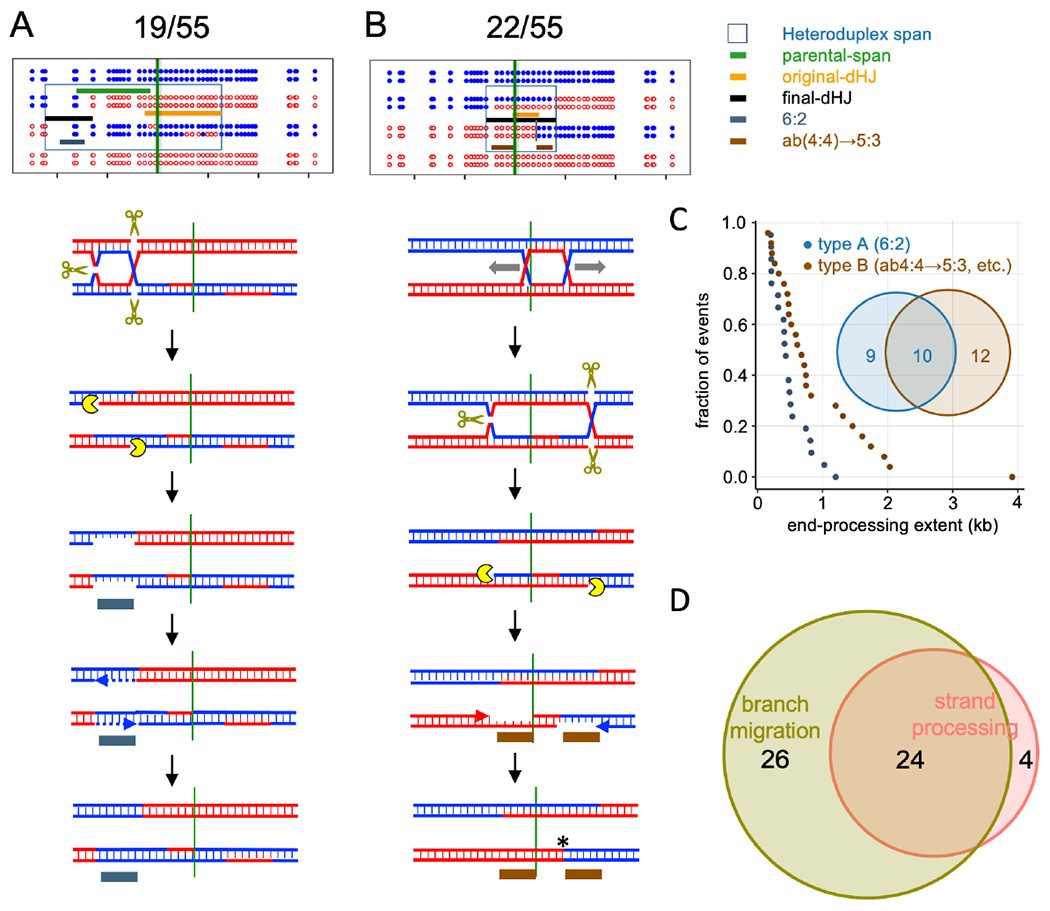
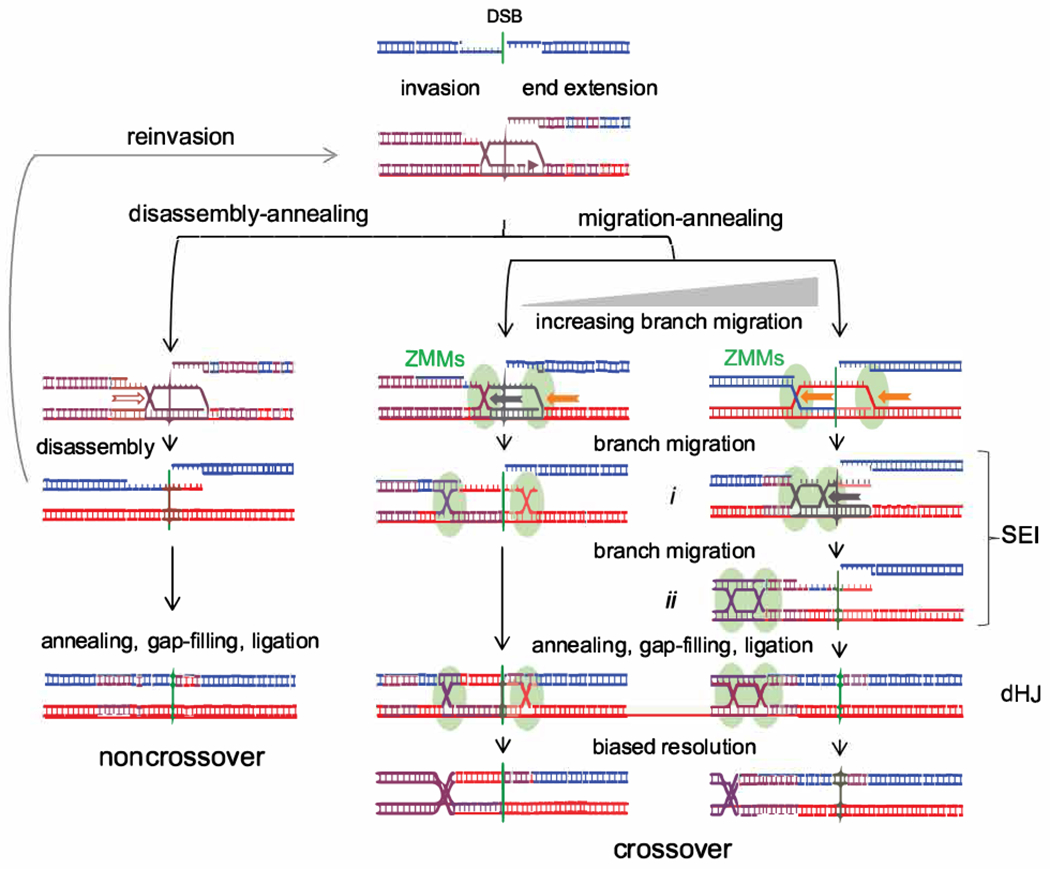
Currently favored models for meiotic recombination posit that both noncrossover and crossover recombination are initiated by DNA double-strand breaks but form by different mechanisms: noncrossovers by synthesis-dependent strand annealing and crossovers by formation and resolution of double Holliday junctions centered around the break. This dual mechanism hypothesis predicts different hybrid DNA patterns in noncrossover and crossover recombinants. We show that these predictions are not upheld, by mapping with unprecedented resolution parental strand contributions to recombinants at a model locus. Instead, break repair in both noncrossovers and crossovers involves synthesis-dependent strand annealing, often with multiple rounds of strand invasion. Crossover-specific double Holliday junction formation occurs via processes involving branch migration as an integral feature, one that can be separated from repair of the break itself. These findings reveal meiotic recombination to be a highly dynamic process and prompt a new view of the relationship between crossover and noncrossover recombination.

Keywords: Saccharomyces; branch migration; crossover; double Holliday junction; end extension; gene conversion; homologous recombination; meiosis; noncrossover; strand invasion.


Conflict of interest statement

Declaration of interests The authors declare no competing interests.

Figures

Figure 1.
Figure 1.. Current “dual-mechanism” model and marker segregation in tetrads.
(A) Resection creates a 3’ ssDNA end that invades a homologous duplex and is extended by synthesis (arrow). SDSA – the invasion/extension strand is displaced and forms a NCO. DSBR – the second DSB end is captured and extended to form a double Holliday junction (dHJ) that resolves to form COs. Hybrid DNA in NCOs contains one “old” and one newly synthesized strand (*), and is continuous, on one chromatid, and to one side of the DSB (turquoise). COs contain hybrid DNA in two tracts (brown) that each contain two “old” parental strands (**), with one tract on each chromatid in opposite directions from the DSB. See also Figure S1. (B) If no hybrid DNA forms, markers segregate in a 4:4 ratio. Asymmetric hybrid DNA results in a 5:3 ratio (half conversion). Correction by MMR produces either 6:2 (full conversion) or 4:4 (restoration). Symmetric hybrid DNA produces an aberrant 4:4 ratio.
Figure 2.
Figure 2.. Characteristics of the interval studied.
(A) The URA3-ARG4 recombination interval, showing polymorphic markers (blue—wild type; red–polymorphisms). Marker locations are relative to the DSB centroid (File S1.2). (B) DSBs are tightly focused. Southern blots of XmnI+SpeI digests of meiotic DNA from a resection-deficient rad50S strain (probes in A). Plots are signal/total lane signal. Red dots—marker locations; green numbers—size standards (Figure S2; high resolution gels in Figure S2C, D). Full gel images available at doi:10.17632/j2jpj3p29f.1 (C) Nonmendelian segregation (NMS). Red squares—NMS determined by sequencing. Black stars—NMS for ura3-oc (−364) and arg4-oc (+819) in strains lacking polymorphisms from −2234 to +2736. Red stars—NMS for the same mutants in strains heterozygous for the full polymorphism set. (D) Heterozygosity reduces COs in the natMX:hphMX interval in wild type but not in msh2Δ. Map distances (Morgans) from tetrad analyses; P1 and P2 are as in panel A; ~P1 lacks sequence polymorphisms from −2234 to +2736 (Figure S2A). Error bars—standard error. (E) Heterozygosity reduces COs in MSH2 but not in msh2Δ. XmnI digests of DNA from cells before (0h) and after meiosis (8h), probed with ARG4 sequences. Superfluous lanes have been removed; full gel images available at doi:10.17632/j2jpj3p29f.1 See also Figure S2, Files S1, S3, S4.
Figure 3.
Figure 3.. Similar patterns of end invasion and extension in NCOs and COs.
(A) NCO tetrad with two-sided NMS. (B) CO tetrad with one-sided NMS. (C) NMS tracts in NCOs. Turquoise—heteroduplex on one chromatid; brown—heteroduplex on two chromatids (see Figure 1A). Vertical axis-tetrad identifiers; vertical lines—marker positions. Thick colored bars and thin gray bars indicate minimum and maximum NMS tracts, respectively. (D) NMS tracts in COs; color code as in C. (E) Rank order plot of NMS tract lengths for crossovers (blue) and noncrossovers (purple), calculated using the average between minimum and maximum NMS tracts. Black line—exponential decay curve fit to all events. (F) NMS half-tract lengths, distance from initiating DSB (midpoint between closest flanking markers) to NMS tract end (midpoint between the last converted and the first unconverted marker); colors as in E. (G) Double SDSA. Both DSB ends invade a homolog, extend, are displaced, and anneal to form a two-sided NCO. Simultaneous invasion of two homologs is shown here, but invasion could occur sequentially and could involve a single chromatid. See also Figure S3, Figure S4, File S1.
Figure 4.
Figure 4.. Template switching is common in both COs and NCOs.
(A) Multiple rounds of invasion, extension, and displacement can form mosaic hybrid DNA. (B) Examples of mosaic heteroduplex among NCOs and COs. Black bars–minimum extent of mosaic heteroduplex. The NCO first invaded the homolog, while the CO first invaded the sister chromatid. (C) Frequent template switching in COs and NCOs. Inset—fraction of tetrads with template switching. Tetrads where interpretation was uncertain are counted as “no template switch”. Main graph—number of template switches per NMS half-tract. (D) Length of segments in NMS half-tracts with or without template switching. Red lines-median and quartiles. None of the distributions are significantly different from the others (p>0.05, Mann-Whitney test). See also Figure S4, File S1.
Figure 5 –
Figure 5 –. Branch migration is frequent among crossovers.
Top—COs classified with regards to final HJ locations (crossover points). Middle – An example for each category. Bottom – proposed branch migration mechanism producing the final marker pattern. Tan– inferred original HJs; black –final HJs; green –parental sequences between original and final dHJs; blue boxes—total hybrid DNA. Grey arrows (BM) – direction and extent of branch migration. The fraction of each category displaying branch migration is given below each category. (A) Both final HJs are on the same side of the DSB interval. All display branch migration. (B) One HJ is in the DSB interval, and the other to one side. 15/19 display branch migration. (C) HJs are on opposite sides of the DSB interval. All display branch migration. In this example, both junctions have moved outward. (D) Final dHJ locations. Arcs connect the two HJs. Colors correspond to categories in A-C; line thickness indicates the number of events. (E) Distance and direction of migration by the two HJs. Negative and positive values denote left-and rightward migration; colors as in D. (F) original and final distance between HJs (dHJ span); colors as in D. See also Figure S5, File S1.
Figure 6 –
Figure 6 –. Crossovers display resolution-associated strand processing.
(A) CO where end-processing produces 6:2 segregation. dHJ resolution produces nicks that are converted to ssDNA gaps; repair synthesis results in full conversion (Stahl and Foss, 2010). (B) CO where end-processing converts ab(4:4) to 5:3 segregation, resulting in three apparent CO points. Colored indicators as in Figure 5, with the following additions: grey—6:2 tract produced by end processing; brown—5:3 tract produced by end processing. The fraction of COs in each category is listed. (C) Rank order plots of strand processing tract lengths in types A and B. Only tracts of 2 or more markers were tabulated; curves including single-marker events are in Figure S6B. Median tract lengths: type A—412 nt; type B—679 nt. Inset Venn diagram--tetrads with type A, type B, or both types of strand processing. (D) Number of CO tetrads displaying branch migration, end processing, or both. One tetrad was too complicated to be scored and is not included here. See also Figure S6, File S1.
Figure 7 –
Figure 7 –. Disassembly/migration-annealing model for meiotic recombination.
Left–helicase-mediated branch migration (hollow arrow) disassembles a D-loop, followed either by reinvasion or by end annealing to form a NCO. Center, right–CO formation. D-loop branches are captured by ZMM proteins and undergo helicase-mediated branch migration (solid arrows). Branch migration creates a three-arm single-end intermediate (SEI; Hunter and Kleckner, 2001) with a topologically closed bubble (i) or a dHJ (ii). Migration is drawn as unidirectional but may well be reversible. Annealing with the other DSB end and further processing produces a four-armed dHJ that is resolved as a CO. End reinvasion before annealing is also possible but is not drawn here. Center–limited migration can produce a DSBR-like intermediate. Migration after annealing is also possible (Figure S7A), as are different hybrid DNA configurations relative to the CO and DSB (Figure S7B). This model incorporates features of previous models (Allers and Lichten, 2001a; b; Lao et al., 2008).

References

    1. Ahuja JS, and Börner GV (2011). Analysis of meiotic recombination intermediates by two-dimensional gel electrophoresis. Methods Mol. Biol 745, 99–116. 10.1007/978-1-61779-129-1_7. - DOI - PubMed
    1. Ahuja JS, Sandhu R, Mainpal R, Lawson C, Henley H, Hunt PA, Yanowitz JL, and Börner GV (2017). Control of meiotic pairing and recombination by chromosomally tethered 26S proteasome. Science 355, 408–411. 10.1126/science.aaf4778. - DOI - PMC - PubMed
    1. Allers T, and Lichten M (2001a). Differential timing and control of noncrossover and crossover recombination during meiosis. Cell 106, 47–57. 10.1016/s0092-8674(01)00416-0. - DOI - PubMed
    1. Allers T, and Lichten M (2001b). Intermediates of yeast meiotic recombination contain heteroduplex DNA. Mol. Cell 8, 225–231. 10.1016/s1097-2765(01)00280-5. - DOI - PubMed
    1. Argueso JL, Wanat J, Gemici Z, and Alani E (2004). Competing crossover pathways act during meiosis in Saccharomyces cerevisiae. Genetics 168, 1805–1816. 10.1534/genetics.104.032912. - DOI - PMC - PubMed

Publication types

MeSH terms

LinkOut - more resources