

Different epidemiological profiles in patients with Zika and dengue infection in Tapachula, Chiapas in Mexico (2016-2018): an observational, prospective cohort study
- PMID: 34454432
- PMCID: PMC8397877
- DOI: 10.1186/s12879-021-06520-x
Different epidemiological profiles in patients with Zika and dengue infection in Tapachula, Chiapas in Mexico (2016-2018): an observational, prospective cohort study
Abstract
Background: The introduction of Zika and chikungunya to dengue hyperendemic regions increased interest in better understanding characteristics of these infections. We conducted a cohort study in Mexico to evaluate the natural history of Zika infection. We describe here the frequency of Zika, chikungunya and dengue virus infections immediately after Zika introduction in Mexico, and baseline characteristics of participants for each type of infection.
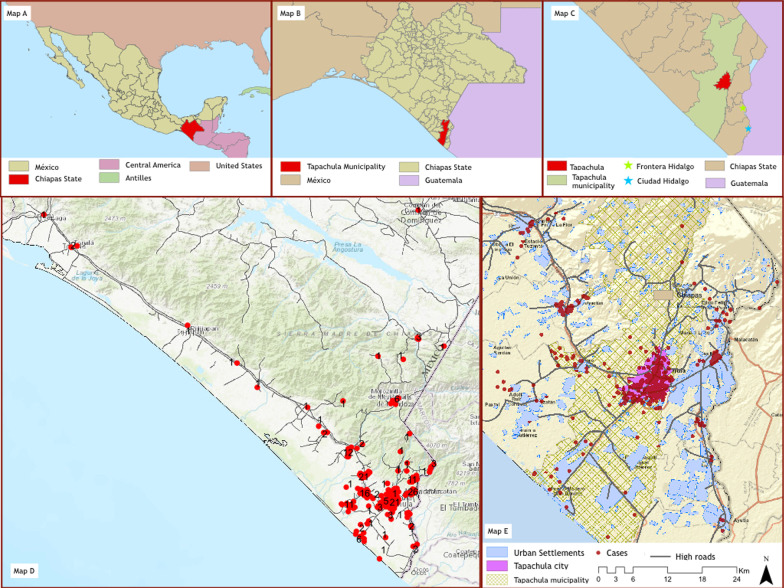
Methods: Prospective, observational cohort evaluating the natural history of Zika virus infection in the Mexico-Guatemala border area. Patients with fever, rash or both, meeting the modified criteria of PAHO for probable Zika cases were enrolled (June 2016-July 2018) and followed-up for 6 months. We collected data on sociodemographic, environmental exposure, clinical and laboratory characteristics. Diagnosis was established based on viral RNA identification in serum and urine samples using RT-PCR for Zika, chikungunya, and dengue. We describe the baseline sociodemographic and environmental exposure characteristics of participants according to diagnosis, and the frequency of these infections over a two-year period immediately after Zika introduction in Mexico.
Results: We enrolled 427 participants. Most patients (n = 307, 65.7%) had an acute illness episode with no identified pathogen (UIE), 37 (8%) Zika, 82 (17.6%) dengue, and 1 (0.2%) chikungunya. In 2016 Zika predominated, declined in 2017 and disappeared in 2018; while dengue increased after 2017. Patients with dengue were more likely to be men, younger, and with lower education than those with Zika and UIE. They also reported closer contact with water sources, and with other people diagnosed with dengue. Participants with Zika reported sexual exposure more frequently than people with dengue and UIE. Zika was more likely to be identified in urine while dengue was more likely found in blood in the first seven days of symptoms; but PCR results for both were similar at day 7-14 after symptom onset.
Conclusions: During the first 2 years of Zika introduction to this dengue hyper-endemic region, frequency of Zika peaked and fell over a two-year period; while dengue progressively increased with a predominance in 2018. Different epidemiologic patterns between Zika, dengue and UIE were observed. Trial registration Clinical.Trials.gov (NCT02831699).
Keywords: Chikungunya; Dengue; Emerging diseases; Mexico; Outbreak; Zika.
© 2021. The Author(s).
Conflict of interest statement
Pablo-Belaunzarán Zamudio is an Associate Editor of BMC Infectious Diseases. The other authors declare that they have no competing interests.
Figures


References
-
- Galindo-Fraga A, Ochoa-Hein E, Sifuentes-Osornio J, Ruiz-Palacios GM. Zika Virus: another epidemic on our doorstep. Rev Invest Clin. 2015;67(6):329–332. - PubMed
-
- Santiago GA, Muñoz-Jordan JL. A49 phylogenetic evaluation of the Zika virus emergence in the Americas: 2015–2016. Virus Evol. 2018;4(1):10–48.
Publication types
MeSH terms
Associated data
Grants and funding
LinkOut - more resources
Full Text Sources
Medical
