. 2021 Aug 28;21(1):238.
doi: 10.1186/s12866-021-02282-3.

Associations between the gut microbiome and metabolome in early life

Affiliations

Associations between the gut microbiome and metabolome in early life

Quang P Nguyen et al. BMC Microbiol. .

Abstract

Background: The infant intestinal microbiome plays an important role in metabolism and immune development with impacts on lifelong health. The linkage between the taxonomic composition of the microbiome and its metabolic phenotype is undefined and complicated by redundancies in the taxon-function relationship within microbial communities. To inform a more mechanistic understanding of the relationship between the microbiome and health, we performed an integrative statistical and machine learning-based analysis of microbe taxonomic structure and metabolic function in order to characterize the taxa-function relationship in early life.

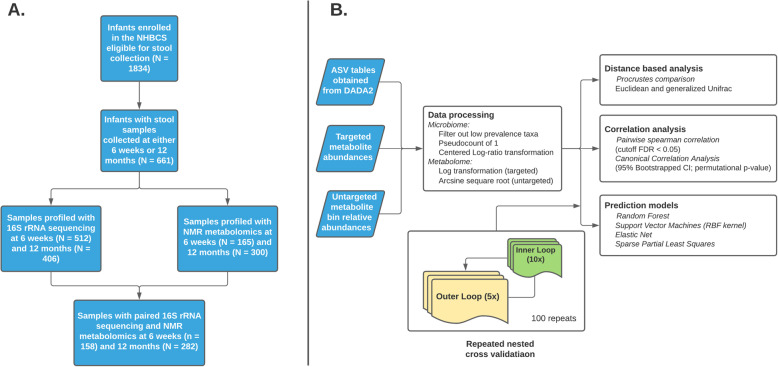
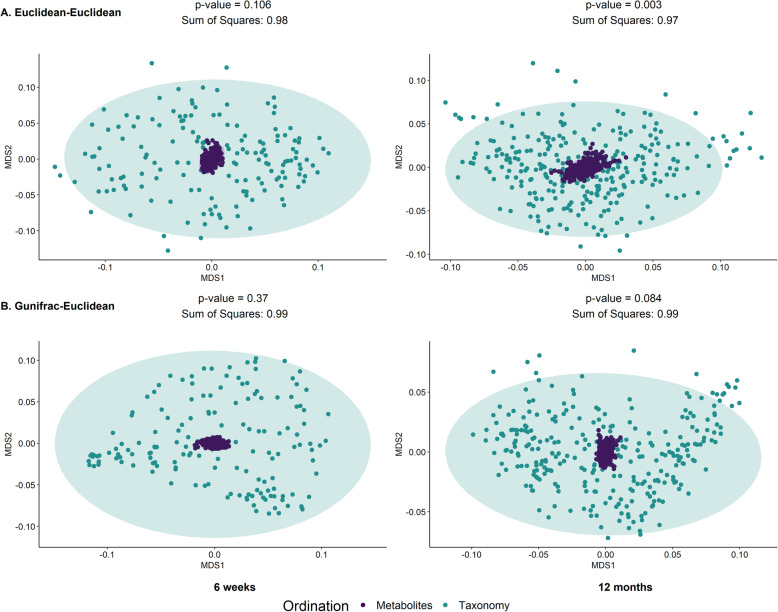
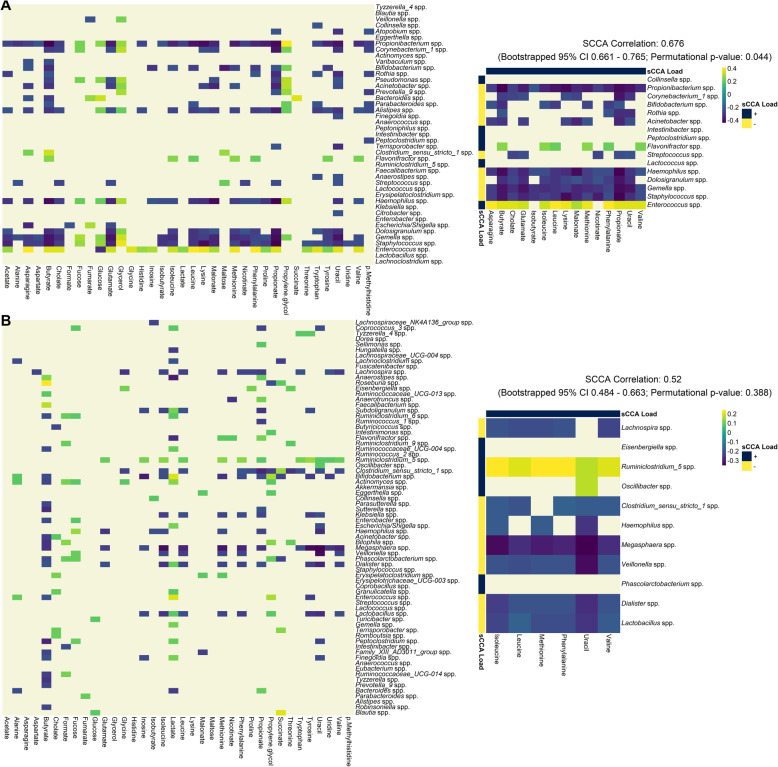
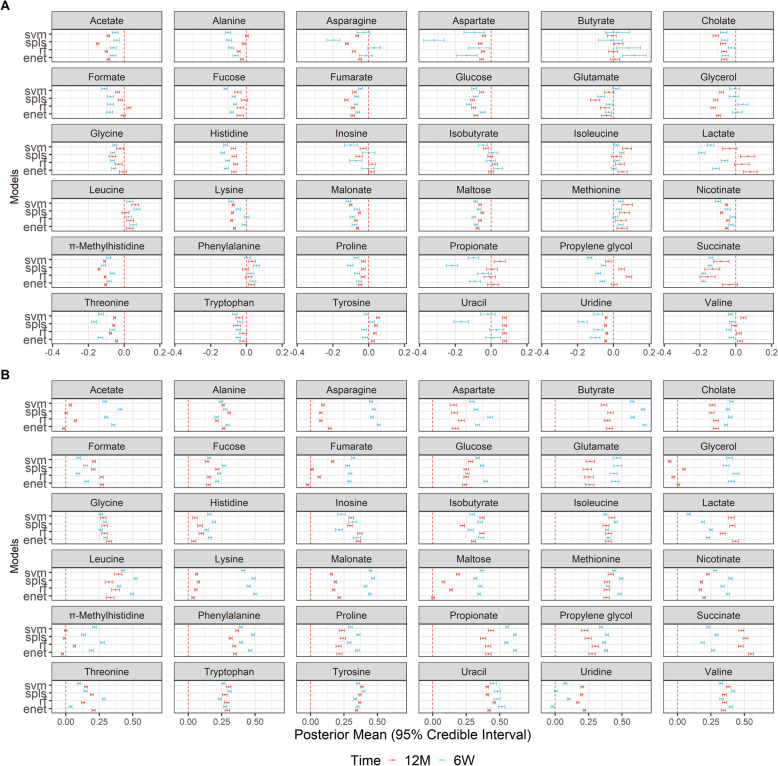
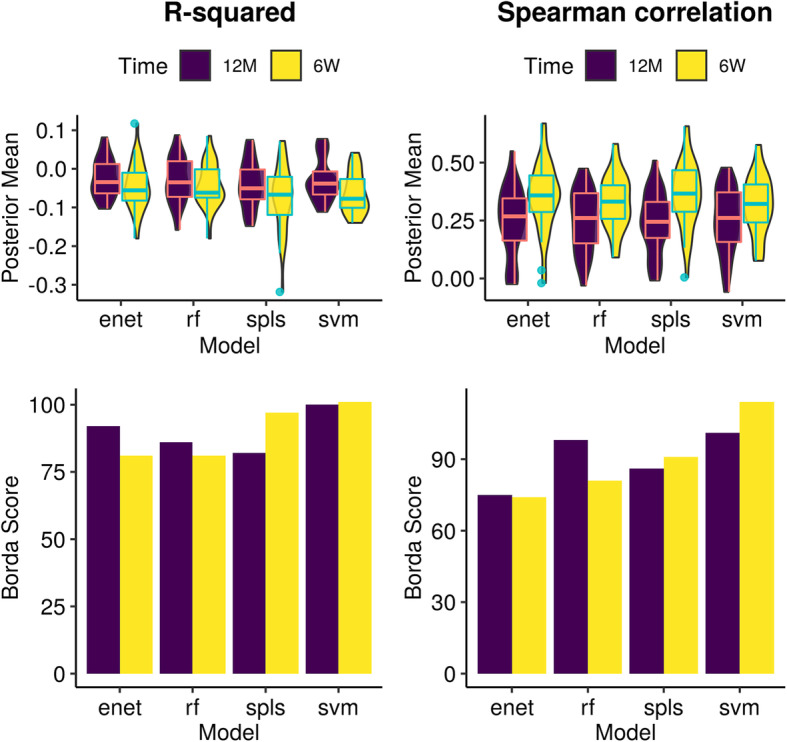
Results: Stool samples collected from infants enrolled in the New Hampshire Birth Cohort Study (NHBCS) at approximately 6-weeks (n = 158) and 12-months (n = 282) of age were profiled using targeted and untargeted nuclear magnetic resonance (NMR) spectroscopy as well as DNA sequencing of the V4-V5 hypervariable region from the bacterial 16S rRNA gene. There was significant inter-omic concordance based on Procrustes analysis (6 weeks: p = 0.056; 12 months: p = 0.001), however this association was no longer significant when accounting for phylogenetic relationships using generalized UniFrac distance metric (6 weeks: p = 0.376; 12 months: p = 0.069). Sparse canonical correlation analysis showed significant correlation, as well as identifying sets of microbe/metabolites driving microbiome-metabolome relatedness. Performance of machine learning models varied across different metabolites, with support vector machines (radial basis function kernel) being the consistently top ranked model. However, predictive R2 values demonstrated poor predictive performance across all models assessed (avg: - 5.06% -- 6 weeks; - 3.7% -- 12 months). Conversely, the Spearman correlation metric was higher (avg: 0.344-6 weeks; 0.265-12 months). This demonstrated that taxonomic relative abundance was not predictive of metabolite concentrations.

Conclusions: Our results suggest a degree of overall association between taxonomic profiles and metabolite concentrations. However, lack of predictive capacity for stool metabolic signatures reflects, in part, the possible role of functional redundancy in defining the taxa-function relationship in early life as well as the bidirectional nature of the microbiome-metabolome association. Our results provide evidence in favor of a multi-omic approach for microbiome studies, especially those focused on health outcomes.

Keywords: Functional redundancy; Infant gut microbiome; Metabolism; Prediction models; Stool metabolome.


Conflict of interest statement

The authors declare that they have no competing financial interests.

Figures

Fig. 1
Fig. 1
Overview of the analysis. Panel A describes the subject selection workflow and panel B describes the analytic pipeline
Fig. 2
Fig. 2
Inter-omics Procrustes biplots comparing PCoA ordinations of targeted metabolite profiles and taxonomic relative abundances for 6 weeks (left panels) (n = 158) and 12 months (right panels) (n = 262). Top panels present analyses based on ordinations from Euclidean distances of genus level abundances after centered log ratio transformation and Euclidean distances of log-transformed metabolite profiles. Bottom panel presents analyses based on gUniFrac distance of amplicon sequence variant (ASV) relative abundances and Euclidean distances of log-transformed metabolite profiles. There were significant associations between the microbiome and the metabolome (both targeted and untargeted) when utilizing Euclidean distances, however this association goes away when the gUniFrac distance was employed for the targeted metabolites only
Fig. 3
Fig. 3
Pairwise Spearman correlation of concentration-fitted metabolites and genus-level taxonomic abundances for 6-weeks (panel A, N = 158) and 12-months (panel B, N = 282) infants. Left panel displays the overall correlation pattern, where non-significant correlations are not colored (false discovery rate (FDR) controlled q-value < 0.05). Right panel displays the same heatmap restricted to taxa and metabolites selected by the sparse CCA procedure. Additionally, correlation coefficient of the first sCCA variate pair, bootstrapped 95% confidence interval and permutation p-value are also reported. Significant microbiome-metabolome correlation was observed at both time points, however no significant difference was found between the time points
Fig. 4
Fig. 4
Forest plots of each prediction performance metric (R-squared – Panel A, Spearman correlation – Panel B) for each time point (6 weeks (n = 158), 12 months (n = 282)) across all 36 metabolites and 4 machine learning models. 95% credible interval and predictive posterior means were generated using Bayesian modelling of the evaluation statistic (Methods) after 100 repeats of 5-fold nested cross validation. Red vertical lines indicate a value of 0 for the evaluation metric (equivalent to null model). Metabolites were classified as predictable if the null value did not lie within the estimated 95% credible interval. For most metabolites, predictive performance was not significantly better than null models
Fig. 5
Fig. 5
Comparative analysis predictive model performance across all metabolites in the targeted dataset for both 6-weeks (n = 158) and 12-months (n = 282) time points. Top panel shows superimposed boxplots and violin plots of the distribution of predictive posterior mean for each evaluation metric across all 36 metabolites. Bottom panels show aggregated model rankings for all metabolites using R-squared (left) and Spearman correlation (right) using Borda scores (Methods). Higher scores indicate that a model was consistently selected as a better performing. Relatively similar Borda scores and cross-metabolite average predictive performances indicate that no model was clearly the most performant. However, support vector machines (with radial basis function kernel) was highest scoring model

References

    1. Shreiner AB, Kao JY, Young VB. The gut microbiome in health and in disease. Curr Opin Gastroenterol. 2015;31(1):69–75. doi: 10.1097/MOG.0000000000000139. - DOI - PMC - PubMed
    1. Palmer C, Bik EM, DiGiulio DB, Relman DA, Brown PO. Development of the human infant intestinal microbiota. PLoS Biol. 2007;5(7):e177. doi: 10.1371/journal.pbio.0050177. - DOI - PMC - PubMed
    1. Koenig JE, Spor A, Scalfone N, Fricker AD, Stombaugh J, Knight R, et al. Succession of microbial consortia in the developing infant gut microbiome. Proc Natl Acad Sci. 2011;108(Supplement 1):4578–4585. doi: 10.1073/pnas.1000081107. - DOI - PMC - PubMed
    1. Stanislawski MA, Dabelea D, Wagner BD, Iszatt N, Dahl C, Sontag MK, et al. Gut Microbiota in the First 2 Years of Life and the Association with Body Mass Index at Age 12 in a Norwegian Birth Cohort. mBio. 2018;9. 10.1128/mBio.01751-18. - PMC - PubMed
    1. Kostic AD, Gevers D, Siljander H, Vatanen T, Hyötyläinen T, Hämäläinen A-M, Peet A, Tillmann V, Pöhö P, Mattila I, Lähdesmäki H, Franzosa EA, Vaarala O, de Goffau M, Harmsen H, Ilonen J, Virtanen SM, Clish CB, Orešič M, Huttenhower C, Knip M, DIABIMMUNE Study Group. Xavier RJ. The dynamics of the human infant gut microbiome in development and in progression toward type 1 diabetes. Cell Host Microbe. 2015;17(2):260–273. doi: 10.1016/j.chom.2015.01.001. - DOI - PMC - PubMed

Publication types

Substances