

A novel nomogram based on cardia invasion and chemotherapy to predict postoperative overall survival of gastric cancer patients
- PMID: 34454511
- PMCID: PMC8403379
- DOI: 10.1186/s12957-021-02366-4
A novel nomogram based on cardia invasion and chemotherapy to predict postoperative overall survival of gastric cancer patients
Abstract
Background: We aimed to establish and externally validate a nomogram to predict the 3- and 5-year overall survival (OS) of gastric cancer (GC) patients after surgical resection.
Methods: A total of 6543 patients diagnosed with primary GC during 2004-2016 were collected from the Surveillance, Epidemiology, and End Results (SEER) database. We grouped patients diagnosed during 2004-2012 into a training set (n = 4528) and those diagnosed during 2013-2016 into an external validation set (n = 2015). A nomogram was constructed after univariate and multivariate analysis. Performance was evaluated by Harrell's C-index, area under the receiver operating characteristic curve (AUC), decision curve analysis (DCA), and calibration plot.
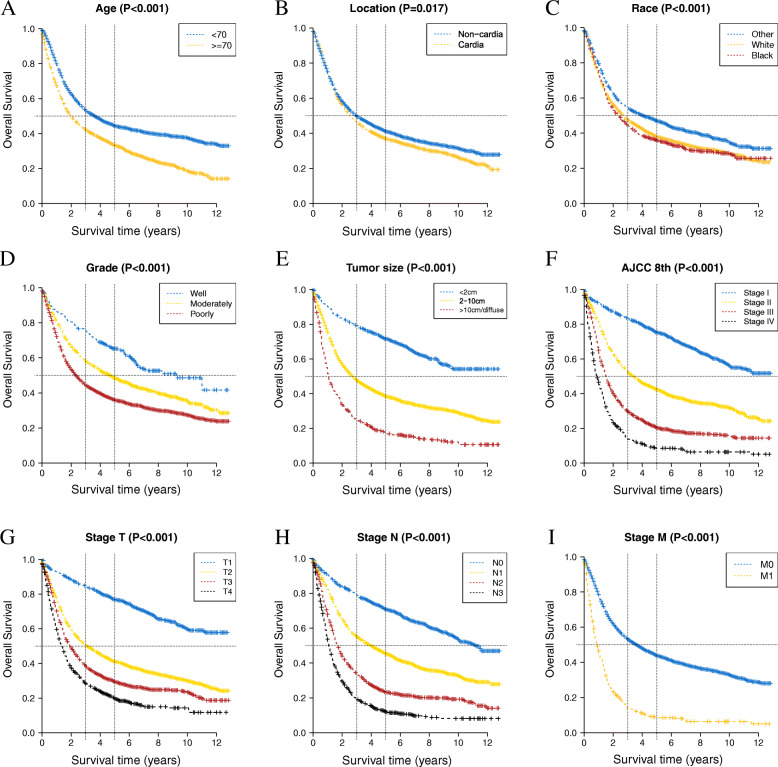
Results: The multivariate analysis identified age, race, location, tumor size, T stage, N stage, M stage, and chemotherapy as independent prognostic factors. In multivariate analysis, the hazard ratio (HR) of non-cardia invasion was 0.762 (P < 0.001) and that of chemotherapy was 0.556 (P < 0.001). Our nomogram was found to exhibit excellent discrimination: in the training set, Harrell's C-index was superior to that of the 8th American Joint Committee on Cancer (AJCC) TNM classification (0.736 vs 0.699, P < 0.001); the C-index was also better in the validation set (0.748 vs 0.707, P < 0.001). The AUCs for 3- and 5-year OS were 0.806 and 0.815 in the training set and 0.775 and 0.783 in the validation set, respectively. The DCA and calibration plot of the model also shows good performance.
Conclusions: We established a well-designed nomogram to accurately predict the OS of primary GC patients after surgical resection. We also further confirmed the prognostic value of cardia invasion and chemotherapy in predicting the survival rate of GC patients.
Keywords: Gastric cancer; Nomogram; Overall survival; SEER.
© 2021. The Author(s).
Conflict of interest statement
The authors declare that they have no competing interests.
Figures


Similar articles
-
A nomogram model based on the number of examined lymph nodes-related signature to predict prognosis and guide clinical therapy in gastric cancer.Front Immunol. 2022 Nov 2;13:947802. doi: 10.3389/fimmu.2022.947802. eCollection 2022. Front Immunol. 2022. PMID: 36405735 Free PMC article.
-
Development and validation of a nomogram to predict the prognosis of patients with gastric cardia cancer.Sci Rep. 2020 Aug 24;10(1):14143. doi: 10.1038/s41598-020-71146-z. Sci Rep. 2020. PMID: 32839498 Free PMC article.
-
Development and external validation of a nomogram predicting overall survival after curative resection of colon cancer.J Int Med Res. 2021 May;49(5):3000605211015023. doi: 10.1177/03000605211015023. J Int Med Res. 2021. PMID: 33990147 Free PMC article. Clinical Trial.
-
A nomogram for prediction of stage III/IV gastric cancer outcome after surgery: A multicenter population-based study.Cancer Med. 2020 Aug;9(15):5490-5499. doi: 10.1002/cam4.3215. Epub 2020 Jun 15. Cancer Med. 2020. PMID: 32543092 Free PMC article.
-
Development and validation of a nomogram to individually predict survival of young patients with nonmetastatic gastric cancer: A retrospective cohort study.Saudi J Gastroenterol. 2019 Jul-Aug;25(4):236-244. doi: 10.4103/sjg.SJG_378_18. Saudi J Gastroenterol. 2019. PMID: 30719999 Free PMC article.
Cited by
-
The Prognostic Significance of Nomogram-Based Pretreatment Inflammatory Indicators in Patients With Esophageal Squamous Cell Carcinoma Receiving Intensity-Modulated Radiotherapy.Cancer Control. 2023 Jan-Dec;30:10732748231185025. doi: 10.1177/10732748231185025. Cancer Control. 2023. PMID: 37339928 Free PMC article.
-
Cyclin D1 Serves as a Poor Prognostic Biomarker in Stage I Gastric Cancer.Curr Issues Mol Biol. 2022 Mar 20;44(3):1395-1406. doi: 10.3390/cimb44030093. Curr Issues Mol Biol. 2022. PMID: 35723316 Free PMC article.
-
SOX plus sintilimab vs P-SOX vs SOX as neoadjuvant therapy in advanced gastric cancer: Efficacy and safety.World J Gastrointest Oncol. 2025 Aug 15;17(8):109646. doi: 10.4251/wjgo.v17.i8.109646. World J Gastrointest Oncol. 2025. PMID: 40837776 Free PMC article.
-
Nomogram models for predicting overall and cancer-specific survival in early-onset gastric cancer patients: a population-based cohort study.Am J Cancer Res. 2024 Apr 15;14(4):1747-1767. doi: 10.62347/FPRM7701. eCollection 2024. Am J Cancer Res. 2024. PMID: 38726268 Free PMC article.
-
Developing a prognostic signature: identifying differentially expressed genes in cardia and non-cardia gastric cancer for immunity and therapeutic sensitivity analysis.J Gastrointest Oncol. 2024 Aug 31;15(4):1446-1463. doi: 10.21037/jgo-24-541. Epub 2024 Aug 28. J Gastrointest Oncol. 2024. PMID: 39279940 Free PMC article.
References
-
- Karimi P, Islami F, Anandasabapathy S, Freedman ND, Kamangar F. Gastric cancer: descriptive epidemiology, risk factors, screening, and prevention. Cancer epidemiology, biomarkers & prevention : a publication of the American Association for Cancer Research, cosponsored by the American Society of Preventive Oncology. 2014;23(5):700–713. doi: 10.1158/1055-9965.EPI-13-1057. - DOI - PMC - PubMed
MeSH terms
Grants and funding
LinkOut - more resources
Full Text Sources
Medical
Miscellaneous
