. 2021 Aug 28;18(1):187.
doi: 10.1186/s12974-021-02234-8.

Attenuating vascular stenosis-induced astrogliosis preserves white matter integrity and cognitive function

Affiliations

Attenuating vascular stenosis-induced astrogliosis preserves white matter integrity and cognitive function

Qian Liu et al. J Neuroinflammation. .

Abstract

Background: Chronic cerebral hypoperfusion (CCH) causes white matter damage and cognitive impairment, in which astrogliosis is the major pathology. However, underlying cellular mechanisms are not well defined. Activation of Na+/H+ exchanger-1 (NHE1) in reactive astrocytes causes astrocytic hypertrophy and swelling. In this study, we examined the role of NHE1 protein in astrogliosis, white matter demyelination, and cognitive function in a murine CCH model with bilateral carotid artery stenosis (BCAS).

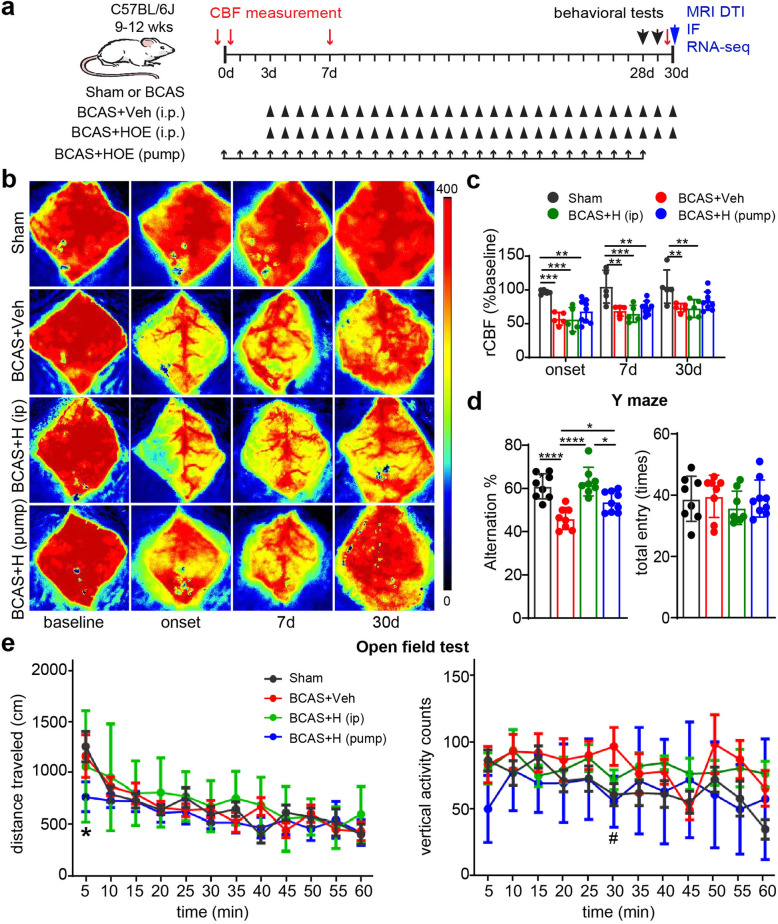
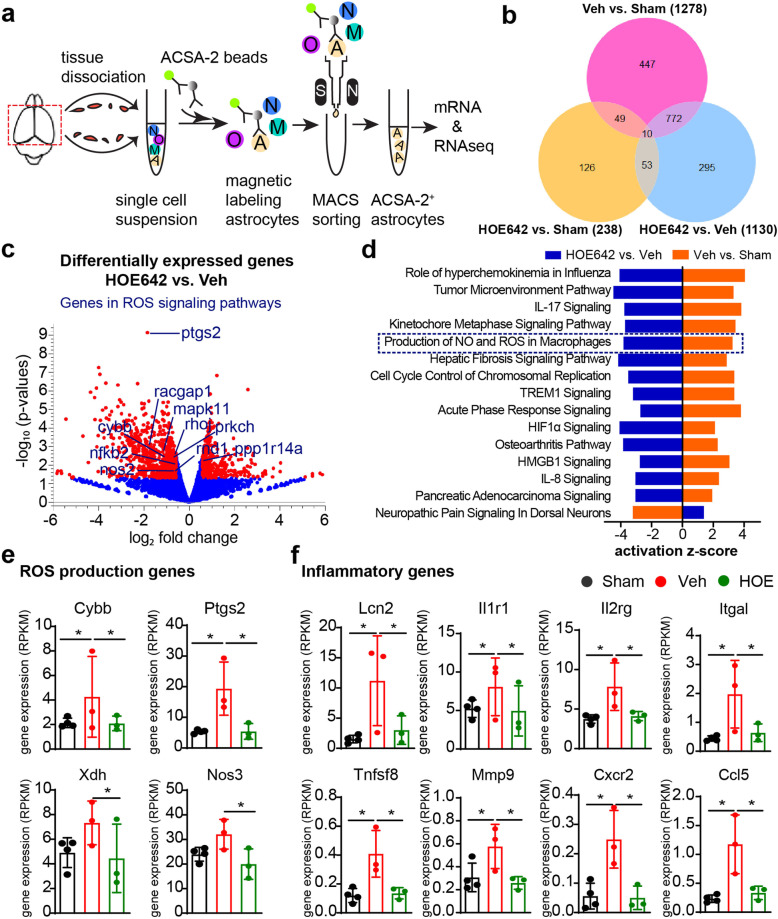
Methods: Sham, BCAS, or BCAS mice receiving vehicle or a selective NHE1 inhibitor HOE642 were monitored for changes of the regional cerebral blood flow and behavioral performance for 28 days. Ex vivo MRI-DTI was subsequently conducted to detect brain injury and demyelination. Astrogliosis and demyelination were further examined by immunofluorescence staining. Astrocytic transcriptional profiles were analyzed with bulk RNA-sequencing and RT-qPCR.

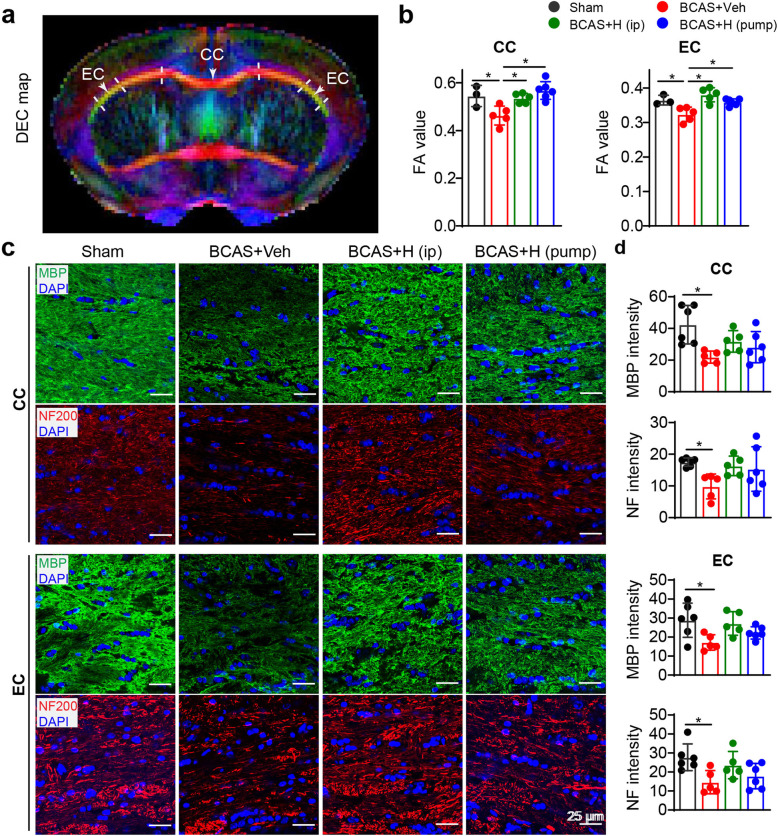
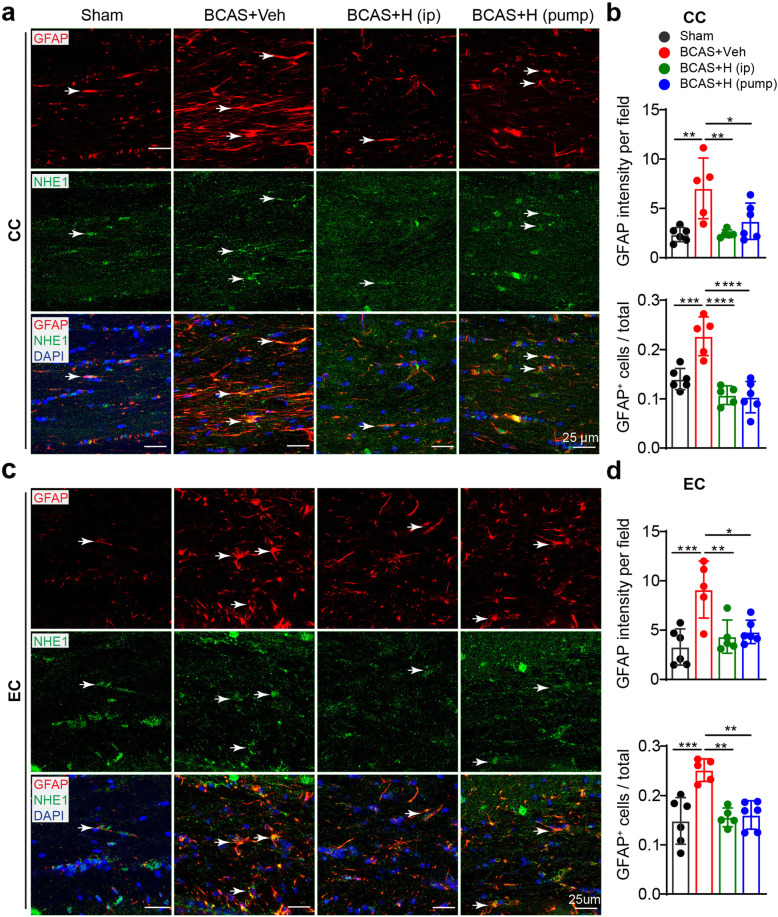
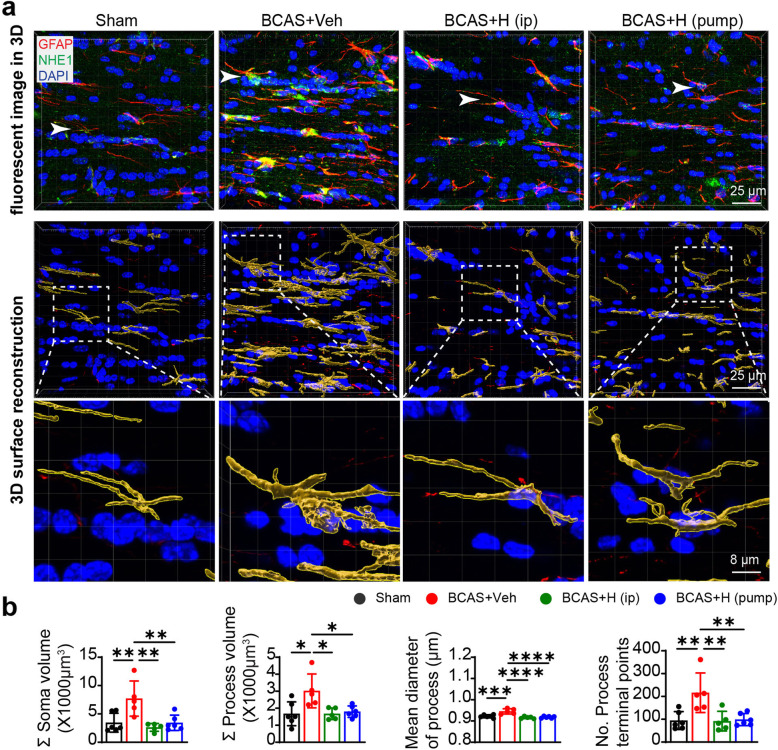
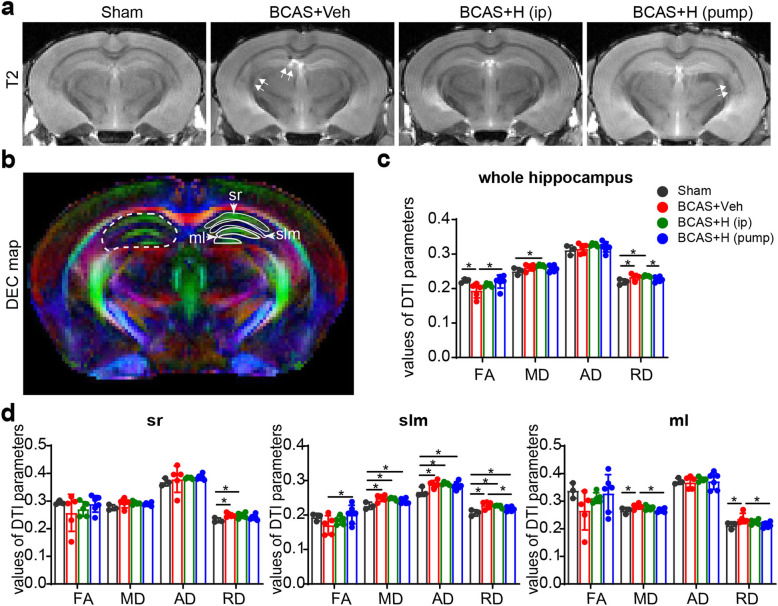
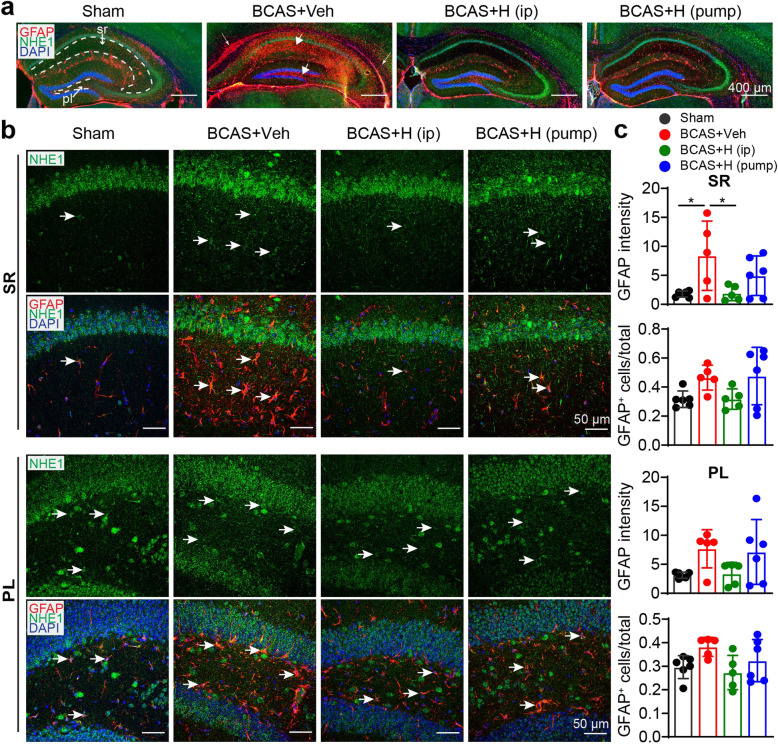
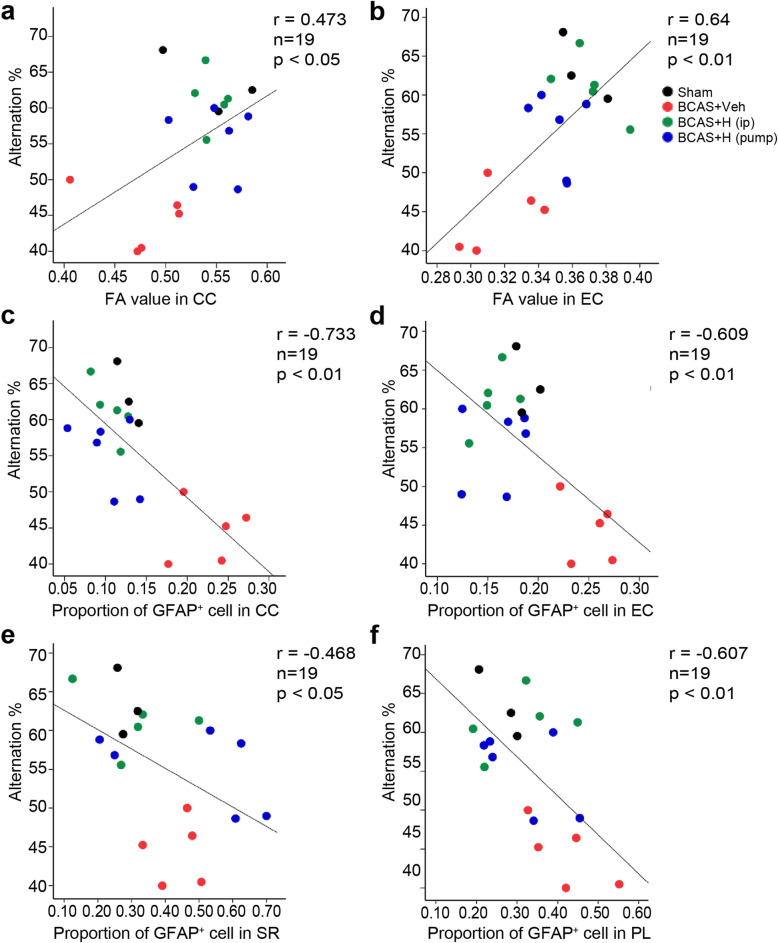
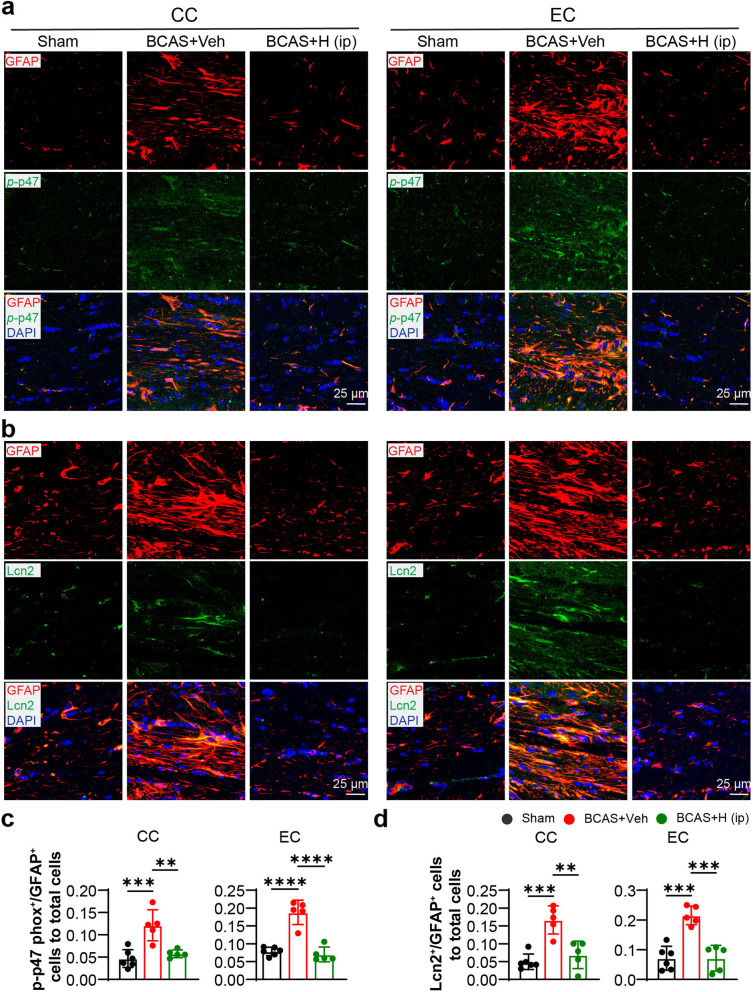
Results: Chronic cerebral blood flow reduction and spatial working memory deficits were detected in the BCAS mice, along with significantly reduced mean fractional anisotropy (FA) values in the corpus callosum, external capsule, and hippocampus in MRI DTI analysis. Compared with the sham control mice, the BCAS mice displayed demyelination and axonal damage and increased GFAP+ astrocytes and Iba1+ microglia. Pharmacological inhibition of NHE1 protein with its inhibitor HOE642 prevented the BCAS-induced gliosis, damage of white matter tracts and hippocampus, and significantly improved cognitive performance. Transcriptome and immunostaining analysis further revealed that NHE1 inhibition specifically attenuated pro-inflammatory pathways and NADPH oxidase activation.

Conclusion: Our study demonstrates that NHE1 protein is involved in astrogliosis with pro-inflammatory transformation induced by CCH, and its blockade has potentials for reducing astrogliosis, demyelination, and cognitive impairment.

Keywords: Demyelination; Gliosis; Hypoperfusion; Na+/H+ exchanger; Vascular dementia.


Conflict of interest statement

The authors declare that they have no competing interests.

Figures

Fig. 1
Fig. 1
Pharmacological inhibition of NHE1 protein in BCAS mice improved their spatial working memory. a Experimental protocol. C57BL/6J mice underwent sham or BCAS surgery. BCAS mice received either saline vehicle (Veh) or HOE642 (0.3mg/kg/day) via intraperitoneal injection (i.p.) for 3–30 days or via mini-pump for 0-28 days. b Representative images of regional cerebral blood flow (rCBF). c PeriCam PSI analysis of rCBF. Data are presented as mean ± SD. n = 5–9/group. *p < 0.05, **p < 0.01, ***p < 0.001. d The percentage of spontaneous alternation and total entry in Y maze test. n = 8–9/group. *p < 0.05, ****p < 0.0001. e Open field test. Data are represented as mean ± SD. n = 8–9/group. *p < 0.05 vs. sham. #p < 0.05 vs. Veh
Fig. 2
Fig. 2
Blocking NHE1 with inhibitor HOE642 in BCAS mice ameliorated white matter damage. a Representative DEC maps showing corpus callosum (CC) and external capsule (EC) for DTI analysis. At 30 days post-BCAS following neurological function analysis in Fig. 1d, mice were sacrifized for ex vivo brain MRI DTI and subseqent immunoflurorescence staining. b Quantitative analysis of mean FA values in CC and EC. Data are presented as mean ± SD. sham group: n = 3, BCAS+Veh and BCAS+HOE (i.p. or pump): n = 5–6. *p < 0.05. c Representative images of MBP or NF staining in CC and EC. However, due to lack of optimal anti-MBP and NF200 antibodies for double labeling, the images in Fig. 2C were obtained from anti-MBP or anti-NF200 staining, respectively. d Quantitative analysis of immunofluorescent intensity of MBP and NF in CC and EC, respectively. Data are presented as mean ± SD. n = 5–6/group. *p < 0.05
Fig. 3
Fig. 3
Pharmacological inhibition of NHE1 suppressed BCAS-induced formation of reactive astrogliosis in white matter tracts. a, c Representative images of immunostaining of GFAP and NHE1 protein in CC (a) and EC (c) of mice at 30 days post-surgery. Arrow: GFAP or NHE1 protein expression in GFAP+ cells. b, d Quantitative analysis of GFAP+ cell counts as well as GFAP intensity in CC (b) or EC (d). Data are presented as mean ± SD. n = 5–6/group. *p < 0.05, **p < 0.01, ***p < 0.001, ****p < 0.0001
Fig. 4
Fig. 4
Inhibition of NHE1 by HOE642 suppressed BCAS-induced hypertrophy of reactive astrocytes in white matter tracts. a Representative IMARIS 3D view of raw immunofluorescent Z-stack images: GFAP (red), NHE1 (green) and DAPI (blue), and 3D surface reconstruction of astrocytes based on GFAP immunostaining (red) in CC. White arrow: the position of boxed astrocytes in surface reconstruction in immunofluorescent Z-stack images. b Quantitative analysis of sum of soma volume, process volume, process mean diameter and terminal points of process for sham, BCAS+Veh, BCAS+HOE (i.p.) and BCAS+HOE (pump) groups. Data are presented as mean ± SD. n = 5–6/group. *p < 0.05, **p < 0.01, ***p < 0.001, ****p < 0.0001
Fig. 5
Fig. 5
MRI revealed tolerance of HOE642-treated mice to BCAS-induced hippocampal injury. a Representative T2-weighted images of ex vivo brains of sham, BCAS+Veh, BCAS+HOE (i.p. or pump) mice at 30 days post-surgery. Double white arrow indicates damage on T2-weighted images. b Representative DEC maps of ex vivo brain showing ROIs in whole hippocampus (white dash line), stratum radiatum (sr), stratum lacunosum-meloculare (slm), and molecular layer (ml). c Quantitative analysis of FA, MD, AD, RD values of whole hippocampus. d Quantitative analysis of FA, MD, AD and RD values of different hippocampal regions. Data are presented as mean ± SD. n = 3–6/group. *p < 0.05
Fig. 6
Fig. 6
Inhibition of NHE1 protein with its inhibitor HOE642 in BCAS mice attenuated hippocampal astrogliosis. a Representative overview of NHE1 protein (green) and GFAP protein (red) expression in hippocampus at 30 days post-surgery. Thin arrow: increased GFAP+ astrocytes in CC and EC. Thick arrow: reactive GFAP+ astrocytes in hippocampus. Magnification ×10, scale bar = 400 μm. b Representative images of NHE1 (green) and GFAP (red) staining in stratum radiatum (SR) under CA1 field of hippocampus and in polymorph layer (PL) of dentate gyrus at 30 days post-surgery. Magnification ×40, scale bar = 50 μm. c Quantitative analysis of GFAP+ cells. Data are presented as mean ± SD. n = 5–6/group. *p < 0.05
Fig. 7
Fig. 7
Correlation between alternation and microstructural change and astrogliosis in white matter tracts and hippocampus. a Pearson correlation between alternation in Y maze test and FA value in corpus colusum (CC). b Pearson correlation between alternation and FA value in external capsule (EC). c Pearson correlation between alternation and GFAP+ cell counts in CC. d Pearson correlation between alternation and GFAP+ cell counts in EC. e Pearson correlation between alternation and GFAP+ cell counts in hippocampal stratum radiatum (SR). f Pearson correlation between alternation and GFAP+ cell counts in poly morph layer (PL) of dentate gyrus. n = 19
Fig. 8
Fig. 8
Bulk RNA-seq analysis of transcriptome changes in brain astrocytes. a Schematics of brain astrocyte isolation for bulk RNA-seq analysis from sham, BCAS+Veh (i.p.), and BCAS+HOE642 (i.p.) mice at 30 days post-surgery. n = 4/group. b Venn diagram depicting differential gene expression in brain astrocytes (p value ≤ 0.05 and FC≥1.5). c Volcano plots illustrate the gene expression pattern detected with p value ≤ 0.05 and FC≥1.5. Red dot: significant differentially expressed gene; Blue dot: non-significant differentially expressed gene. d Comparison analysis of significantly altered canonical pathways by ingenuity pathway analysis (IPA) between BCAS+Veh vs. sham group and BCAS+HOE vs. BCAS+Veh group. p value < 0.05 and Z-score ≥ 3. e ROS production genes expression. Data are RPKM values shown as mean ± SD, n = 3-4. *p ≤ 0.05 and FC >1.5. f Inflammatory gene expression. Data are RPKM values shown as mean ± SD, n = 3–4. *p ≤ 0.05 and FC > 1.5
Fig. 9
Fig. 9
HOE642 treatment attenuated astrocytic NOX2 activation and LCN2 expression in white matter. a Representative staining images of phosphorylated p47 phox (green) and GFAP (red) in CC and EC at 30 days post-surgery. Magnification ×40, Scale bar = 25 μm. b Representative immunostaining images of LCN2 (green) and GFAP (red) in CC and EC. Magnification ×40, scale bar = 25 μm. c Quantitative analysis of the co-labeled p-p47+/GFAP+ cells in CC and EC. d Quantitative analysis of the co-labeled LCN2+/GFAP+ cells in CC and EC. All data are presented as mean ± SD. n = 5–6. **p < 0.01, ***p < 0.001, ****p < 0.0001

References

    1. Rizzi L, Rosset I, Roriz-Cruz M. Global epidemiology of dementia: Alzheimer's and vascular types. Biomed Res Int. 2014;2014:908915. doi: 10.1155/2014/908915. - DOI - PMC - PubMed
    1. Gladman JT, Corriveau RA, Debette S, et al. Vascular contributions to cognitive impairment and dementia: research consortia that focus on etiology and treatable targets to lessen the burden of dementia worldwide. Alzheimers Dement (N Y) 2019;5:789–796. doi: 10.1016/j.trci.2019.09.017. - DOI - PMC - PubMed
    1. Duncombe J, Kitamura A, Hase Y, et al. Chronic cerebral hypoperfusion: a key mechanism leading to vascular cognitive impairment and dementia. Closing the translational gap between rodent models and human vascular cognitive impairment and dementia. Clin Sci (Lond) 2017;131:2451–2468. doi: 10.1042/CS20160727. - DOI - PubMed
    1. Suri S, Topiwala A, Chappell MA, et al. Association of Midlife Cardiovascular Risk Profiles with Cerebral Perfusion at older ages. JAMA Netw Open. 2019;2:e195776. doi: 10.1001/jamanetworkopen.2019.5776. - DOI - PMC - PubMed
    1. Staffaroni AM, Cobigo Y, Elahi FM, et al. Hum Brain Mapp. 2019;40:3522–3533. doi: 10.1002/hbm.24613. - DOI - PMC - PubMed

MeSH terms

LinkOut - more resources