. 2021 Aug 28;13(1):137.
doi: 10.1186/s13073-021-00937-4.

Functional significance of gain-of-function H19 lncRNA in skeletal muscle differentiation and anti-obesity effects

Affiliations

Functional significance of gain-of-function H19 lncRNA in skeletal muscle differentiation and anti-obesity effects

Yajuan Li et al. Genome Med. .

Abstract

Background: Exercise training is well established as the most effective way to enhance muscle performance and muscle building. The composition of skeletal muscle fiber type affects systemic energy expenditures, and perturbations in metabolic homeostasis contribute to the onset of obesity and other metabolic dysfunctions. Long noncoding RNAs (lncRNAs) have been demonstrated to play critical roles in diverse cellular processes and diseases, including human cancers; however, the functional importance of lncRNAs in muscle performance, energy balance, and obesity remains elusive. We previously reported that the lncRNA H19 regulates the poly-ubiquitination and protein stability of dystrophin (DMD) in muscular dystrophy.

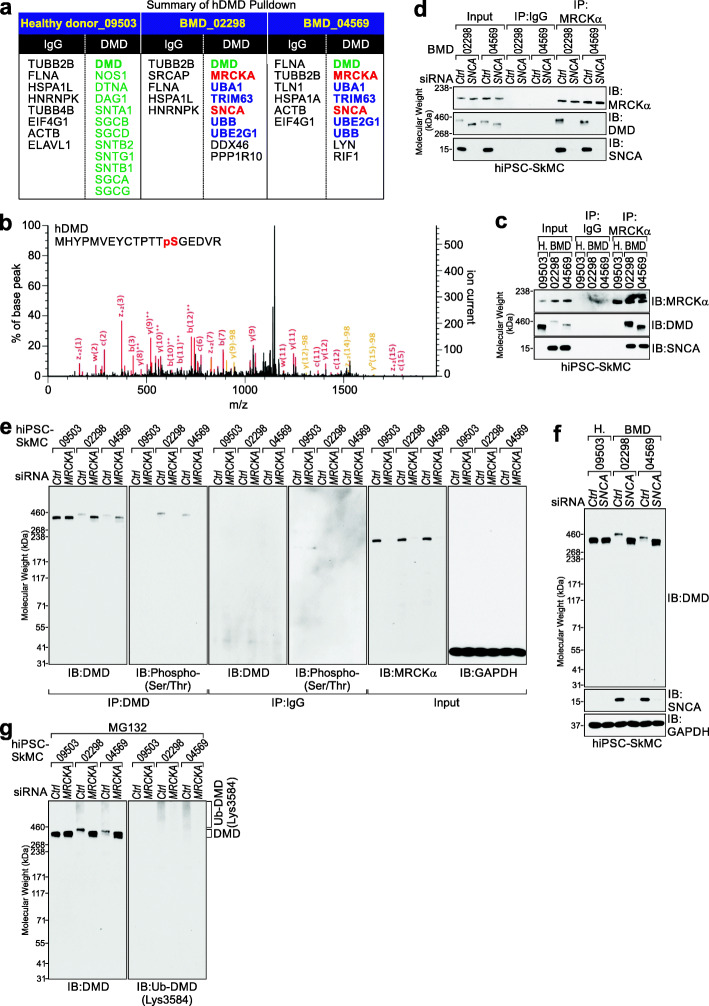
Methods: Here, we identified mouse/human H19-interacting proteins using mouse/human skeletal muscle tissues and liquid chromatography-mass spectrometry (LC-MS). Human induced pluripotent stem-derived skeletal muscle cells (iPSC-SkMC) from a healthy donor and Becker Muscular Dystrophy (BMD) patients were utilized to study DMD post-translational modifications and associated proteins. We identified a gain-of-function (GOF) mutant of H19 and characterized the effects on myoblast differentiation and fusion to myotubes using iPSCs. We then conjugated H19 RNA gain-of-function oligonucleotides (Rgof) with the skeletal muscle enrichment peptide agrin (referred to as AGR-H19-Rgof) and evaluated AGR-H19-Rgof's effects on skeletal muscle performance using wild-type (WT) C57BL/6 J mice and its anti-obesity effects using high-fat diet (HFD)- and leptin deficiency-induced obese mouse models.

Results: We demonstrated that both human and mouse H19 associated with DMD and that the H19 GOF exhibited enhanced interaction with DMD compared to WT H19. DMD was found to associate with serine/threonine-protein kinase MRCK alpha (MRCKα) and α-synuclein (SNCA) in iPSC-SkMC derived from BMD patients. Inhibition of MRCKα and SNCA-mediated phosphorylation of DMD antagonized the interaction between H19 and DMD. These signaling events led to improved skeletal muscle cell differentiation and myotube fusion. The administration of AGR-H19-Rgof improved the muscle mass, muscle performance, and base metabolic rate of WT mice. Furthermore, mice treated with AGR-H19-Rgof exhibited resistance to HFD- or leptin deficiency-induced obesity.

Conclusions: Our study suggested the functional importance of the H19 GOF mutant in enhancing muscle performance and anti-obesity effects.

Keywords: Dystrophin; H19; Long noncoding RNA; Obesity; RNA therapy; Skeletal muscle.


Conflict of interest statement

Zhen Xing is now an employee of Sanofi U.S. The remaining authors declare that they have no competing interests.

Figures

Fig. 1
Fig. 1
H19-GOF mutant exhibits enhanced interaction with DMD. a Protein score of human or mouse H19-interacting proteins identified by LC-MS. b RT-QPCR detection of RIP assay using the indicated antibodies in C2C12 or HSMC. Mean±SEM, n = 3 independent experiments, one-way ANOVA. c Saturation curve determination using His-tagged recombinant DMD (aa. 3046-3685) and biotinylated H19, indicated as a donor/acceptor pair. The concentration of His-tagged recombinant DMD (aa. 3046–3685) is shown. Mean ± SD, n = 3 independent experiments. d In vitro RNA-protein binding followed by dot blot assays using in vitro transcribed biotinylated H19 sense (sen.) or antisense (a.s.) in the presence of indicated recombinant proteins. LINK-A was included as negative control. BRK (breast tumor kinase) is a confirmed binding partner of LINK-A. Bottom panel: annotation for each dot. A1-F8 indicates individual H19 probes (antisense oligos, 30 bp per probe, from 1 to 2340), F9 indicates antisense sequences of LINK-A 471–550, F10 indicates antisense sequences of LINK-A 1251–1330, F11 and F12 are blank, and F13 and F14 are His6-peptide. e EMSA using His-tagged DMD (aa.3046–3685) or Y/F-A mutant and [γ-32P]-labeled human H19 RNA (nt. 1951–1980), Rlof, or Rgof as indicated. f Competition binding assay to determine the Kd of the interaction between His-tagged DMD (aa.3046–3685) and biotinylated-H191951-80. Unlabeled H191951-80 WT or Rgof mutant served as competitors. Mean±SD, n = 3 independent experiments. g Autoradiography (right) or IB detection using the indicated antibodies (left) of CLIP assay in Dmd- or H19-knockout C2C12 cells expressing the indicated constructs. No significance [n.s.], p > 0.05, *, p < 0.05, **, p < 0.01, ***, p < 0.001
Fig. 2
Fig. 2
MRCKα and SNCA facilitate the phosphorylation and poly-ubiquitination of DMD. a List of DMD-associated proteins identified by LC-MS in iPSC-SkMC derived from GM09503 (healthy donor), GM02298 (BMD patient), or GM04569 (BMD patient), respectively. b LC-MS annotation of peptide harboring p-DMD Ser3365. c Co-IP followed by immunoblotting (IB) using the indicated antibodies in iPSC-SkMC. d Co-IP and IB detection using the indicated antibodies in iPSC-SkMC in the presence of the indicated siRNAs. e, f IB detection using the indicated antibodies in iPSC-SkMC in the presence of the indicated siRNAs. g IB detection using the indicated antibodies in iPSC-SkMC in the presence of the indicated siRNAs and MG132
Fig. 3
Fig. 3
H19-GOF mutant promotes myotube differentiation and fusion. a Immunofluorescence staining using the indicated antibodies of iPSC-differentiated, H19-proficient or H19-deficient myotubes, with expression of backbone plasmid (Blank), H19 WT, or H19-GOF plasmid. Scale bars, 100 μm. b, c Statistical analysis of DMD (b) or MHC (c) staining intensities of iPSC-differentiated, H19-proficient or H19-deficient myotubes, with expression of indicated plasmid. Mean±SD, n = 6 independent experiments, one-way ANOVA. d Immunofluorescence staining using the indicated antibodies of iPSC-differentiated, H19-proficient or -deficient myotube fusion, with expression of indicated plasmid. Scale bars, 100 μm. (e) Percentage of fusion index of iPSC-differentiated, H19-proficient or H19-deficient myotube fusion, with expression of indicated plasmid. Mean ± SD, n = 6 independent experiments, one-way ANOVA. No significance [n.s.], p > 0.05, *, p < 0.05, **, p < 0.01, ***, p < 0.001
Fig. 4
Fig. 4
H19-Rgof mimics facilitate myotube differentiation and fusion. a Graphic illustration of the indicated RNA mimics predicted by RNAfold WebServer. b Competition binding assay to determine the Kd of the interaction between DMD (aa.3046–3685) and H19 WT, Rgof, or Rlof mimics. Unlabeled indicated RNA mimics served as competitors. Mean ± SD, n = 3 independent experiments. c Immunofluorescence staining using the indicated antibodies of iPSC-differentiated myotubes treated with Scr, H19-WT, H19-Rgof, or H19-Rlof mimics. Scale bars, 100 μm. d, e Statistical analysis of DMD (d) or MHC (e) staining intensities of iPSC-differentiated myotubes with indicated treatment. Mean±SD, n = 5 independent experiments, one-way ANOVA. f Immunofluorescence staining using the indicated antibodies of iPSC-differentiated myotubes with indicated treatment. Scale bars, 100 μm. g Percentage of fusion index of iPSC-differentiated myotubes with indicated treatment. Mean ± SD, n = 5 independent experiments, one-way ANOVA. No significance [n.s.], p > 0.05, *, p < 0.05, **, p < 0.01, ***, p < 0.001
Fig. 5
Fig. 5
AGR-H19-Rgof enhances animal muscle mass. a Graphic illustration of AGR-H19-Rgof and experimental settings. b Representative pictures of AGR-Scr or AGR-H19-Rgof-treated muscle pieces. c Weights of individual indicated muscles from mice with indicated treatment. Mean±SD, n = 5, 6, 8 animals, one-way ANOVA. d Weights of BAT, WAT, or VAT from mice with indicated treatment. Mean±SD, n = 5, 6, 8 animals, one-way ANOVA. e Representative images of lean, fat, and bone tissues by the dual-energy x-ray absorptiometry imaging system from mice with indicated treatment. f Quantification of body weight, lean weight, and fat weight by the dual-energy x-ray absorptiometry imaging system from mice with indicated treatment. Mean ± SD, n = 5 animals per experimental group, Student’s t test. g Immunofluorescence staining using the indicated antibodies of TA. Scale bars, 100 μm. h, i Statistical analysis of staining intensities of DMD (h, left), β-dystroglycan (h, right) or DRP2 (i, left), or nNOS (i, right) of TA. Mean ± SD, n = 8 animals per experimental group, Student’s t test
Fig. 6
Fig. 6
AGR-H19-Rgof alters muscle fiber type composition. a Immunofluorescence staining using the indicated antibodies or H&E staining of TA treated with AGR-Scr or AGR-H19-Rgof. Scale bars, 1 mm or 100 μm as indicated. b Number of muscle fibers per muscle piece of animals with indicated treatment. Mean ± SD, n = 5 animals per experimental group, Student’s t test. c Frequency distribution of cross-sectional TA-muscle fiber area. Mean ± SD, n = 5 animals per experimental group. d SDH staining (top) and immunostaining of different skeletal muscle fiber-types (bottom) from TA of animals with indicated treatment. Scale bars, 1 mm. e, f Percentage of different skeletal muscle fiber-types from QUAD (e) or SOL (f) of animals with indicated treatment. Mean ± SD, n = 5 animals per experimental group, Student’s t test. g SDH-positive fibers per muscle piece of animals with indicated treatment. Mean ± SD, n = 5 animals per experimental group, Student’s t test. h Forelimb grip strength test of male (left) or female (right) animals with indicated treatment. Mean ± SD, n = 8 animals per experimental group, Student’s t test. i Running speed of male (left) or female (right) animals with indicated treatment. Mean ± SD, n = 15 animals per experimental group, Student’s t test. j Top: graphic illustration of sprint treadmill protocol. Bottom: Maximum speed of male (left) or female (right) animals with indicated treatment. Mean ± SD, n = 10 animals per experimental group, Student’s t test
Fig. 7
Fig. 7
AGR-H19-Rgof alleviates HFD-induced obesity. a Left: Representative pictures of C57BL/6 J mice on a HFD followed by indicated treatment. Right: Comparison of body weights of mice with indicated treatment. Mean±SD, n=10 animals per group, one-way ANOVA. b Gained body weight after 14 weeks on HFD followed by indicated treatment. Mean ± SD, n = 10 animals per group, one-way ANOVA. c Top: Representative images showing individual muscle pieces. Bottom: Normalized weights of individual muscles. Mean ± SD, n = 10, 9 animals per group, Student’s t test. d Weight measurements of fat tissues. Mean±SD, n = 10, 9 animals per group, Student’s t test. e Forelimb grip strength test of C57BL/6 J mice on a HFD followed by indicated treatment. Mean ± SD, n = 5 animals per group, Student’s t test. f, g Total running time (f) or speed (g) of C57BL/6 J mice on a HFD followed by indicated treatment. Mean±SD, n = 5 animals per group, Student’s t test. h H&E, immunofluorescence staining, and Oil Red O staining of TA, livers, and WAT of C57BL/6 J mice on a HFD followed by indicated treatment. Scale bars, 100 μm. i, j Statistical analysis of staining intensities of DMD (i) or Ub-DMD (j). Mean ± SD, n = 8 animals per group, Student’s t test. k Mean TA fiber area of C57BL/6 J mice on a HFD followed by indicated treatment. Mean±SD, n = 10, 9 animals per group, Student’s t test. l Representative images (top) and weight measurement (bottom) of livers. Mean ± SD, n = 10, 9 animals per group, Student’s t test. m Energy expenditure measurements of C57BL/6 J mice on a HFD followed by indicated treatment. Mean±SD, n = 4 animals per group, two-way ANOVA. np Serum insulin concentration (n), total cholesterol (o), or leptin concentration (p) of C57BL/6 J mice on a HFD followed by indicated treatment. Mean ± SD, n = 5, 5 (n), 10, 9 (o), or 7, 7 (p) animals per group, Student’s t test. No significance [n.s.], p > 0.05, *, p < 0.05, **, p < 0.01, ***, p < 0.001, ***, p < 0.0001

References

    1. Hughes DC, Ellefsen S, Baar K. Adaptations to Endurance and Strength Training. Cold Spring Harb Perspect Med. 2018;8(6). 10.1101/cshperspect.a029769. - PMC - PubMed
    1. Talmadge RJ, Roy RR, Edgerton VR. Muscle fiber types and function. Curr Opin Rheumatol. 1993;5(6):695–705. doi: 10.1097/00002281-199305060-00002. - DOI - PubMed
    1. Qaisar R, Bhaskaran S, Van Remmen H. Muscle fiber type diversification during exercise and regeneration. Free Radic Biol Med. 2016;98:56–67. doi: 10.1016/j.freeradbiomed.2016.03.025. - DOI - PubMed
    1. Dandoy C, Gereige RS. Performance-enhancing drugs. Pediatr Rev. 2012;33(6):265–271. doi: 10.1542/pir.33-6-265. - DOI - PMC - PubMed
    1. Avois L, Robinson N, Saudan C, Baume N, Mangin P, Saugy M. Central nervous system stimulants and sport practice. Br J Sports Med. 2006;40(Suppl 1):i16–i20. doi: 10.1136/bjsm.2006.027557. - DOI - PMC - PubMed

Publication types

MeSH terms