. 2021 Aug 28;12(1):480.
doi: 10.1186/s13287-021-02554-9.

A novel conjunctive microenvironment derived from human subcutaneous adipose tissue contributes to physiology of its superficial layer

Affiliations

A novel conjunctive microenvironment derived from human subcutaneous adipose tissue contributes to physiology of its superficial layer

Leandra Santos Baptista et al. Stem Cell Res Ther. .

Abstract

Background: In human subcutaneous adipose tissue, the superficial fascia distinguishes superficial and deep microenvironments showing extensions called retinacula cutis. The superficial subcutaneous adipose tissue has been described as hyperplastic and the deep subcutaneous adipose tissue as inflammatory. However, few studies have described stromal-vascular fraction (SVF) content and adipose-derived stromal/stem cells (ASCs) behavior derived from superficial and deep subcutaneous adipose tissue. In this study, we analyzed a third conjunctive microenvironment: the retinacula cutis superficialis derived from superficial subcutaneous adipose tissue.

Methods: The samples of abdominal human subcutaneous adipose tissue were obtained during plastic aesthetic surgery in France (Declaration DC-2008-162) and Brazil (Protocol 145/09).

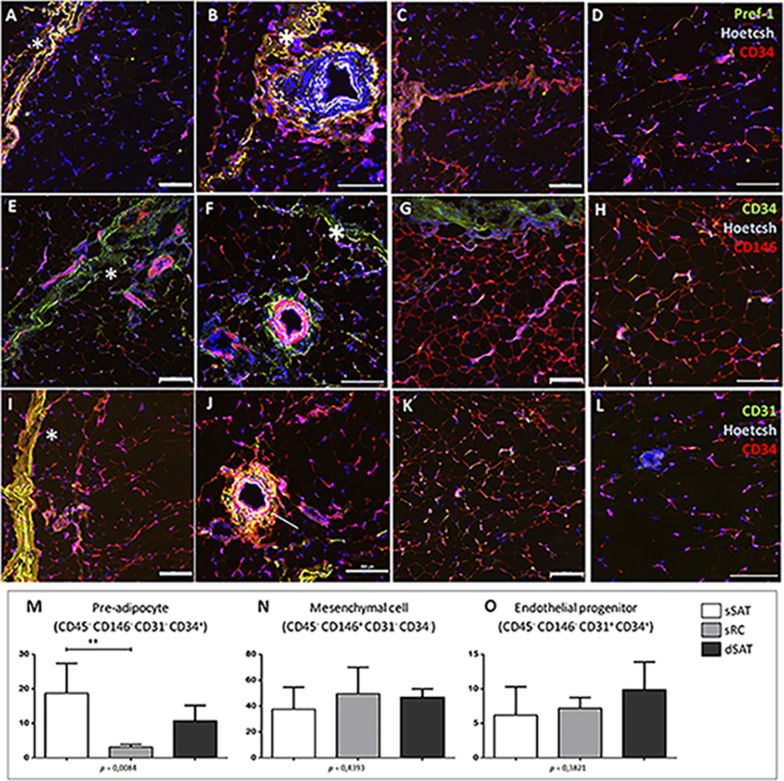
Results: The SVF content was characterized in situ by immunofluorescence and ex vivo by flow cytometry revealing a high content of pre-adipocytes rather in superficial subcutaneous adipose tissue microenvironment. Adipogenic assays revealed higher percentage of lipid accumulation area in ASCs from superficial subcutaneous adipose tissue compared with retinacula cutis superficialis (p < 0.0001) and deep subcutaneous adipose tissue (p < 0.0001). The high adipogenic potential of superficial subcutaneous adipose tissue was corroborated by an up-regulation of adipocyte fatty acid-binding protein (FABP4) compared with retinacula cutis superficialis (p < 0.0001) and deep subcutaneous adipose tissue (p < 0.0001) and of C/EBPα (CCAAT/enhancer-binding protein alpha) compared with retinacula cutis superficialis (p < 0.0001) and deep subcutaneous adipose tissue (p < 0.0001) microenvironments. Curiously, ASCs from retinacula cutis superficialis showed a higher level of adiponectin receptor gene compared with superficial subcutaneous adipose tissue (p = 0.0409), widely known as an anti-inflammatory hormone. Non-induced ASCs from retinacula cutis superficialis showed higher secretion of human vascular endothelial growth factor (VEGF), compared with superficial (p = 0.0485) and deep (p = 0.0112) subcutaneous adipose tissue and with adipogenic-induced ASCs from superficial (p = 0.0175) and deep (p = 0.0328) subcutaneous adipose tissue. Furthermore, ASCs from retinacula cutis superficialis showed higher secretion of Chemokine (C-C motif) ligand 5 (CCL5) compared with non-induced (p = 0.0029) and induced (p = 0.0089) superficial subcutaneous adipose tissue.

Conclusions: This study highlights the contribution to ASCs from retinacula cutis superficialis in their angiogenic property previously described for the whole superficial subcutaneous adipose tissue besides supporting its adipogenic potential for superficial subcutaneous adipose tissue.

Keywords: Adipose stromal/stem cells; Deeper microenvironment; Human subcutaneous adipose tissue; Retinacula cutis microenvironment; Stromal vascular fraction; Superficial microenvironment.


Conflict of interest statement

The authors declare that they have no competing interests.

Figures

Fig. 1
Fig. 1
Macroscopic aspects of human SAT. A Representative image showing the skin, sSAT and dSAT. B Dichotomy of sSAT layer revealing the superficial fascia (asterisk), a dense conjunctive tissue located between sSAT and dSAT layers. C The exposure of the sSAT layer revealed the sRC (asterisk), a loose connective tissue located inside sSAT. SAT subcutaneous adipose tissue, sRC superficial retinacula cutis, sSAT superficial SAT, dSAT deep SAT
Fig. 2
Fig. 2
Pre-adipocytes are enriched in the sSAT layer. A, B, E, F, I, J Representative images of immunofluorescence of the sSAT microenvironment showing robust blood vessels and the sRC (asterisks). C, D, G, H, K, L Representative images of the dSAT microenvironment. AD The Pref-1, a late marker for pre-adipocytes, was detected only in the sRC and blood vessels. Representative images showing the presence of the early marker for pre-adipocytes and endothelial progenitor cells CD34 (red in AD and green in EH) in the sRC, adipose tissue and blood vessels. EH CD146, an early marker of mesenchymal stromal/stem cells, is presented at blood vessels and adipose tissue. IL CD31, a late marker for endothelial cells, can be found associated with blood vessels as expected and to the sRC. J Note the presence of double positive cells (CD34/CD31, arrow). Bar size: 200 μm. Flow cytometric analysis of SVF revealed that the content of pre-adipocytes is higher in sSAT microenvironment compared with sRC (M). MO The graphs represent the mean ± standard deviation of the percentage of cells analyzed in a total of 100.000 events. ANOVA test evaluated the difference between sSAT, sRC and dSAT. p value is described below each graph. Asterisks indicate p values obtained in the post-test (*p < 0.05). SVF vascular stromal fraction, CD cluster of differentiation, SAT subcutaneous adipose tissue, sSAT subcutaneous adipose tissue, sRC retinaculum cutis, dSAT deep SAT
Fig. 3
Fig. 3
ASCs from sSAT, sRC and dSAT showed similar morphology and mesenchymal stromal/stem cells surface marker. AC ASCs from sSAT, sRC and dSAT microenvironments showed a similar fibroblastic morphology. DF Cells of each adipose tissue depot are shown in a forward versus side scatter dot plot. GI Representative histogram of the surface marker CD73; KM CD90 and OQ CD105. Blue histograms represent the unstained cells, and the purple histograms represent the stained (positive) cells. J, N, R The graphs represent the mean ± standard deviation of the percentage of positive cells. ANOVA test evaluated the difference among sSAT, sRC and dSAT microenvironments. p value is described below each graph. Count event count, ASCs adipose stromal/stem cells, CD cluster of differentiation, SAT subcutaneous adipose tissue, sSAT superficial SAT, sRC retinacula cutis superficialis, dSAT deep SAT
Fig. 4
Fig. 4
ASCs derived from sSAT microenvironment showed an accelerated adipogenesis compared with sRC and dSAT. AC Representative images of adipogenic-induced ASCs derived from sSAT, sRC and dSAT microenvironments. The intracytoplasmic lipid accumulation were revealed by Nile Red O staining (red) and the nuclei by Hoechst (blue). Bar size: 50 μm. D, E The percentage of the area of lipid accumulation and the percentage of unilocular, multilocular and undifferentiated cells are expressed in the graphs as mean ± standard deviation. ASCs derived from sSAT showed the highest area of lipid accumulation together with the highest percentage of unilocular cells. FI qPCR analysis of ASCs derived from sSAT, sRC and dSAT microenvironments revealed an upregulation of all evaluated genes in adipogenic-induced ASCs compared with non-induced. F PPARgamma; G FABP4; H ADIPOR1; I CEBPα. The gene expression of adipogenic-induced ASCs was relativized to the gene expression of non-induced (dashed line). The graphs represent the mean ± standard deviation. ANOVA test evaluated the difference between sSAT, sRC and dSAT microenvironments. p value is described below each graph. Asterisks indicate p values obtained in the post-test (*p < 0.05; **p < 0.001; ***p < 0.0005; ****p < 0.0001). ASCs adipose stromal/stem cells, SAT subcutaneous adipose tissue, sSAT superficial SAT, sRC retinacula cutis superficialis, dSAT deep SAT
Fig. 5
Fig. 5
ASCs derived from sRC microenvironment showed the highest level of the chemokine CCL5. A VEGF; B IL-6 and C CCL5. The graphs represent the mean ± standard deviation. ANOVA test evaluated the difference between sSAT, sRC and dSAT microenvironments within each non-induced and induced group. Continuous lines indicate post-test analyses within both conditions. Dashed lines indicate t test analyses, which was performed in order to verify the statistical difference between the non-induced and induced group of the sSAT, sRC and dSAT microenvironments. Asterisks indicate p values obtained in the post-test and in the post-test and in the t test (*p < 0.05; **p < 0.001). ASCs adipose stromal/stem cells, SAT subcutaneous adipose tissue; retinaculum cutis, sSAT superficial SAT, sRC superficial, dSAT deep SAT, VEGF vascular endothelial growth factor, IL Interleukin, CCL5 chemokine (C–C motif) ligand 5

Similar articles

Cited by

References

    1. Driskell RR, Jahoda CAB, Chuong CM. Watt FM, Horsley V. Defining dermal adipose tissue. Wiley Online Library. 2014;23(9):629–31. - PMC - PubMed
    1. Su X, Lyu Y, Wang W, Zhang Y, Li D, Wei S, et al. Fascia origin of adipose cells. Stem Cells. 2016;34(5):1407–1419. doi: 10.1002/stem.2338. - DOI - PubMed
    1. Abu-Hijleh MF, Roshier AL, Al-Shboul Q, Dharap AS, Harris PF. The Membranous layer of superficial fascia: evidence for its widespread distribution in the body. Surg Radiol Anat. 2006;28(6):606–619. doi: 10.1007/s00276-006-0142-8. - DOI - PubMed
    1. Lancerotto L, Stecco C, Macchi V, Porzionato A, Stecco A, De Caro R. Layers of the abdominal wall: anatomical investigation of subcutaneous tissue and superficial fascia. Surg Radiol Anat. 2011;33(10):835–842. doi: 10.1007/s00276-010-0772-8. - DOI - PubMed
    1. Herlin C, Chica-Rosa A, Subsol G, Gilles B, Macri F, Beregi JP, et al. Three-dimensional study of the skin/subcutaneous complex using in vivo whole body 3T MRI: review of the literature and confirmation of a generic pattern of organization. Surg Radiol Anat. 2015;37(7):731–741. doi: 10.1007/s00276-014-1409-0. - DOI - PubMed

Publication types

Substances