. 2021 Nov:139:76-86.
doi: 10.1016/j.molimm.2021.07.020. Epub 2021 Aug 26.

A structural-based machine learning method to classify binding affinities between TCR and peptide-MHC complexes

Affiliations

A structural-based machine learning method to classify binding affinities between TCR and peptide-MHC complexes

Kalyani Dhusia et al. Mol Immunol. 2021 Nov.

Abstract

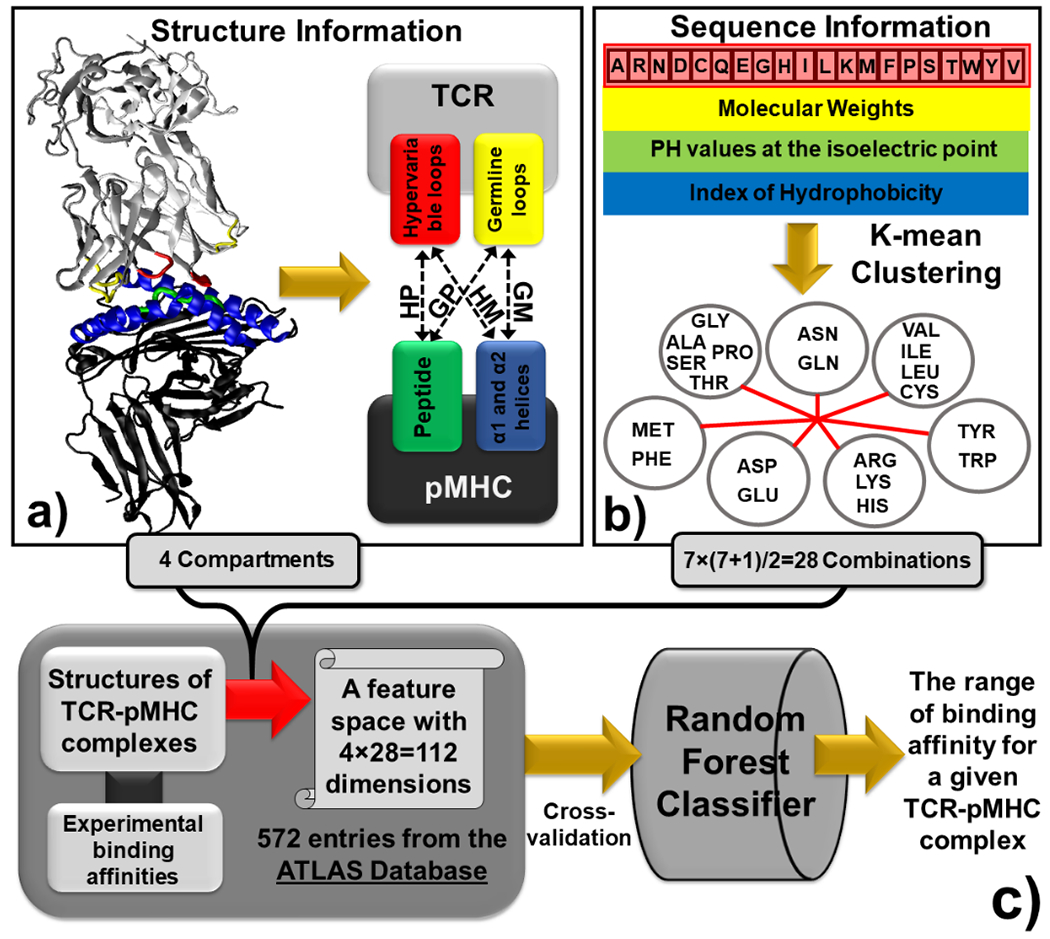
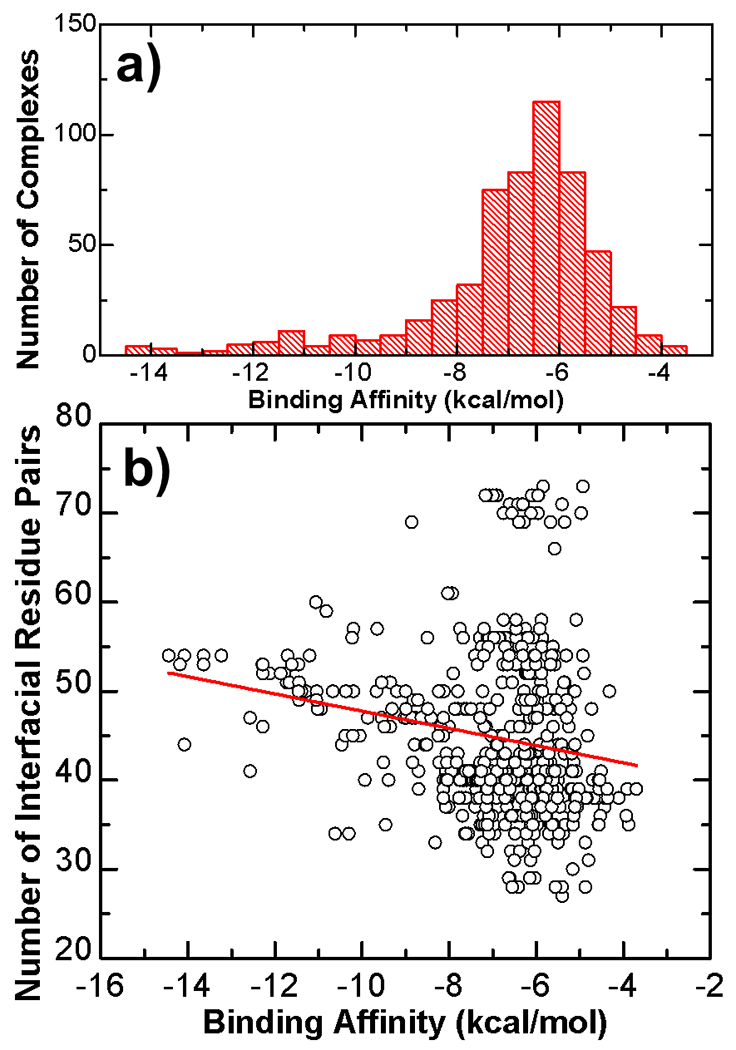
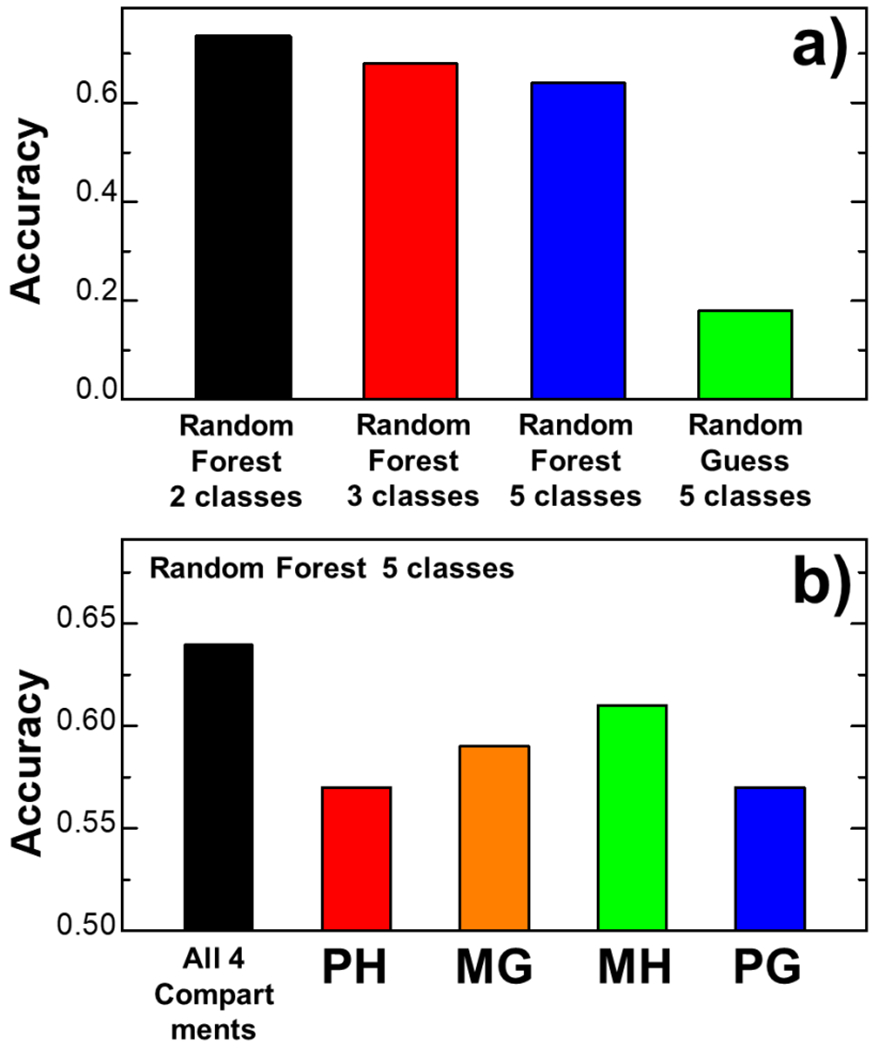
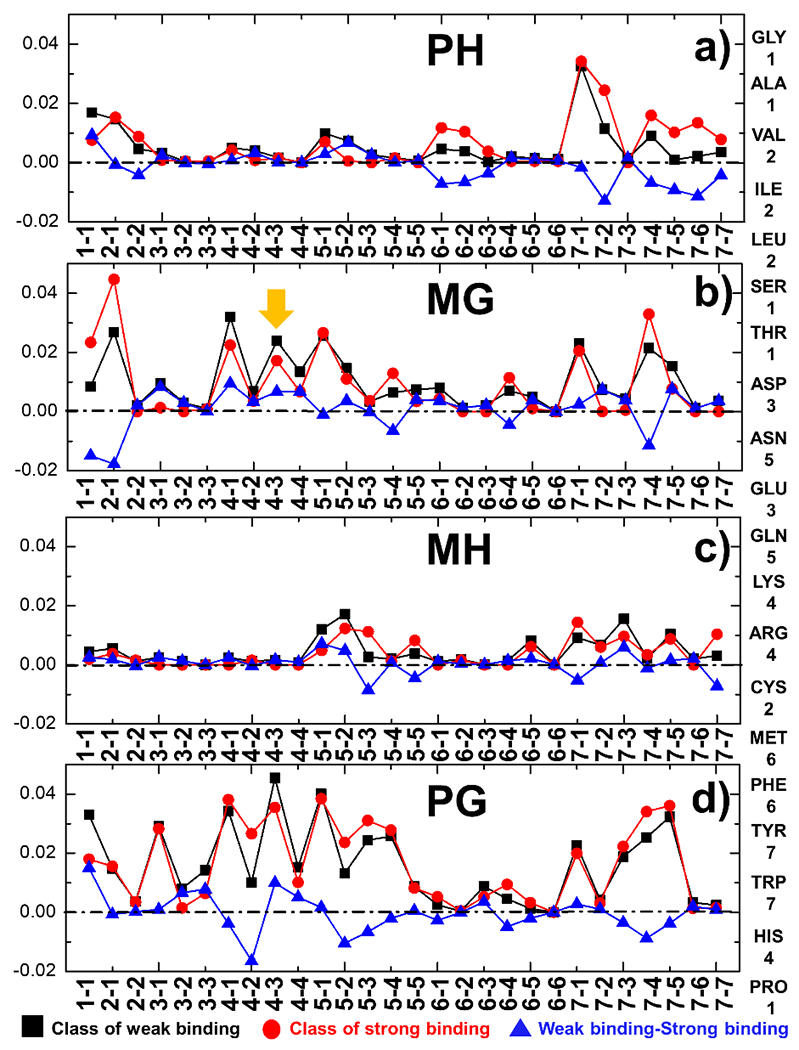
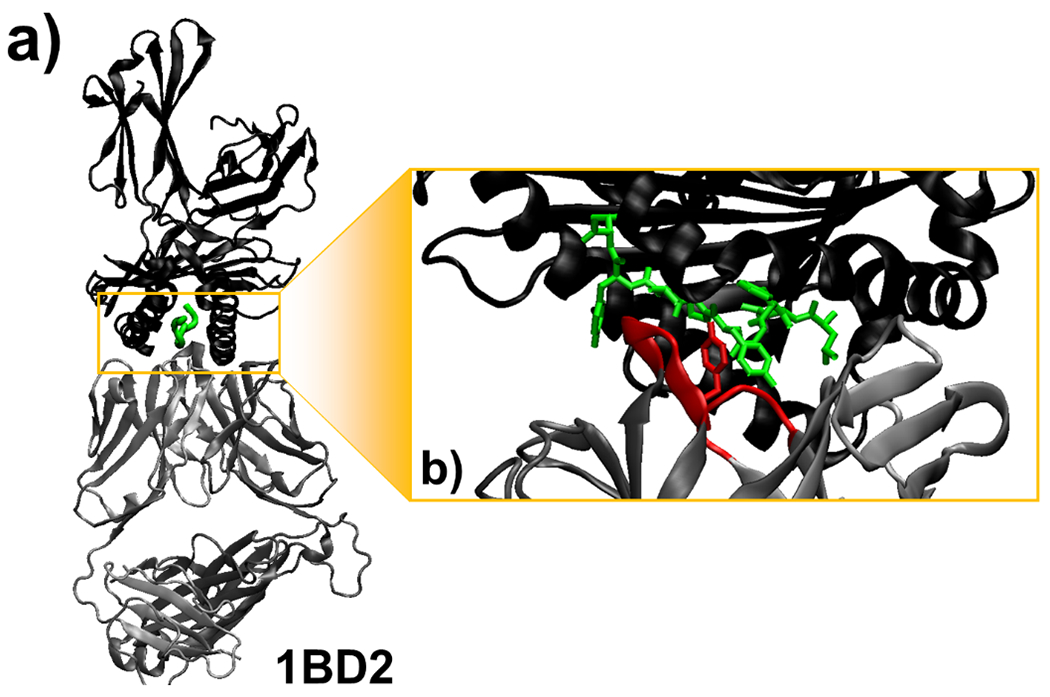
The activation of T cells is triggered by the interactions of T cell receptors (TCRs) with their epitopes, which are peptides presented by major histocompatibility complex (MHC) on the surfaces of antigen presenting cells (APC). While each TCR can only recognize a specific subset from a large repertoire of peptide-MHC (pMHC) complexes, it is very often that peptides in this subset share little sequence similarity. This is known as the specificity and cross-reactivity of T cells, respectively. The binding affinities between different types of TCRs and pMHC are the major driving force to shape this specificity and cross-reactivity in T cell recognition. The binding affinities, furthermore, are determined by the sequence and structural properties at the interfaces between TCRs and pMHC. Fortunately, a wealth of data on binding and structures of TCR-pMHC interactions becomes publicly accessible in online resources, which offers us the opportunity to develop a random forest classifier for predicting the binding affinities between TCR and pMHC based on the structure of their complexes. Specifically, the structure and sequence of a given complex were projected onto a high-dimensional feature space as the input of the classifier, which was then trained by a large-scale benchmark dataset. Based on the cross-validation results, we found that our machine learning model can predict if the binding affinity of a given TCR-pMHC complex is stronger or weaker than a predefined threshold with an overall accuracy approximately around 75 %. The significance of our prediction was estimated by statistical analysis. Moreover, more than 60 % of binding affinities in the ATLAS database can be successfully classified into groups within the range of 2 kcal/mol. Additionally, we show that TCR-pMHC complexes with strong binding affinity prefer hydrophobic interactions between amino acids with large aromatic rings instead of electrostatic interactions. Our results therefore provide insights to design engineered TCRs which enhance the specificity for their targeted epitopes. Taken together, this method can serve as a useful addition to a suite of existing approaches which study binding between TCR and pMHC.

Keywords: Binding affinity; Random forest classifier; TCR-pMHC complexes.


Conflict of interest statement

Competing financial interests: The authors declare no competing financial interests.

Figures

Figure 1:
Figure 1:
The binding interfaces between TCRs and pMHC are represented by vectors in a high-dimensional feature space. We first divided the structure of a binding interface into four compartments (a). The information of primary sequence at binding interfaces was further integrated into the feature space by coarse-graining the 20 types of amino acids into 7 groups based on the three physicochemical properties (b). Based on the construction of the feature space, all TCR-pMHC complexes in the ATLAS database were used as the benchmark to train a random forest classifier, so that the range of binding affinity for a specific TCR-pMHC complex can be predicted (c).
Figure 2:
Figure 2:
The statistical distribution of binding affinities for all 572 TCR-pMHC complexes in our benchmark dataset was plotted as histogram in (a). The average biding affinity equals −6.9 kcal/mol. Moreover, while binding affinities of around 70% entries are between −5.5 and −7.5 kcal/mol, there is a long tail on the left side of the distribution, indicating that binding affinities for a small portion of complexes are lower than −10 kcal/mol. Additionally, we also plotted the number of interfacial residue pairs for all complexes in the dataset against their corresponding values of binding affinity in (b). As labeled by the red line, there is a weak negative correlation between binding affinities and number of interfacial residue pairs. The Pearson correlation coefficient equals −0.19.
Figure 3:
Figure 3:
We first divided all complexes into two classes. The results from our cross-validation test for different classifiers are summarized in (a). The red bar shows accuracy of the classification results using the inputs with 112 dimensions. The black bar shows the results purely based on random guessing. The blue, green and yellow bars show three additional models with the same random-forest classification algorithm and cross-validation process, but different dimensions of inputs. We further adjusted the threshold of binding affinity into different values. Under each threshold value, we calculated sensitivity, specificity, precision and overall accuracy, which are illustrated in (b). Finally, the correlation between true positive rate and false positive rate under different threshold values was plotted as a receiver operating characteristic (ROC) curve in (c). The data points in the ROC curve are consistently higher than the line of no-discrimination (the dashed diagonal representing random guess), indicating the good quality of our classification results on a statistical level.
Figure 4:
Figure 4:
In addition to predict whether the binding affinity of a complex is stronger or weaker than a threshold, we further tested if our method is capable to produce more detailed classification. The results are summarized (a). The overall accuracy of the cross-validation results in which complexes were classified into two, three and five groups are shown by the black red and blue bars, respectively. The green bar represents the control study in which predictions were made purely by random guessing. Moreover, in order to test which compartment makes more contributions to binding affinity, we designed four random forest classifiers. Each classifier uses the 28 combinations of interfacial residue pairs in one of the four compartments as inputs, whereas the outputs fell into five classes. The accuracy of the cross-validation results is plotted in (b) for each classifier which compartment is indexed at the bottom.
Figure 5:
Figure 5:
The profiles of probabilities for all 28 combinations of interfacial residue pairs from the compartments “PH”, “”MG”, “MH”, and “PG” are shown in (a), (b), (c) and (d), respectively. The combinations between all 7 coarse-grained groups of amino acids are indexed along the x-axis. The relations between the 20 amino acids and the 7 coarse-grained groups that they belong to are listed on the right-hand side. The black squares and red circles indicate the probabilities of interfacial residue pairs averaged over all TCR-pMHC complexes in the classes which affinities are higher and lower than the threshold (−6.45 kcal/mol), respectively. Finally, the blue triangles correspond to the differences of probability between these two classes for a specific combination of residue pairs.
Figure 6:
Figure 6:
We found that residues which side-chains have large aromatic rings are more likely to form interactions between hypervariable loops and antigen peptides in the TCR-pMHC complexes with strong binding affinities. One example is the complex formed between human TCR B7 and the viral peptide TAX presented by class I MHC HLA-A*0201, which structure is shown (a). In the complex (PDB id 1BD2), TCR, peptide and MHC are plotted with carton representation in grey, green and black, respectively. The binding interface of the complex is further highlighted in (b), where a Tyrosine in the middle of the peptide forms a contact with another Tyrosine from one of the hypervariable loops in TCR which are colored in red.

Similar articles

Cited by

References

    1. Wieczorek M, et al., Major Histocompatibility Complex (MHC) Class I and MHC Class II Proteins: Conformational Plasticity in Antigen Presentation. Front Immunol, 2017. 8: p. 292. - PMC - PubMed
    1. Mondino A, Khoruts A, and Jenkins MK, The anatomy of T-cell activation and tolerance. Proc Natl Acad Sci U S A, 1996. 93(6): p. 2245–52. - PMC - PubMed
    1. Huang J, Meyer C, and Zhu C, T cell antigen recognition at the cell membrane. Mol Immunol, 2012. 52(3–4): p. 155–64. - PMC - PubMed
    1. Attaf M, et al., The T cell antigen receptor: the Swiss army knife of the immune system. Clin Exp Immunol, 2015. 181(1): p. 1–18. - PMC - PubMed
    1. Stone JD, Chervin AS, and Kranz DM, T-cell receptor binding affinities and kinetics: impact on T-cell activity and specificity. Immunology, 2009. 126(2): p. 165–76. - PMC - PubMed

Publication types

MeSH terms

Substances