. 2021 Dec;58(12):6092-6110.
doi: 10.1007/s12035-021-02502-x. Epub 2021 Aug 28.

Arhgap22 Disruption Leads to RAC1 Hyperactivity Affecting Hippocampal Glutamatergic Synapses and Cognition in Mice

Affiliations

Arhgap22 Disruption Leads to RAC1 Hyperactivity Affecting Hippocampal Glutamatergic Synapses and Cognition in Mice

Anna Longatti et al. Mol Neurobiol. 2021 Dec.

Abstract

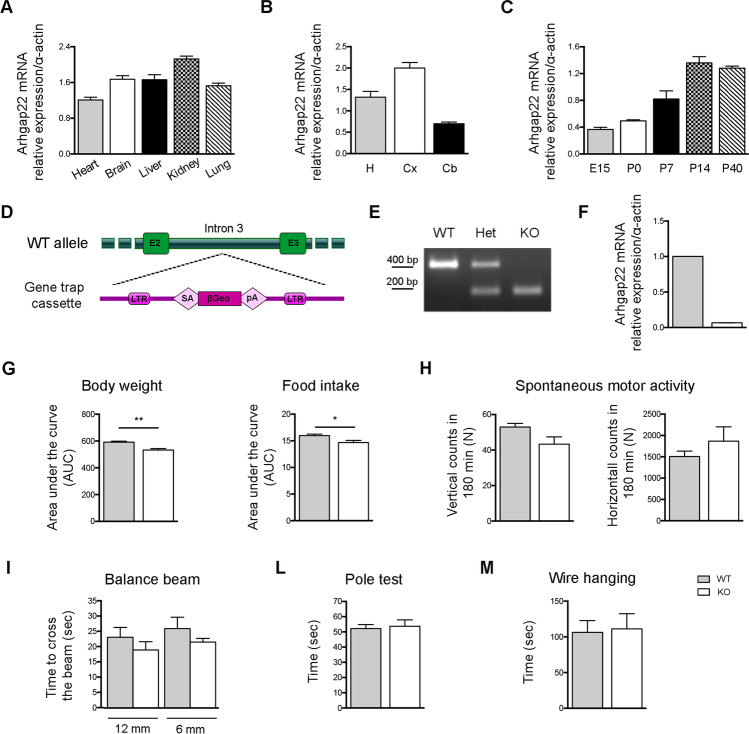
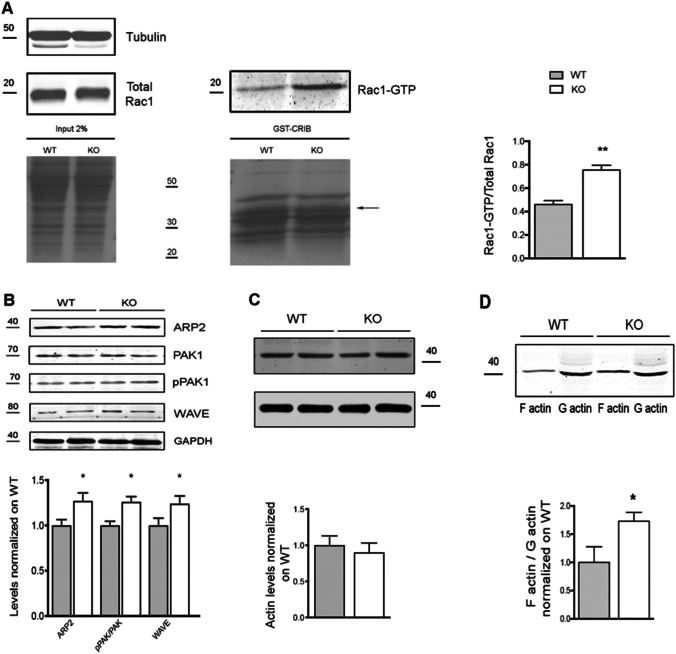
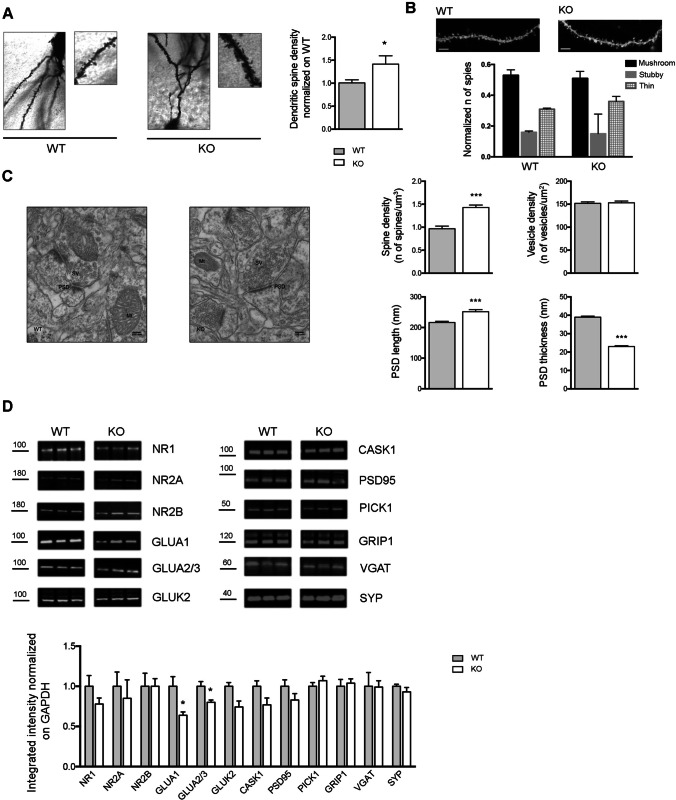
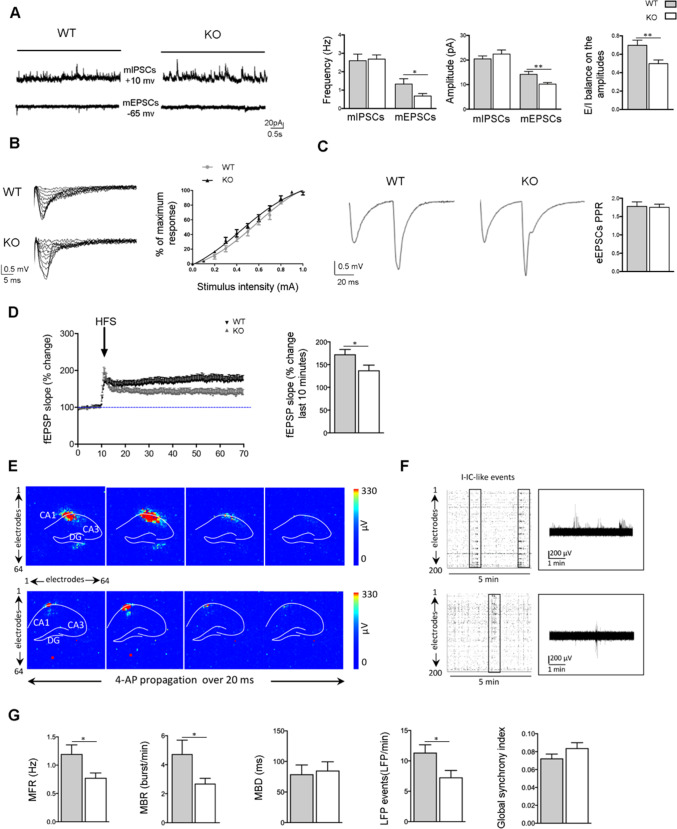
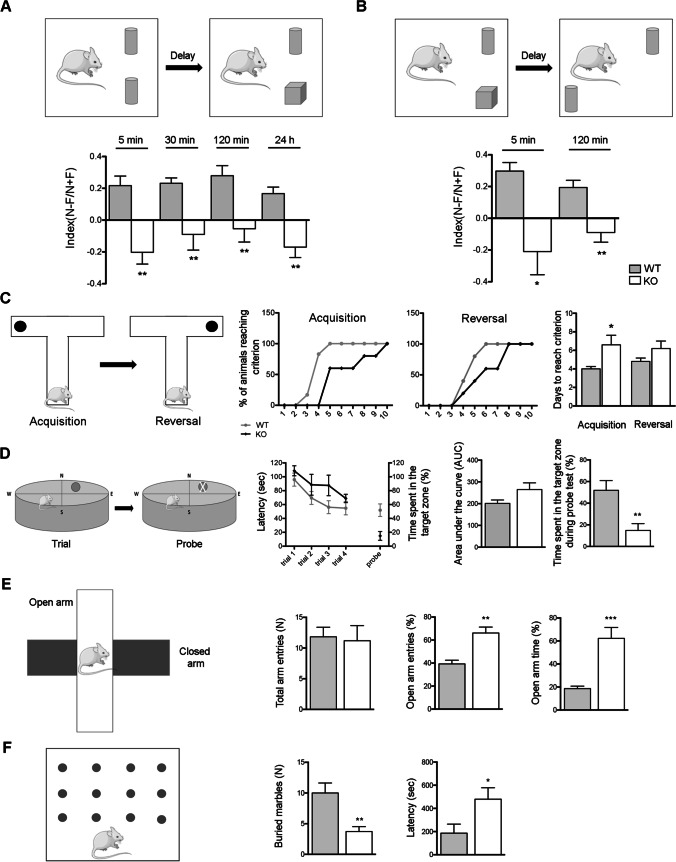
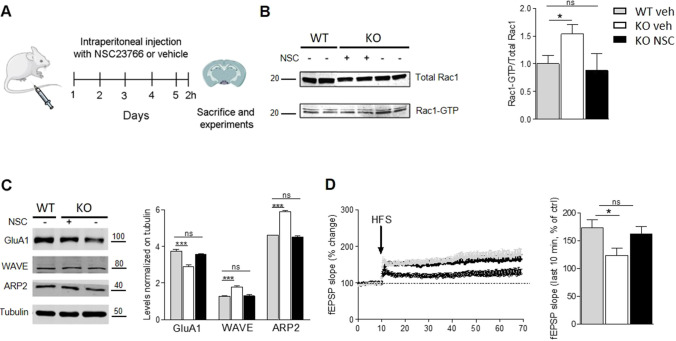
Rho GTPases are a class of G-proteins involved in several aspects of cellular biology, including the regulation of actin cytoskeleton. The most studied members of this family are RHOA and RAC1 that act in concert to regulate actin dynamics. Recently, Rho GTPases gained much attention as synaptic regulators in the mammalian central nervous system (CNS). In this context, ARHGAP22 protein has been previously shown to specifically inhibit RAC1 activity thus standing as critical cytoskeleton regulator in cancer cell models; however, whether this function is maintained in neurons in the CNS is unknown. Here, we generated a knockout animal model for arhgap22 and provided evidence of its role in the hippocampus. Specifically, we found that ARHGAP22 absence leads to RAC1 hyperactivity and to an increase in dendritic spine density with defects in synaptic structure, molecular composition, and plasticity. Furthermore, arhgap22 silencing causes impairment in cognition and a reduction in anxiety-like behavior in mice. We also found that inhibiting RAC1 restored synaptic plasticity in ARHGAP22 KO mice. All together, these results shed light on the specific role of ARHGAP22 in hippocampal excitatory synapse formation and function as well as in learning and memory behaviors.

Keywords: ARHGAP22; Dendritic spines; Hippocampus; Learning and memory; Synaptic plasticity.


Conflict of interest statement

The authors declare no competing interests.

Figures

Fig. 1
Fig. 1
ARHGAP22 expression in mouse brain and generation of arhgap22 KO mouse. A Arhgap22 mRNA relative expression in different murine organ. ARHGAP22 is particularly expressed in the kidney, liver, and brain. Values are normalized on α-actin. Error bars indicate ± s.e.m.; B Arhgap22 mRNA expression in different brain areas of adult mice. Arhgap22 transcript is expressed in the cortex and hippocampus while it is present at lower levels in the cerebellum. Values are normalized on α-actin. Error bars indicate ± s.e.m.; C Arhgap22 mRNA expression at different time-points: embryonal day 15 (E15), post-natal day 0 (P0), 7 (P7), 14 (P14), 40 (P40). The highest degree of expression is present at P14 and P40. Values are normalized on α-actin. Error bars indicate ± s.e.m. D Schematic representation of the vector used to randomly insert the gene-trap cassette into arhgap22 wild type locus (intron 3). The gene-trap cassette includes the following elements: 5′ and 3′ flanking long terminal repeats (LTR), splicing acceptor (SA), βGeo marker (βGal and Neo fusion), and a polyadenylation site. E Characteristic genotyping PCR bands of the resulting phenotypes. Arhgap22Fw/Arhgap22Rev genotyping primer pairs hybridize on intron 4 at either side of the insertion point resulting in amplification only from the wild-type allele, whereas theArhgap22/V76R pairs result in amplification from the gene-trap cassette. F Arhgap22 mRNA expression in WT and KO mice brain. KO mice show the almost complete absence of arhgap22 transcript. Values are normalized on α-actin. Error bars indicate ± s.e.m. Arhgap22 WT and KO mice have been tested to assess their general health state. G KO mice present decrease in body weight and food intake. Arhgap22 WT e KO mice have been tested to evaluate also general motor functions. No differences were detected in spontaneous motor activity (H), balance beam (I), pole test (L), and wire hanging (M)
Fig. 2
Fig. 2
Arhgap22 KO mice present hyper-active RAC1 pathway in the brain. A Activated RAC1 GST-pulldown on hippocampal and cortical lysates. Red ponceau show the amount of protein in the lysates and GST-CRIB beads used for the experiment. Western blot of total RAC1 (total Rac1) and active RAC1 (Rac1-GTP) are shown. Tubulin was used as internal control (A, top). (A, right histogram) Quantification of the level of active Rac1 normalized on total Rac1 protein. KO animals present elevated level of Rac1-GTP. B Western blot analyses on hippocampal and cortical lysates of WT and KO mice. Levels of RAC1 downstream effectors ARP2/3, WAVE, PAK1, and pPAK1 have been quantified and normalized on GAPDH (left panel). ARP2/3 and WAVE protein levels and the ratio between the active (phosphorylated) and total PAK1 are increased in KO mice compared to WT (right panel). Error bars indicate ± s.e.m. C Analyses of actin levels in cortical and hippocampal lysates from Arhgap22 KO and WT mice. Representative Western blot image (left) and quantification (right) indicate no changes between genotypes. Error bars indicate ± s.e.m. D Analyses of filamentous (F) and globular actin (G) ratio in cortical and hippocampal lysates from Arhgap22 KO and WT mice. Representative Western blot image (left) and quantification (right) indicate that KO animals presented higher F-actin/G-actin ratio compared to WT. Error bars indicate ± s.e.m
Fig. 3
Fig. 3
Arhgap22 KO mice present increased spine density and altered synaptic molecular composition in hippocampus. A Representative Golgi staining images of hippocampal pyramidal neurons and high magnification of dendrites segments from WT (left) and KO (right) mice. Dendritic spine density measurement indicates increased number of dendritic spines in KO mice compared to WT mice. B Representative images of dendrites segments from WT (left) and KO (right) hippocampal neurons after DiI staining. Scale bar, 5 μm. No differences in spine morphology between genotypes are detectable. C Electron micrographs of asymmetrical synapses of the hippocampal CA1 regions of WT (left) and KO (right) mice. Scale bar, 100 nm. Analyses confirm increased spine density in KO mice and reveal alterations in PSD length and thickness. No pre-synaptic ultrastructural defects are detectable. The total surface area analyzed with stereology was 350 µm2 for each animal. D Representative Western blot images (top) and histograms (bottom) showing the quantification of synaptic markers on crude hippocampal and cortical synaptosomes from adult arhgap22 WT and KO mice. Densitometry analyses performed with Li-Cor technology show that GLUA1 and GLUA2/3 subunits are significantly reduced in arhgap22 KO mice compared to WT
Fig. 4
Fig. 4
Arhgap22 KO animals present altered excitation/inhibition balance, impaired LTP, and network activity. A Representative traces and quantification of mIPSCs (up) and mEPSCs (down) recorded from CA1 hippocampal pyramidal neurons from arhgap22 WT and KO mice. Quantification (right panel) shows reduced frequency and amplitude of mEPSCs in KO animals while no alterations have been found for mIPSCs. These data reflect the impaired E/I balance in arhgap22 KO mouse. B Representative traces of fEPSPs recorded from hippocampal CA1 of arhgap22 WT and KO mice and quantification of the input/output relationship. C Representative traces and quantification of paired pulse ratio experiments showing no differences in the glutamate release probability between genotypes. D fEPSPs slope quantification before and after HFS shows impairment in LTP at Schaffer’s collaterals-CA1 synapses in arhgap22 KO mice compared to WT. E Time laps representations of propagating events from representative WT (top) and Arhgap22 KO mice (bottom) slices upon 4AP (100 µM) chemical manipulation. Signals from 64 × 64-electrode array are represented in a false color map where each pixel shows the maximal signal variation of each microelectrode (µV). F 5 min raster plots of network hippocampal activity recorded by 200 channels from WT and KO mice. Each dot represents a detected spike, and each line is an electrode. Interictal-like activity is highlighted in black rectangles. G Quantification of mean firing rate (MFR), mean bursting rate (MBR), mean burst duration (MBD), LFP’s events, and Global Synchrony index for Arhgap22 WT, and KO mice are shown
Fig. 5
Fig. 5
Arhgap22 KO mice present learning/memory defects and reduced anxiety-like behaviors. A, B Representative scheme of the NOR test (A, top) and SOR test (B, top) are shown. Arhgap22 KO mice present altered capability for episodic (novel object) and spatial memory (spatial object recognition). C Schematic representation of T-Maze test is shown. As indicated by quantification, arhgap22 KO mice present a significant impairment during T-Maze acquisition phase but not in the reversal phase. D Scheme of Morris Water maze test during trial and probe phase. Arhgap22 KO mice spent more time trying to reach the target zone during the trial phase. E Representative scheme of elevated plus maze test (left). Time spent in the open arm and number of entries in the open arm indicate that KO mice are less anxious than WT mice as shown by quantification. F Representative scheme of marble-burying test (left). Marble-burying test presents reduced number of marbles buried and an increase latency to the first burial
Fig. 6
Fig. 6
RAC1 inhibition by NSC23766 ameliorates the synaptic phenotype in Arhgap22 KO mice. A Representative scheme of pharmacologic treatment. B Western blot (left) and quantification (right) showing the normalization of RAC1 activity after NSC treatment in KO mice. C Western blot (left) and quantification (right) showing the normalization of GluA1, WAVE, and ARP2 protein expression after NSC treatment in KO mice. D Quantification of LTP induction upon RAC1 activity normalization showing the full recovery of synaptic plasticity in KO mice

Similar articles

Cited by

References

    1. Zamboni V, Jones R, Umbach A, et al. (2018) Rho gtpases in intellectual disability: from genetics to therapeutic opportunities. Int J Mol Sci. 10.3390/ijms19061821 - PMC - PubMed
    1. Sit S-T, Manser E. Rho GTPases and their role in organizing the actin cytoskeleton. J Cell Sci. 2011;124:679–683. doi: 10.1242/jcs.064964. - DOI - PubMed
    1. Ba W, Nadif Kasri N. RhoGTPases at the synapse: an embarrassment of choice. Small GTPases. 2017;8:106–113. doi: 10.1080/21541248.2016.1206352. - DOI - PMC - PubMed
    1. Burridge K, Wennerberg K. Rho and Rac take center stage. Cell. 2004;116:167–179. doi: 10.1016/s0092-8674(04)00003-0. - DOI - PubMed
    1. Guilluy C, Garcia-Mata R, Burridge K. Rho protein crosstalk: another social network? Trends Cell Biol. 2011;21:718–726. doi: 10.1016/j.tcb.2011.08.002. - DOI - PMC - PubMed

MeSH terms