

Chitosan-Poly(Acrylic Acid) Nanoparticles Loaded with R848 and MnCl2 Inhibit Melanoma via Regulating Macrophage Polarization and Dendritic Cell Maturation
- PMID: 34456564
- PMCID: PMC8387326
- DOI: 10.2147/IJN.S318363
Chitosan-Poly(Acrylic Acid) Nanoparticles Loaded with R848 and MnCl2 Inhibit Melanoma via Regulating Macrophage Polarization and Dendritic Cell Maturation
Abstract
Purpose: Since immune cells in the tumor microenvironment (TME) can affect the development and progression of tumors, strategies modulating immune cells are considered to have an important therapeutic effect. As a TLR7/8 agonist, R848 effectively activates the innate immune cells to exert an anti-tumor effect. Mn2+ has been reported to strongly promote the maturation of antigen-presenting cells (APCs), thereby enhancing the cytotoxicity of CD8+ T cells. Thus, we tried to investigate whether chitosan-poly(acrylic acid) nanoparticles (CS-PAA NPs) loaded with R848 and MnCl2 (R-M@CS-PAA NPs) could exert an anti-tumor effect by regulating the function of immune cells.
Methods: R-M@CS-PAA NPs were prepared, and their basic characteristics, anti-tumor effect, and potential mechanisms were explored both in vitro and in vivo.
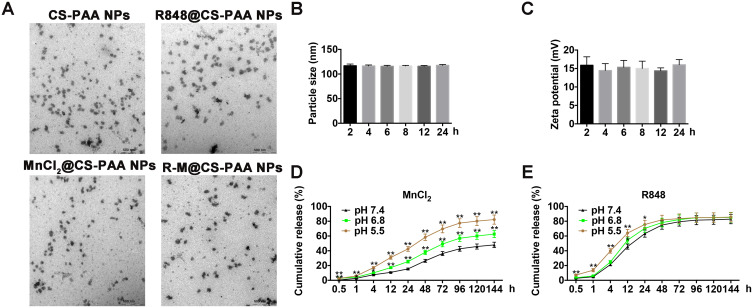
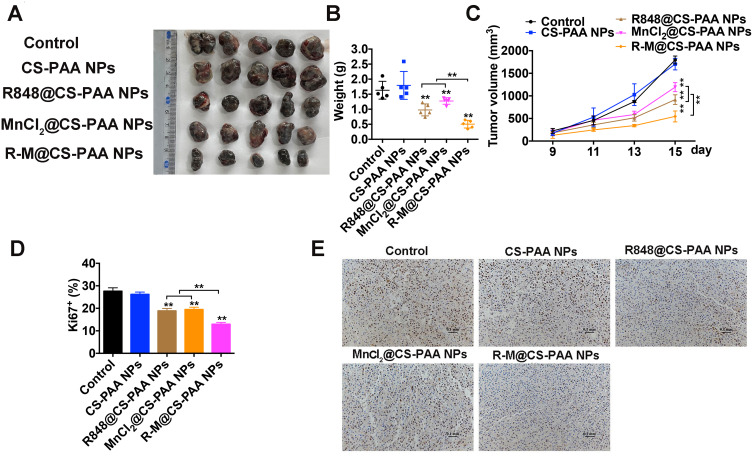
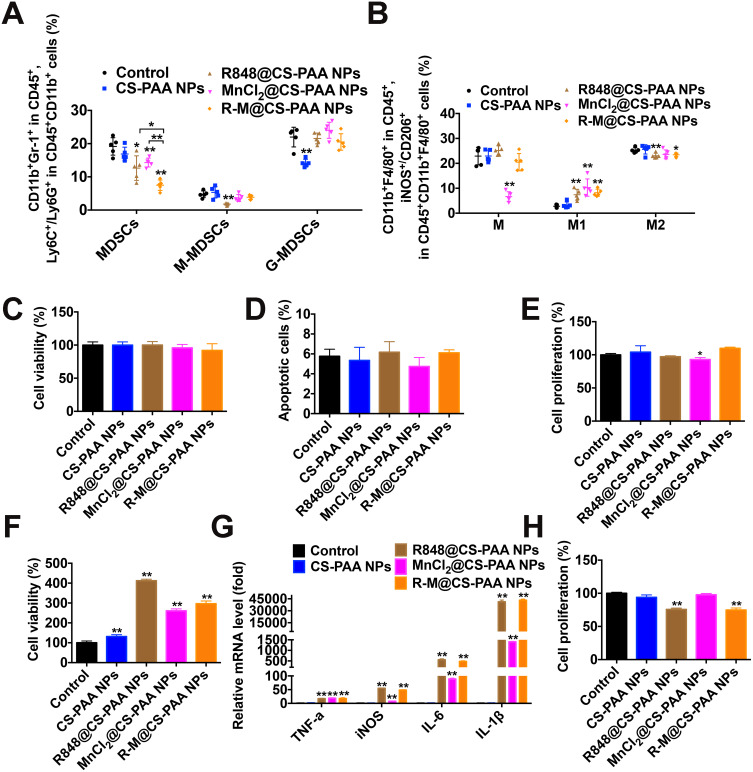
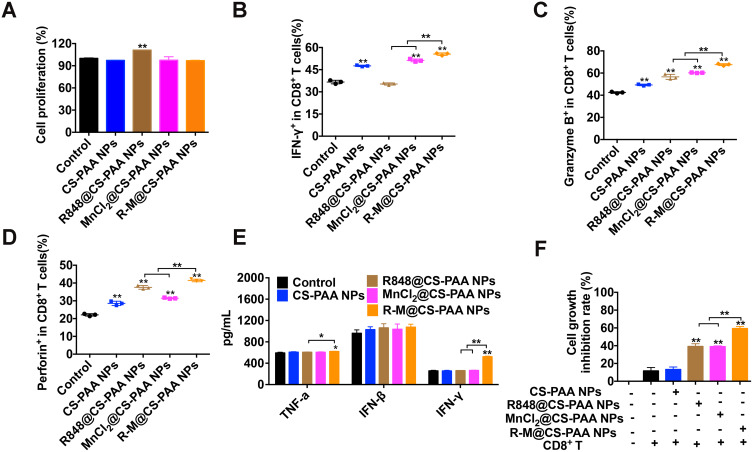
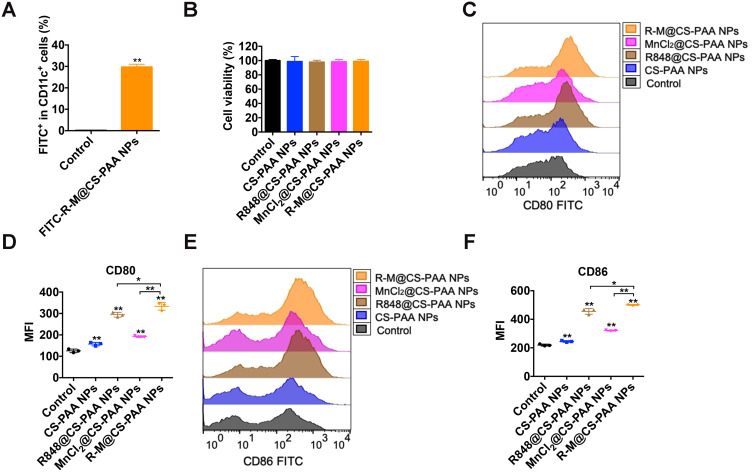
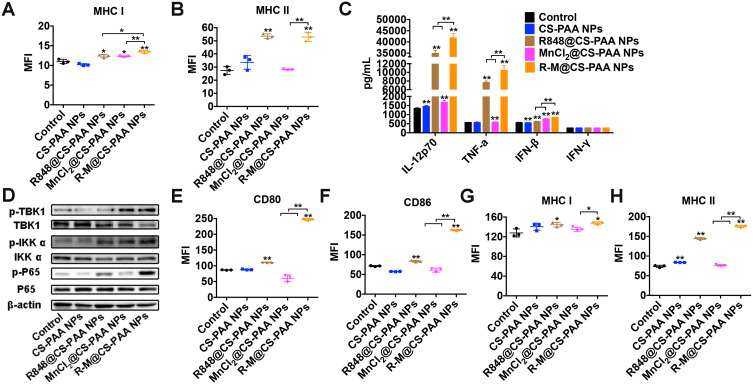
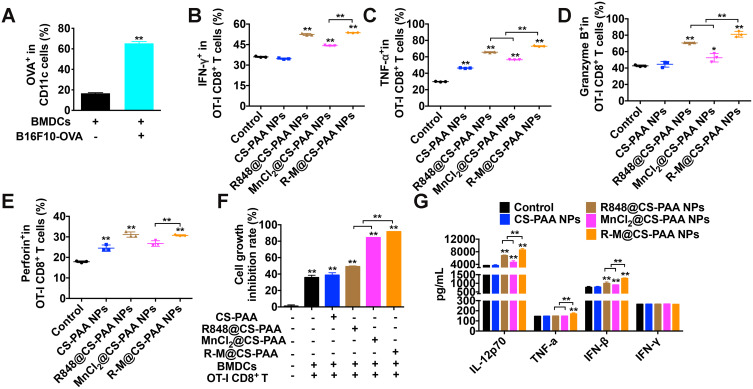
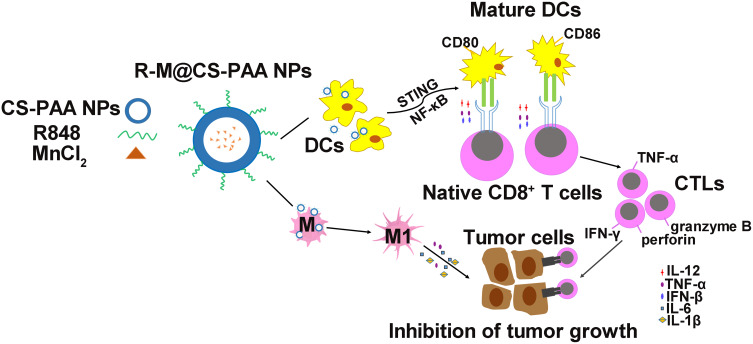
Results: R-M@CS-PAA NPs easily released MnCl2 and R848 at low pH. In B16F10 mouse melanoma model, R-M@CS-PAA NPs exerted the most significant anti-melanoma effect compared with the control group and CS-PAA NPs loaded with R848 or MnCl2 alone. FITC-labeled R-M@CS-PAA NPs were displayed to be accumulated at the tumor site. R-M@CS-PAA NPs significantly increased the infiltration of M1 macrophages and CD8+ T cells but reduced the number of suppressive immune cells in the TME. Moreover, in vitro experiments showed that R-M@CS-PAA NPs polarized macrophages into the M1 phenotype to inhibit the proliferation of B16F10 cells. R-M@CS-PAA NPs also enhanced the killing function of CD8+ T cells to B16F10 cells. Of note, R-M@CS-PAA NPs not only promoted the maturation of APCs such as dendritic cells and macrophages by STING and NF-кB pathways, but also enhanced the ability of dendritic cells to present ovalbumin to OT-I CD8+ T cells to enhance the cytotoxicity of OT-I CD8+ T cells to ovalbumin-expressing B16F10 cells.
Conclusion: These data indicate that the administration of R-M@CS-PAA NPs is an effective therapeutic strategy against melanoma.
Keywords: NF-кB; STING; T cell; antigen-presenting cell.
© 2021 Liu et al.
Conflict of interest statement
The authors report no conflicts of interest in this work.
Figures


Similar articles
-
Thermosensitive Resiquimod-Loaded Lipid Nanoparticles Promote the Polarization of Tumor-Associated Macrophages to Enhance Bladder Cancer Immunotherapy.ACS Nano. 2025 Jun 3;19(21):19599-19621. doi: 10.1021/acsnano.4c17444. Epub 2025 May 17. ACS Nano. 2025. PMID: 40380939
-
Pro-inflammatory chitosan/poly(γ-glutamic acid) nanoparticles modulate human antigen-presenting cells phenotype and revert their pro-invasive capacity.Acta Biomater. 2017 Nov;63:96-109. doi: 10.1016/j.actbio.2017.09.016. Epub 2017 Sep 14. Acta Biomater. 2017. PMID: 28919508
-
T-cell engaging poly(lactic-co-glycolic acid) nanoparticles as a modular platform to induce a potent cytotoxic immunogenic response against PD-L1 overexpressing cancer.Biomaterials. 2022 Dec;291:121911. doi: 10.1016/j.biomaterials.2022.121911. Epub 2022 Nov 12. Biomaterials. 2022. PMID: 36399833
-
The application of nanoparticles in cancer immunotherapy: Targeting tumor microenvironment.Bioact Mater. 2020 Dec 26;6(7):1973-1987. doi: 10.1016/j.bioactmat.2020.12.010. eCollection 2021 Jul. Bioact Mater. 2020. PMID: 33426371 Free PMC article. Review.
-
Nanoparticles in tumor microenvironment remodeling and cancer immunotherapy.J Hematol Oncol. 2024 Apr 2;17(1):16. doi: 10.1186/s13045-024-01535-8. J Hematol Oncol. 2024. PMID: 38566199 Free PMC article. Review.
Cited by
-
Manganese and IL-12 treatment alters the ovarian tumor microenvironment.Aging (Albany NY). 2024 Jan 3;16(1):191-206. doi: 10.18632/aging.205361. Epub 2024 Jan 3. Aging (Albany NY). 2024. PMID: 38175694 Free PMC article.
-
Nanoparticle-Based Treatment Approaches for Skin Cancer: A Systematic Review.Curr Oncol. 2023 Jul 25;30(8):7112-7131. doi: 10.3390/curroncol30080516. Curr Oncol. 2023. PMID: 37622997 Free PMC article.
-
Thermosensitive Resiquimod-Loaded Lipid Nanoparticles Promote the Polarization of Tumor-Associated Macrophages to Enhance Bladder Cancer Immunotherapy.ACS Nano. 2025 Jun 3;19(21):19599-19621. doi: 10.1021/acsnano.4c17444. Epub 2025 May 17. ACS Nano. 2025. PMID: 40380939
-
Polymeric nanocarrier via metabolism regulation mediates immunogenic cell death with spatiotemporal orchestration for cancer immunotherapy.Nat Commun. 2024 Oct 4;15(1):8586. doi: 10.1038/s41467-024-53010-0. Nat Commun. 2024. PMID: 39362879 Free PMC article.
-
Advances in Chitosan-based Drug Delivery Systems in Melanoma: A Narrative Review.Curr Med Chem. 2024;31(23):3488-3501. doi: 10.2174/0929867330666230518143654. Curr Med Chem. 2024. PMID: 37202890 Review.
References
MeSH terms
Substances
LinkOut - more resources
Full Text Sources
Medical
Research Materials
Miscellaneous
