

Identification of Dysregulated Mechanisms and Potential Biomarkers in Ischemic Stroke Onset
- PMID: 34456585
- PMCID: PMC8390889
- DOI: 10.2147/IJGM.S327594
Identification of Dysregulated Mechanisms and Potential Biomarkers in Ischemic Stroke Onset
Abstract
Objective: Ischemic stroke (IS) is a major cause of severe disability. This study aimed to identify potential biomarkers closely related to IS diagnosis and treatment.
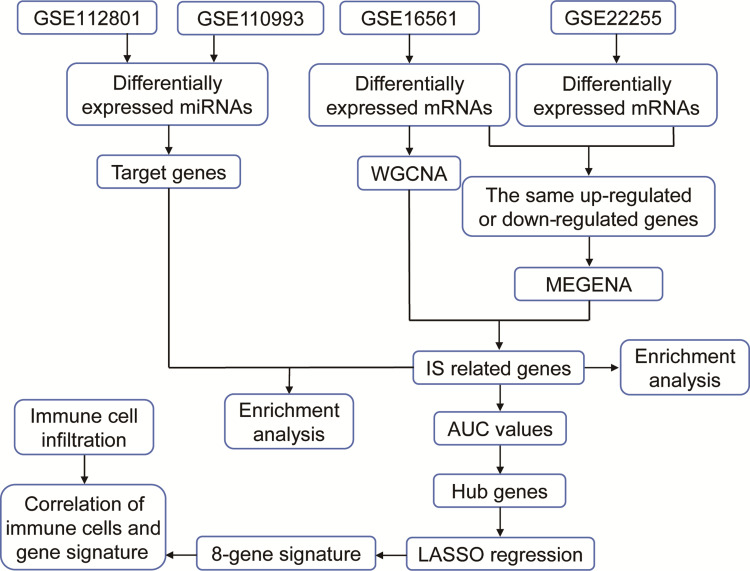
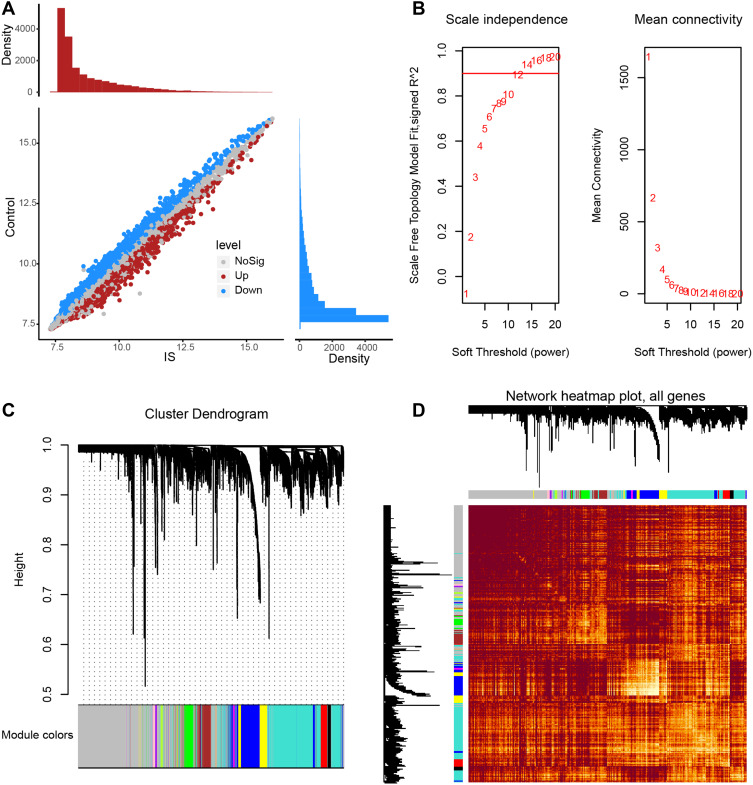
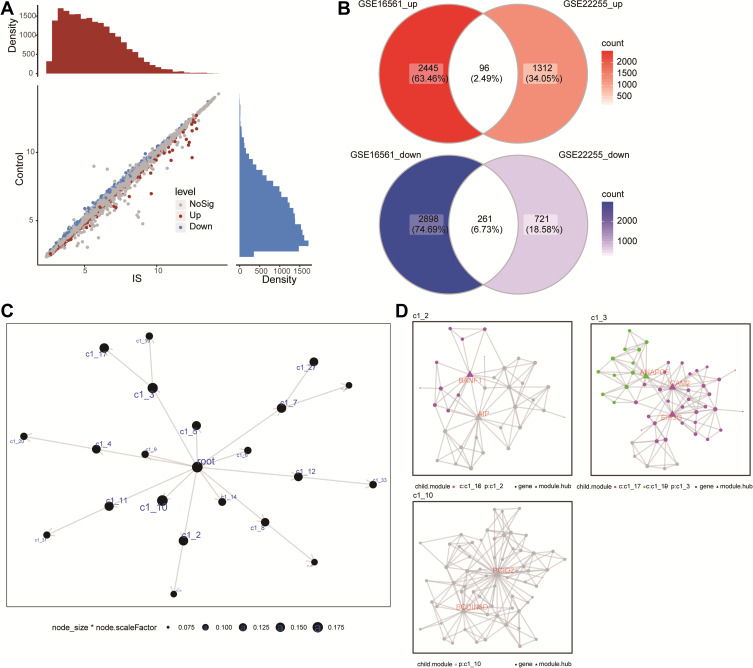
Methods: Profiles of gene expression were obtained from datasets GSE16561, GSE22255, GSE112801 and GSE110993. Differentially expressed mRNAs between IS and controls were then subjected to weighted gene co-expression network analysis as well as multiscale embedded gene co-expression network analysis. The intersection of the two sets of module genes was subjected to analyses of functional enrichment and of microRNAs (miRNAs) regulation. Then, the area under receiver operating characteristic curves (AUC) was calculated to assess the ability of genes to discriminate IS patients from controls. IS diagnostic signatures were constructed using least absolute shrinkage and selection operator regression.
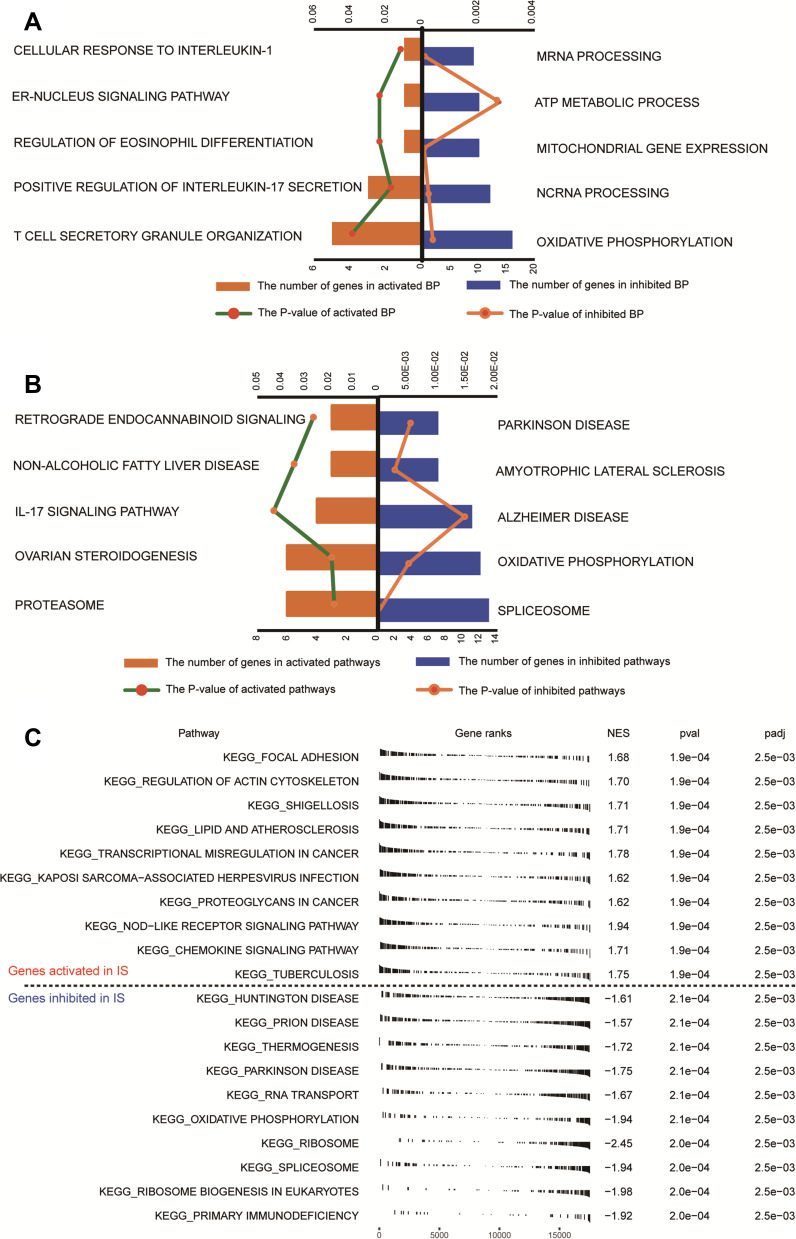
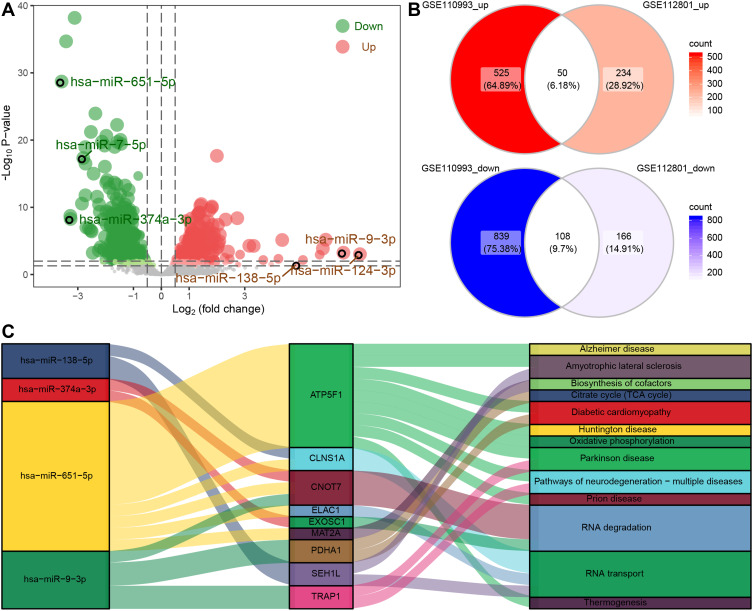
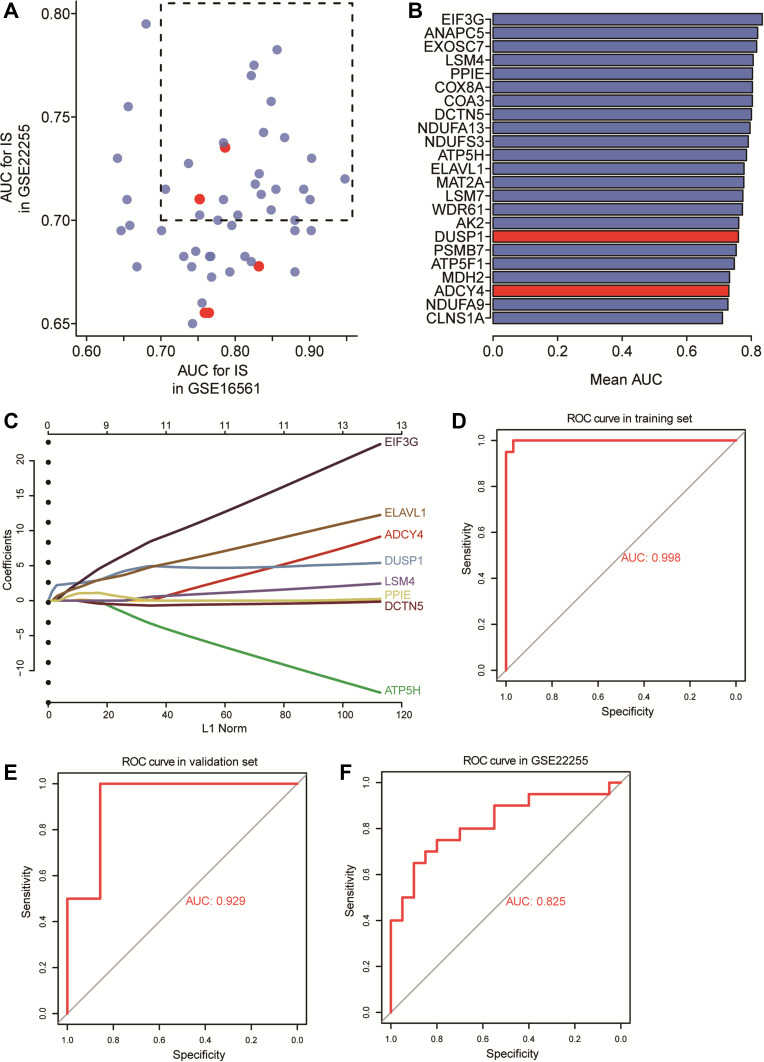
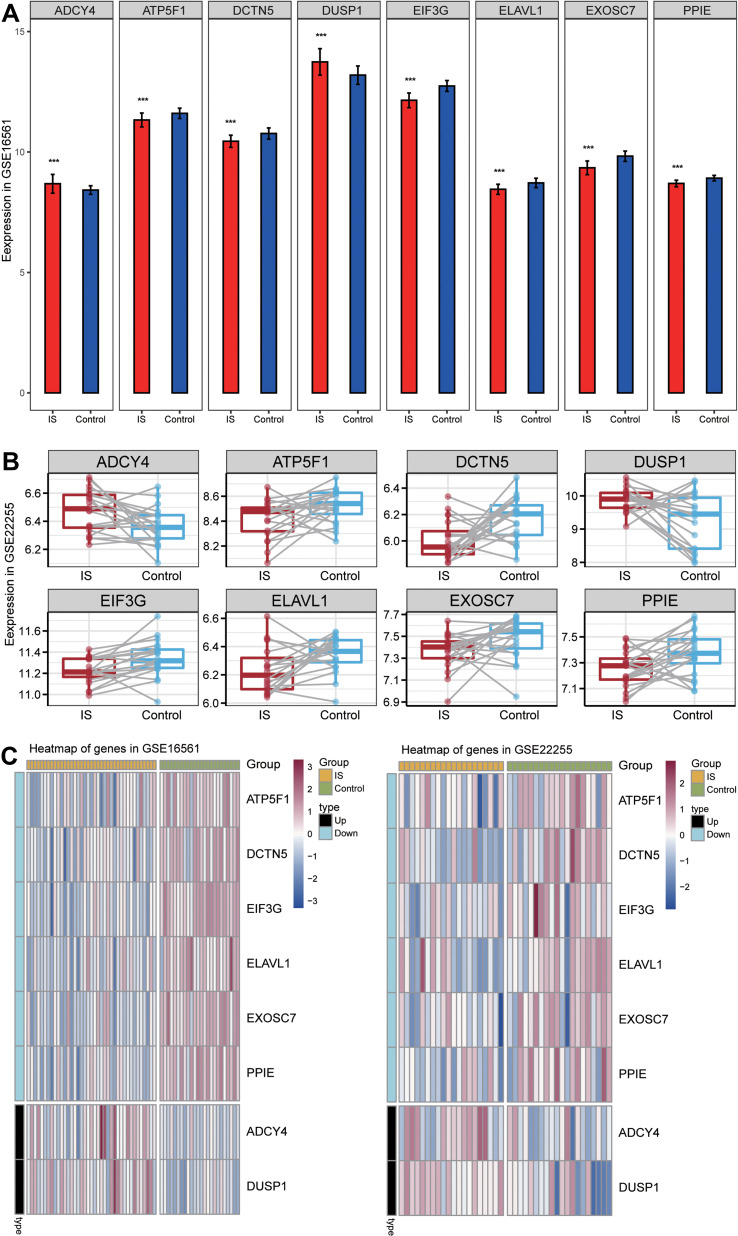
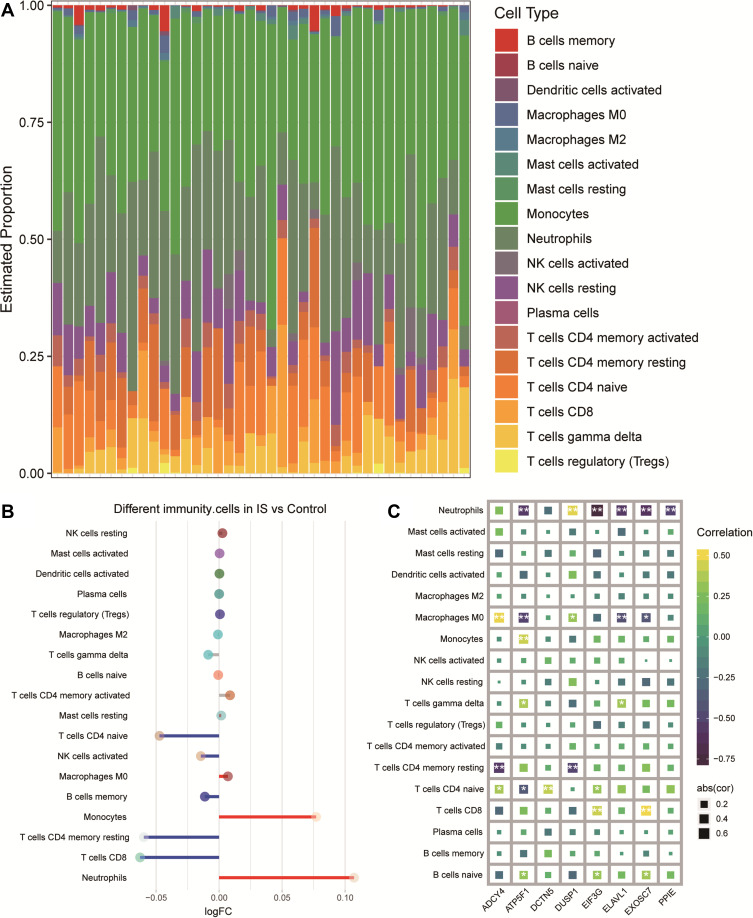
Results: A total of 234 common co-expression network genes were found to be potentially associated with IS. Enrichment analysis found that these genes were mainly associated with inflammation and immune response. The aberrantly expressed miRNAs (hsa-miR-651-5p, hsa-miR-138-5p, hsa-miR-9-3p and hsa-miR-374a-3p) in IS had regulatory effects on IS-related genes and were involved in brain-related diseases. We used the criterion AUC > 0.7 to screen out 23 hub genes from IS-related genes in the GSE16561 and GSE22255 datasets. We obtained an 8-gene signature (ADCY4, DUSP1, ATP5F1, DCTN5, EIF3G, ELAVL1, EXOSC7 and PPIE) from the training set of GSE16561 dataset, which we confirmed in the validation set of GSE16561 dataset and in the GSE22255 dataset. The genes in this signature were highly accurate for diagnosing IS. In addition, the 8-gene signature significantly correlated with infiltration by immune cells.
Conclusion: These findings provide new clues to molecular mechanisms and treatment targets in IS. The genes in the signature may be candidate markers and potential gene targets for treatments.
Keywords: bioinformatics analysis; candidate markers; immune inflammatory response; ischemic stroke; miRNAs.
© 2021 Feng et al.
Conflict of interest statement
The authors report no conflicts of interest related to this work.
Figures
Similar articles
-
Investigating the AC079305/DUSP1 Axis as Oxidative Stress-Related Signatures and Immune Infiltration Characteristics in Ischemic Stroke.Oxid Med Cell Longev. 2022 Jun 14;2022:8432352. doi: 10.1155/2022/8432352. eCollection 2022. Oxid Med Cell Longev. 2022. PMID: 35746962 Free PMC article.
-
Uncovering the Potential Differentially Expressed miRNAs and mRNAs in Ischemic Stroke Based on Integrated Analysis in the Gene Expression Omnibus Database.Eur Neurol. 2020;83(4):404-414. doi: 10.1159/000507364. Epub 2020 Sep 9. Eur Neurol. 2020. PMID: 32906114
-
Integrated Analysis of Competitive Endogenous RNA Networks in Acute Ischemic Stroke.Front Genet. 2022 Mar 25;13:833545. doi: 10.3389/fgene.2022.833545. eCollection 2022. Front Genet. 2022. PMID: 35401659 Free PMC article.
-
Identification of hypoxia- and immune-related biomarkers in patients with ischemic stroke.Heliyon. 2024 Feb 7;10(4):e25866. doi: 10.1016/j.heliyon.2024.e25866. eCollection 2024 Feb 29. Heliyon. 2024. PMID: 38384585 Free PMC article.
-
Identification of immune-related biomarkers co-occurring in acute ischemic stroke and acute myocardial infarction.Front Neurol. 2023 Aug 17;14:1207795. doi: 10.3389/fneur.2023.1207795. eCollection 2023. Front Neurol. 2023. PMID: 37662030 Free PMC article.
Cited by
-
Prediction of Mechanosensitive Genes in Vascular Endothelial Cells Under High Wall Shear Stress.Front Genet. 2022 Jan 11;12:796812. doi: 10.3389/fgene.2021.796812. eCollection 2021. Front Genet. 2022. PMID: 35087573 Free PMC article.
-
Temporal expression profiles of microRNAs associated with acute phase of brain ischemia in gerbil hippocampus.Heliyon. 2024 Mar 29;10(7):e28875. doi: 10.1016/j.heliyon.2024.e28875. eCollection 2024 Apr 15. Heliyon. 2024. PMID: 38576576 Free PMC article.
-
EGFR-Mutant Lung Adenocarcinoma Cell-Derived Exosomal miR-651-5p Induces CD8+ T Cell Apoptosis via Downregulating BCL2 Expression.Biomedicines. 2025 Feb 15;13(2):482. doi: 10.3390/biomedicines13020482. Biomedicines. 2025. PMID: 40002895 Free PMC article.
-
Identifying Key Biomarkers and Immune Infiltration in Female Patients with Ischemic Stroke Based on Weighted Gene Co-Expression Network Analysis.Neural Plast. 2022 Apr 8;2022:5379876. doi: 10.1155/2022/5379876. eCollection 2022. Neural Plast. 2022. PMID: 35432523 Free PMC article.
-
Role and Dysregulation of miRNA in Patients with Parkinson's Disease.Int J Mol Sci. 2022 Dec 31;24(1):712. doi: 10.3390/ijms24010712. Int J Mol Sci. 2022. PMID: 36614153 Free PMC article.
References
LinkOut - more resources
Full Text Sources
Miscellaneous
