. 2021 Aug 11:15:726605.
doi: 10.3389/fncel.2021.726605. eCollection 2021.

Adenylate Cyclase 1 Links Calcium Signaling to CFTR-Dependent Cytosolic Chloride Elevations in Chick Amacrine Cells

Affiliations

Adenylate Cyclase 1 Links Calcium Signaling to CFTR-Dependent Cytosolic Chloride Elevations in Chick Amacrine Cells

Li Zhong et al. Front Cell Neurosci. .

Abstract

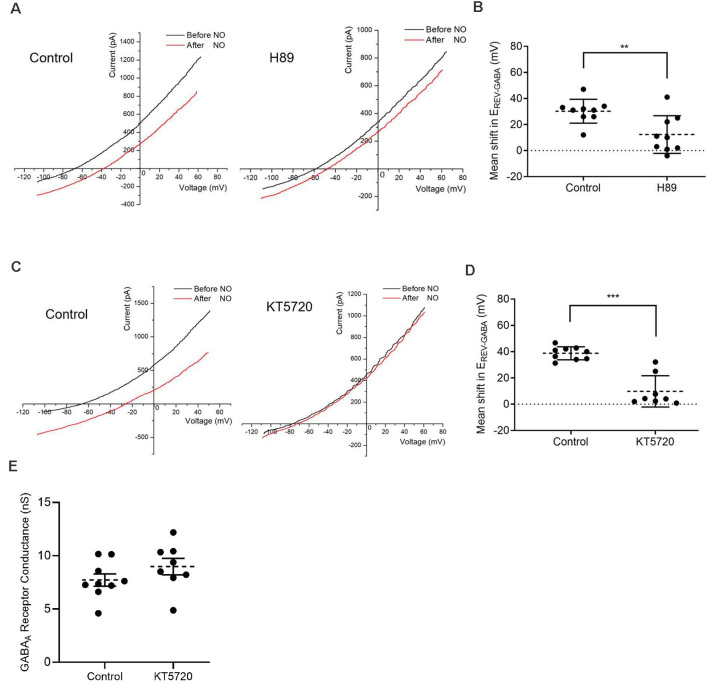
The strength and sign of synapses involving ionotropic GABA and glycine receptors are dependent upon the Cl- gradient. We have shown that nitric oxide (NO) elicits the release of Cl- from internal acidic stores in retinal amacrine cells (ACs); temporarily altering the Cl- gradient and the strength or even sign of incoming GABAergic or glycinergic synapses. The underlying mechanism for this effect of NO requires the cystic fibrosis transmembrane regulator (CFTR) but the link between NO and CFTR activation has not been determined. Here, we test the hypothesis that NO-dependent Ca2+ elevations activate the Ca2+-dependent adenylate cyclase 1 (AdC1) leading to activation of protein kinase A (PKA) whose activity is known to open the CFTR channel. Using the reversal potential of GABA-gated currents to monitor cytosolic Cl-, we established the requirement for Ca2+ elevations. Inhibitors of AdC1 suppressed the NO-dependent increases in cytosolic Cl- whereas inhibitors of other AdC subtypes were ineffective suggesting that AdC1 is involved. Inhibition of PKA also suppressed the action of NO. To address the sufficiency of this pathway in linking NO to elevations in cytosolic Cl-, GABA-gated currents were measured under internal and external zero Cl- conditions to isolate the internal Cl- store. Activators of the cAMP pathway were less effective than NO in producing GABA-gated currents. However, coupling the cAMP pathway activators with the release of Ca2+ from stores produced GABA-gated currents indistinguishable from those stimulated with NO. Together, these results demonstrate that cytosolic Ca2+ links NO to the activation of CFTR and the elevation of cytosolic Cl-.

Keywords: CFTR; Ca2+; GABAergic neuron; adenylate cyclase 1; amacrine cell; cAMP; nitric oxide.


Conflict of interest statement

The authors declare that the research was conducted in the absence of any commercial or financial relationships that could be construed as a potential conflict of interest.

Figures

Figure 1
Figure 1
Nitric oxide (NO) increases cytosolic Ca2+ concentration. Fluorescence intensity measurements from Amacrine cells (ACs) loaded with Oregon Green BAPTA-1 488-AM are shown (A,C). (A) In the normal external solution, NO produces an increase in cytosolic Ca2+. (B) The quantified mean fluorescence ± SEM; n = 45. For the control group, the mean value is calculated as the average of the last 30 s data before adding NO. For the NO group, the mean value is calculated as the average of the middle 30 s during the NO response. For the wash group, the mean is calculated by using the average of the data from 150 to 177 s. ****P < 0.0001 (paired t-test). (C) In the absence of Ca2+ (0 Ca2+Ext), NO increases cytosolic Ca2+. (D) The quantified mean fluorescence ± SEM; n = 54. ****P < 0.0001 (paired t-test). (E) The quantified mean peak fluorescence ± SEM after subtracting baseline in normal external condition, n = 45 and in zero Ca2+ external condition, n = 54. ***P < 0.001 (unpaired t-test). (F) The quantified mean peak fluorescence ± SEM in normal external condition, n = 45 and in zero Ca2+ external condition, n = 54. P = 0.38 (unpaired t-test). (G) The quantified mean resting fluorescence ± SEM in normal external condition, n = 45 and in zero Ca2+ external condition, n = 54. *P < 0.05 (unpaired t-test). (H) The quantified mean decay time constant ± SEM in normal external condition, n = 33 and in zero Ca2+ external condition, n = 49. Data for each cell are fitted with one phase decay exponential curve. ****P < 0.0001 (unpaired t-test).
Figure 2
Figure 2
Calcium elevations are required for the NO-dependent release of internal Cl. (A,B) The current-voltage relationship for the GABA-gated current (20 μM) before and after NO. Inset shows the voltage ramp protocol with GABA delivered during the second ramp. Under control conditions, EREV-GABA shifts to the right. With the Ca2+ chelator, BAPTA (50 μM) in the recording pipet, NO fails to elicit the EREV-GABA shift. (C) The quantified mean shift in EREV-GABA ± SEM; control, n = 6; BAPTA, n = 5. ****P < 0.0001 (unpaired t-test).
Figure 3
Figure 3
AdC1 inhibitors suppress NO-dependent Cl release. (A) Data from cells recorded under control condition (left) or pre-incubated with general AdC inhibitor, SQ22536 (100 nM) for 30 mins (right) showing reduced shift amplitudes. (B) The quantified mean shift in EREV-GABA ± SEM; n = 11 each. ****P < 0.0001 (unpaired t-test). (C) Pre-incubation with AdC 1 inhibitor, ST034307 (100 nM) for 30 mins, suppresses the NO-dependent shift in EREV-GABA. (D) The quantified mean shift in EREV-GABA ± SEM; n = 9. ***P < 0.001 (unpaired t-test). (E) Pre-incubation with the AdC 2 inhibitor, SKF83566 (10 μM) for 20 mins, does not inhibit the NO-dependent shift in EREV-GABA. (F) The quantified mean shift in EREV-GABA ± SEM; control, n = 11; SKF83566, n = 10. P = 0.91 (unpaired t-test). (G) Pre-incubation with the AdC 5/3 inhibitor, NKY80 (200 μM) for 20 mins does not block the NO-dependent shift. (H) The quantified mean shift in EREV-GABA ± SEM; control, n = 7; NKY80, n = 8. P = 0.13 (unpaired t-test).
Figure 4
Figure 4
Protein kinase A (PKA) activity is required for the NO-dependent shift in EREV-GABA. (A) Date from cells recorded under control condition (left) or pre-incubated with a kinase inhibitor, H89 (1 μM) for 30 min (right) that suppresses the NO-dependent shift in EREV-GABA. (B) The quantified mean shift in EREV-GABA ± SEM; n = 9. **P < 0.01 (unpaired t-test). (C) Pre-incubation with selective PKA inhibitor, KT5720 (300 nM, 20 min), also reduces EREV-GABA. (D) The quantified mean shift EREV-GABA ± SEM; control, n = 9; KT5720, n = 8. ***P < 0.001 (Welch’s unpaired t-test). (E) Quantified mean GABAA receptor conductance ± SEM; control, n = 9; KT5720, n = 8. P = 0.2057 (unpaired t-test).
Figure 5
Figure 5
Elevating cAMP in the absence of NO promotes Cl release from the internal store. (A) Sample traces from cells are held at −70 mV with GABA (20 μM) applied for 400 ms. In the presence of NO, a GABA-gated inward current appears indicating that Cl had been released into the cytosol. (B) In different cells, exposure to a cocktail of reagents selected to elevate cAMP (cAMP ct: forskolin, 1 μM; 8-bromo-cAMP, 100 μM; IBMX, 20 μM) but no NO, results in a small GABA-dependent inward current. (C) The quantified mean GABA-gated current amplitude ± SEM; NO, n = 13; cocktail, n = 14. *P < 0.05 (Welch’s unpaired t-test).
Figure 6
Figure 6
Influx of external Ca2+ fails to release Cl from the internal store. (A) Sample traces from cells are held at −70 mV with GABA (20 μM) applied for 400 ms. With NO stimulation, GABA-gated inward currents generate. (B) Voltage-step control settings in zero Ca2+ zero Cl external environment. Sample traces from cells that the top trace is stimulated with GABA pulse protocol, the bottom trace is repeated with GABA pulse protocol after voltage step stimulation. (C) Same experiment setting in Ca2+ (3 mM) external solution. (D) Quantified mean GABA-gated current amplitude ± SEM; NO control, n = 10; 0 Ca2+ control, n = 9; Ca2+, n = 8; p = 0.6; ns: not significant. ***P < 0.001 (repeated-measures ANOVA).
Figure 7
Figure 7
In the absence of extracellular Ca2+, ionomycin releases Ca2+ from internal stores. Calcium imaging experiments of AC cell body and cell process are loaded with Oregon Green BAPTA-1 488-AM. (A) Ionomycin (5 μM) increases cytosolic Ca2+ in the cell body. (B) Quantified mean fluorescence ± SEM; n = 73. For the control and ionomycin groups, mean value is calculated as the average of all test time in a condition. For the wash, the mean is calculated from the time point 93–120 s. ****P < 0.0001 (paired t-test). (C) Ionomycin (5 μM) increases cytosolic Ca2+ in the cell process. (D) Quantified mean fluorescence ± SEM; n = 58. Mean values are calculated as in (C). **P < 0.01 (paired t-test).
Figure 8
Figure 8
Pairing elevated cAMP and Ca2+ mimics the effects of NO. (A–C) Sample traces from GABA pulse recording (20 μM) in zero external Ca2+ and zero Cl internal and external solutions. The GABA-dependent inward current is elicited by NO (50 μl) in (A) by Ca2+ ionophore, ionomycin (5 μM) in (B), and by co-application of cAMP ct and ionomycin (5 μM) in (C). (D) Quantified mean GABA-gated current amplitude ± SEM; NO, n = 7; ionomycin, n = 11. NO, n = 13 (control cells are replotted from Figure 5D; see “ Materials and Methods” section); cocktail and ionomycin, n = 14. **P < 0.01 (left: unpaired t-test, right: Welch’s unpaired t-test).

Similar articles

Cited by

References

    1. Anderson M. P., Welsh M. J. (1991). Calcium and cAMP activate different chloride channels in the apical membrane of normal and cystic fibrosis epithelia. Proc. Natl. Acad. Sci. U S A 88, 6003–6007. 10.1073/pnas.88.14.6003 - DOI - PMC - PubMed
    1. Ben-Ari Y., Khalilov I., Kahle K. T., Cherubini E. (2012). The GABA excitatory/inhibitory shift in brain maturation and neurological disorders. Neuroscientist 18, 467–486. 10.1177/1073858412438697 - DOI - PubMed
    1. Benedetto R., Cabrita I., Schreiber R., Kunzelmann K. (2019). TMEM16A is indispensable for basal mucus secretion in airways and intestine. FASEB J. 33, 4502–4512. 10.1096/fj.201801333RRR - DOI - PubMed
    1. Benedetto R., Ousingsawat J., Wanitchakool P., Zhang Y., Holtzman M. J., Amaral M., et al. . (2017). Epithelial chloride transport by CFTR requires TMEM16A. Sci. Rep. 7:12397. 10.1038/s41598-017-10910-0 - DOI - PMC - PubMed
    1. Billet A., Hanrahan J. W. (2013). The secret life of CFTR as a calcium-activated chloride channel. J. physiol. 591, 5273–5278. 10.1113/jphysiol.2013.261909 - DOI - PMC - PubMed