

Hemodynamic Versus Anatomic Assessment of Symptomatic Atherosclerotic Middle Cerebral Artery Stenosis: the Relationship Between Pressure Wire Translesional Gradient and Angiographic Lesion Geometry
- PMID: 34456841
- PMCID: PMC8385769
- DOI: 10.3389/fneur.2021.671778
Hemodynamic Versus Anatomic Assessment of Symptomatic Atherosclerotic Middle Cerebral Artery Stenosis: the Relationship Between Pressure Wire Translesional Gradient and Angiographic Lesion Geometry
Abstract
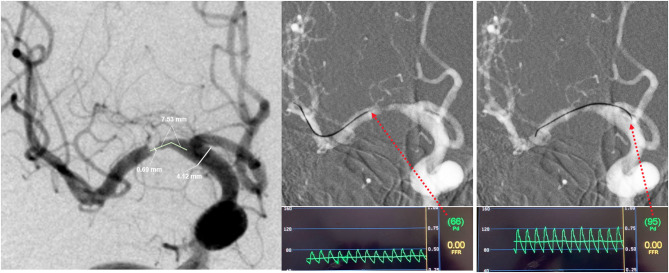
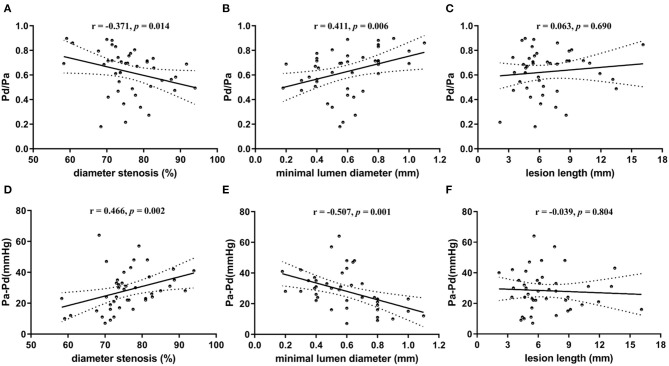
Background: Intracranial cerebral atherosclerosis (ICAS) is a leading etiology of ischemic stroke. The diagnosis and assessment of intracranial stenosis are shifting from anatomic to hemodynamic for better risk stratification. However, the relationships between lesion geometry and translesional pressure gradient have not been clearly elucidated. Methods: Patients with symptomatic unifocal M1 middle cerebral artery (M1-MCA) stenosis were consecutively recruited. The translesional pressure gradient was measured with a pressure wire and was recorded as both mean distal/proximal pressure ratios (Pd/Pa) and translesional pressure difference (Pa-Pd). Lesion geometry measured on angiography was recorded as diameter stenosis, minimal lumen diameter, and lesion length. The correlations between pressure-derived and angiography-derived indices were then analyzed. Results: Forty-three patients were analyzed. A negative correlation was found between Pd/Pa and diameter stenosis (r = -0.371; p = 0.014) and between Pa - Pd and minimal lumen diameter (r = -0.507; p = 0.001). A positive correlation was found between Pd/Pa and minimal lumen diameter (r = 0.411; p = 0.006) and between Pa - Pd and diameter stenosis (r = 0.466; p = 0.002). Conclusions: In a highly selected ICAS subgroup, geometric indices derived from angiography correlate significantly with translesional pressure gradient indices. However, the correlation strength is weak-to-moderate, which implies that anatomic assessment could only partly reflect hemodynamic status. Translesional pressure gradient measured by pressure wire may serve as a more predictive marker of ICAS severity. More factors need to be identified in further studies.
Keywords: Pa-Pd; Pd/Pa; hemodynamics; intracranial cerebral atherosclerosis; stenosis; translesional pressure gradient.
Copyright © 2021 Li, Yang, Dmytriw, Wang, Luo, Li, Ma, Chen, Wang, Gao, Feng, Bai, Zhang, Dong, Yang, Jiao and Ling.
Conflict of interest statement
The authors declare that the research was conducted in the absence of any commercial or financial relationships that could be construed as a potential conflict of interest. The handling editor HQZ declared a shared affiliation, though no other collaboration, with one or more authors LL, BY, TW, JL, YL, YM, JC, YW, PG, YF, XB, XZ, JD, RY, LJ, FL at the time of the review.
Figures
Similar articles
-
Correlations between intravascular pressure gradients and cerebral blood flow in patients with symptomatic, medically refractory, anterior circulation artery stenosis: an exploratory study.J Neurointerv Surg. 2024 May 21;16(6):608-614. doi: 10.1136/jnis-2023-020144. J Neurointerv Surg. 2024. PMID: 37402573
-
Assessing the hemodynamic significance of coronary artery stenoses: analysis of translesional pressure-flow velocity relations in patients.J Am Coll Cardiol. 1993 Aug;22(2):449-58. doi: 10.1016/0735-1097(93)90049-7. J Am Coll Cardiol. 1993. PMID: 8335814
-
Translesional pressure gradient and leptomeningeal collateral status in symptomatic middle cerebral artery stenosis.Eur J Neurol. 2018 Feb;25(2):404-410. doi: 10.1111/ene.13521. Epub 2017 Dec 18. Eur J Neurol. 2018. PMID: 29171118
-
Intracranial atherosclerosis: From anatomy to pathophysiology.Int J Stroke. 2017 Apr;12(3):236-245. doi: 10.1177/1747493016685716. Epub 2017 Jan 9. Int J Stroke. 2017. PMID: 28067615 Review.
-
Resting and hyperemic translesional pressure indices: Similarities and discordances.Cardiovasc Revasc Med. 2025 Feb;71:24-30. doi: 10.1016/j.carrev.2024.12.006. Epub 2024 Dec 25. Cardiovasc Revasc Med. 2025. PMID: 39753395 Review. No abstract available.
Cited by
-
Hemodynamic Impairments of Evaluating Symptomatic Intracranial Atherosclerotic Stenosis using Quantitative Flow Ratio on Digital Subtraction Angiography : A Comparison with Computed Tomography Perfusion, MRI and Fractional Flow Reserve.Clin Neuroradiol. 2024 Sep;34(3):613-624. doi: 10.1007/s00062-024-01395-2. Epub 2024 Mar 15. Clin Neuroradiol. 2024. PMID: 38489035
-
Integrating hemodynamic analysis with traditional imaging in intracranial atherosclerotic stenosis: current status and future perspectives.Front Neurol. 2025 Jul 18;16:1589162. doi: 10.3389/fneur.2025.1589162. eCollection 2025. Front Neurol. 2025. PMID: 40757026 Free PMC article. Review.
-
Functional evaluation of intracranial atherosclerotic stenosis by pressure ratio measurements.Heliyon. 2023 Feb 10;9(2):e13527. doi: 10.1016/j.heliyon.2023.e13527. eCollection 2023 Feb. Heliyon. 2023. PMID: 36852079 Free PMC article.
References
LinkOut - more resources
Full Text Sources