

A FACS-Free Purification Method to Study Estrogen Signaling, Organoid Formation, and Metabolic Reprogramming in Mammary Epithelial Cells
- PMID: 34456857
- PMCID: PMC8397380
- DOI: 10.3389/fendo.2021.672466
A FACS-Free Purification Method to Study Estrogen Signaling, Organoid Formation, and Metabolic Reprogramming in Mammary Epithelial Cells
Abstract
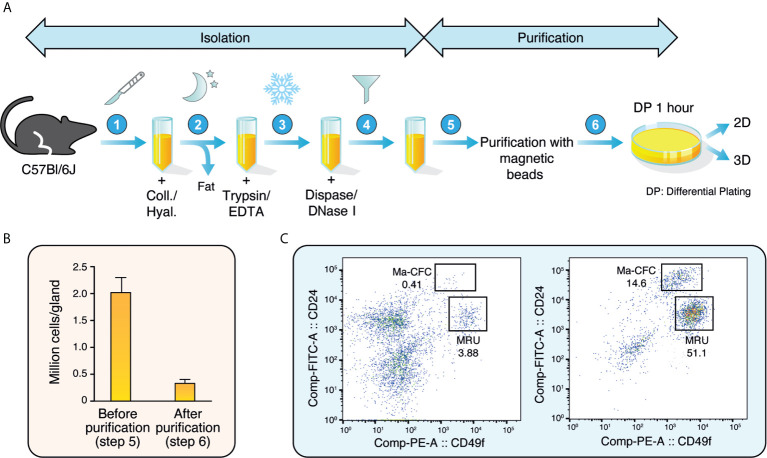
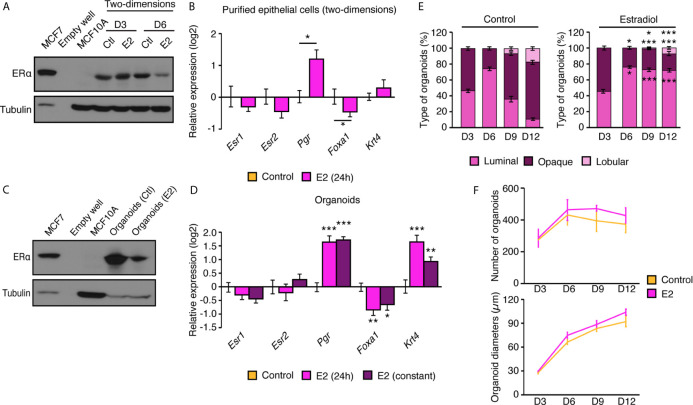
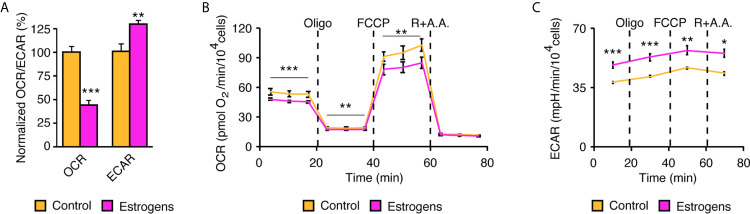
Few in vitro models are used to study mammary epithelial cells (MECs), and most of these do not express the estrogen receptor α (ERα). Primary MECs can be used to overcome this issue, but methods to purify these cells generally require flow cytometry and fluorescence-activated cell sorting (FACS), which require specialized instruments and expertise. Herein, we present in detail a FACS-free protocol for purification and primary culture of mouse MECs. These MECs remain differentiated for up to six days with >85% luminal epithelial cells in two-dimensional culture. When seeded in Matrigel, they form organoids that recapitulate the mammary gland's morphology in vivo by developing lumens, contractile cells, and lobular structures. MECs express a functional ERα signaling pathway in both two- and three-dimensional cell culture, as shown at the mRNA and protein levels and by the phenotypic characterization. Extracellular metabolic flux analysis showed that estrogens induce a metabolic switch favoring aerobic glycolysis over mitochondrial respiration in MECs grown in two-dimensions, a phenomenon known as the Warburg effect. We also performed mass spectrometry (MS)-based metabolomics in organoids. Estrogens altered the levels of metabolites from various pathways, including aerobic glycolysis, citric acid cycle, urea cycle, and amino acid metabolism, demonstrating that ERα reprograms cell metabolism in mammary organoids. Overall, we have optimized mouse MEC isolation and purification for two- and three-dimensional cultures. This model represents a valuable tool to study how estrogens modulate mammary gland biology, and particularly how these hormones reprogram metabolism during lactation and breast carcinogenesis.
Keywords: breast cancer; breast feeding; estrogen receptor; lactation; metabolomics; nuclear receptor; organoids; steroid.
Copyright © 2021 Lacouture, Jobin, Weidmann, Berthiaume, Bastien, Laverdière, Pelletier and Audet-Walsh.
Conflict of interest statement
The authors declare that the research was conducted in the absence of any commercial or financial relationships that could be construed as a potential conflict of interest.
Figures


Similar articles
-
Establishing estrogen-responsive mouse mammary organoids from single Lgr5+ cells.Cell Signal. 2017 Jan;29:41-51. doi: 10.1016/j.cellsig.2016.08.001. Epub 2016 Aug 7. Cell Signal. 2017. PMID: 27511963 Free PMC article.
-
Basal but not luminal mammary epithelial cells require PI3K/mTOR signaling for Ras-driven overgrowth.Cancer Res. 2012 Nov 15;72(22):5856-66. doi: 10.1158/0008-5472.CAN-12-1635. Epub 2012 Sep 24. Cancer Res. 2012. PMID: 23010075 Free PMC article.
-
Derivation of a robust mouse mammary organoid system for studying tissue dynamics.Development. 2017 Mar 15;144(6):1065-1071. doi: 10.1242/dev.145045. Epub 2016 Dec 19. Development. 2017. PMID: 27993977
-
Culture Models to Investigate Mechanisms of Milk Production and Blood-Milk Barrier in Mammary Epithelial Cells: a Review and a Protocol.J Mammary Gland Biol Neoplasia. 2023 May 1;28(1):8. doi: 10.1007/s10911-023-09536-y. J Mammary Gland Biol Neoplasia. 2023. PMID: 37126158 Free PMC article. Review.
-
Characterization of Organoid Cultures to Study the Effects of Pregnancy Hormones on the Epigenome and Transcriptional Output of Mammary Epithelial Cells.J Mammary Gland Biol Neoplasia. 2020 Dec;25(4):351-366. doi: 10.1007/s10911-020-09465-0. Epub 2020 Nov 1. J Mammary Gland Biol Neoplasia. 2020. PMID: 33131024 Free PMC article. Review.
Cited by
-
A Nutrient-Based Cellular Model to Characterize Acetylation-Dependent Protein-Protein Interactions.Front Mol Biosci. 2022 Mar 23;9:831758. doi: 10.3389/fmolb.2022.831758. eCollection 2022. Front Mol Biosci. 2022. PMID: 35402505 Free PMC article.
-
Multiple metabolic pathways fuel the truncated tricarboxylic acid cycle of the prostate to sustain constant citrate production and secretion.Mol Metab. 2022 Aug;62:101516. doi: 10.1016/j.molmet.2022.101516. Epub 2022 May 20. Mol Metab. 2022. PMID: 35598879 Free PMC article.
-
Transcriptome analysis of the Bactrian camel (Camelus bactrianus) reveals candidate genes affecting milk production traits.BMC Genomics. 2023 Nov 2;24(1):660. doi: 10.1186/s12864-023-09703-9. BMC Genomics. 2023. PMID: 37919661 Free PMC article.
-
Isocitrate dehydrogenase 1 sustains a hybrid cytoplasmic-mitochondrial tricarboxylic acid cycle that can be targeted for therapeutic purposes in prostate cancer.Mol Oncol. 2023 Oct;17(10):2109-2125. doi: 10.1002/1878-0261.13441. Epub 2023 Jul 19. Mol Oncol. 2023. PMID: 37086156 Free PMC article.
-
Metabolomics-based mass spectrometry methods to analyze the chemical content of 3D organoid models.Analyst. 2022 Jun 27;147(13):2918-2929. doi: 10.1039/d2an00599a. Analyst. 2022. PMID: 35660810 Free PMC article. Review.
References
Publication types
MeSH terms
Substances
Grants and funding
LinkOut - more resources
Full Text Sources
Other Literature Sources