. 2021 Aug 11:12:682224.
doi: 10.3389/fmicb.2021.682224. eCollection 2021.

Temporal Changes in the Function of Bacterial Assemblages Associated With Decomposing Earthworms

Affiliations

Temporal Changes in the Function of Bacterial Assemblages Associated With Decomposing Earthworms

Yao-Qin Sun et al. Front Microbiol. .

Abstract

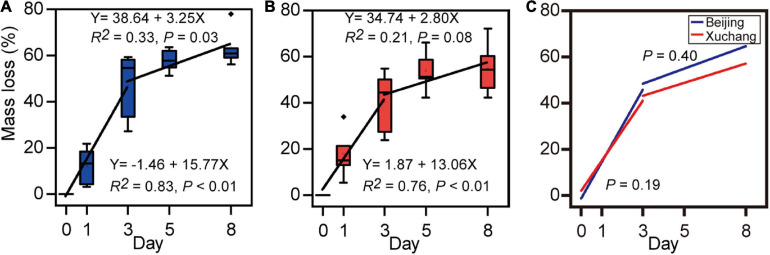
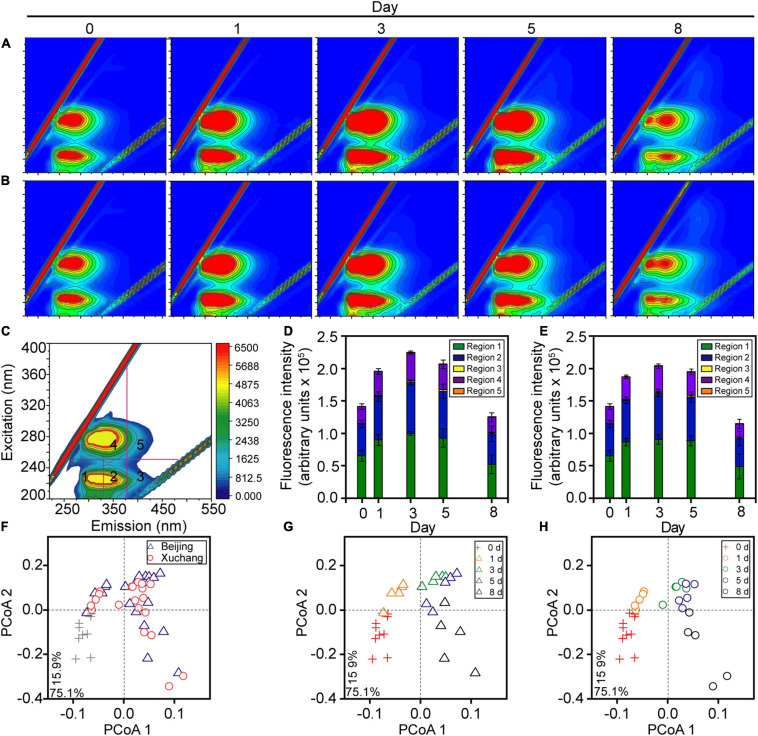
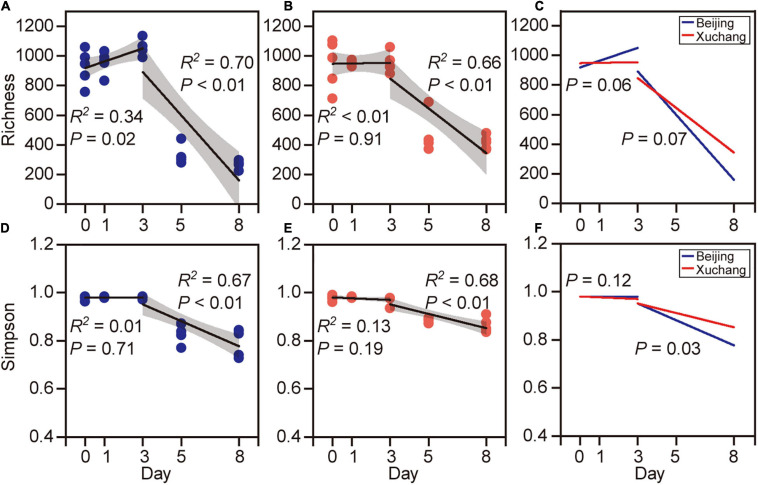
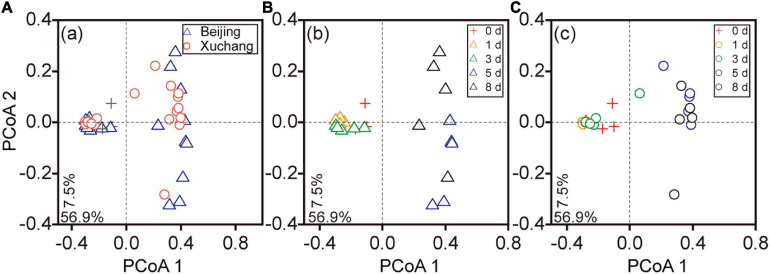
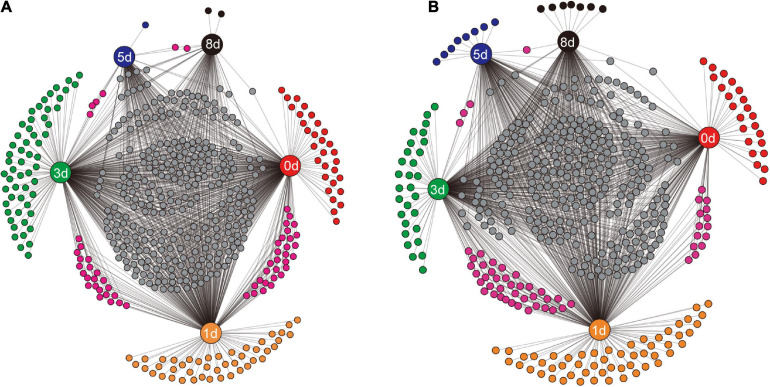
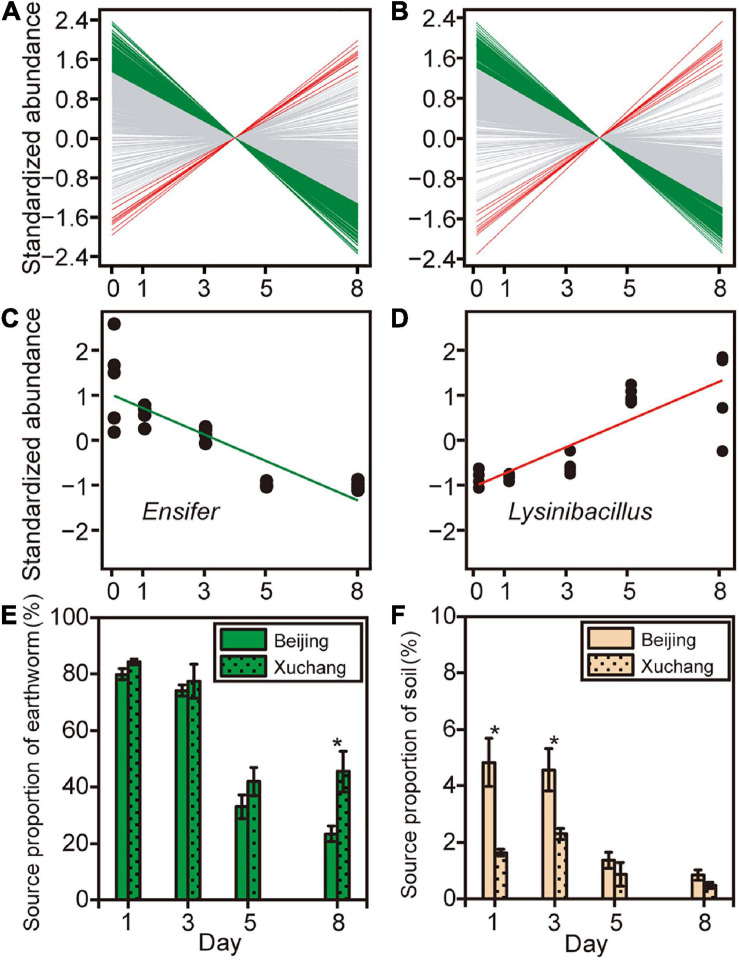
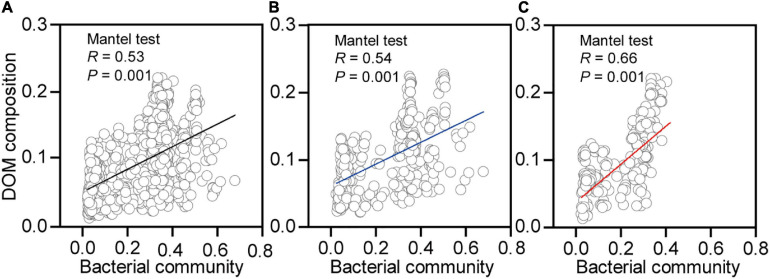
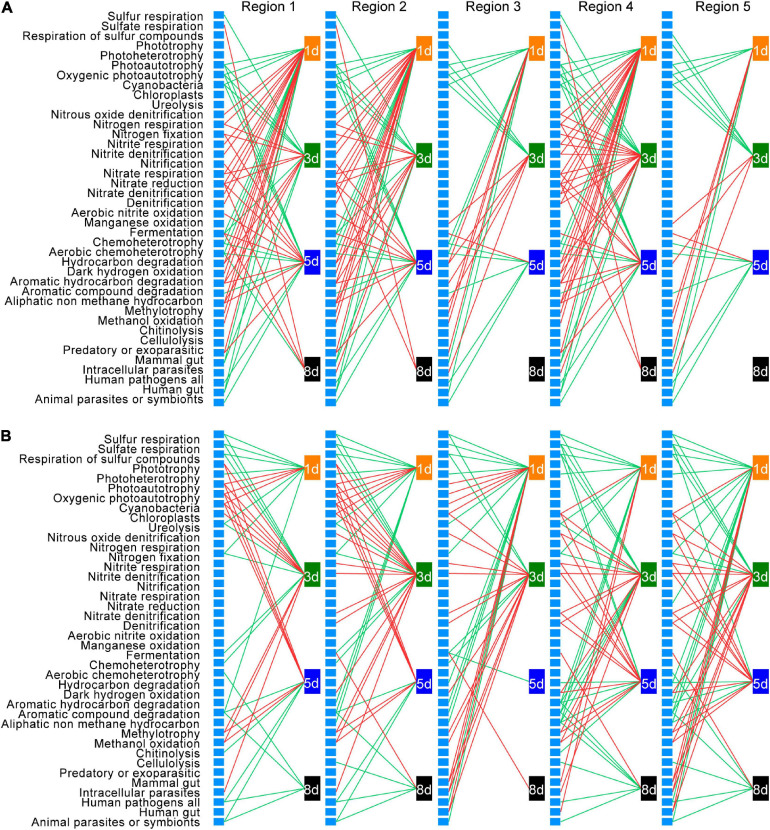
Soil invertebrate corpse decomposition is an ecologically significant, yet poorly understood, process affecting nutrient biogeochemical cycling in terrestrial ecosystems. Here, we attempted to answer how the substrate chemistry and microbial community change during soil invertebrate (earthworm) decomposition and what roles microbes play in this process. Specifically, the dead earthworms (Amynthas corticis) were buried in two soils where the earthworms inhabited, or not, until more than 50% of the earthworm mass was lost. For both soils, earthworms decomposed faster during the early stage (between 0 and 3 days), as reflected by the higher rate of decomposition and increased accumulation of dissolved organic matter (DOM). This decomposition pattern was paralleled by bacterial community dynamics, where bacterial richness and diversity were significantly higher during early decomposition (p < 0.05) with the relative abundances of many genera decreasing as decomposition progressed. The succession of the bacterial community composition was significantly correlated with time-course changes in DOM composition (p < 0.05). Particularly, more functional groups (e.g., microbes associated with carbon, nitrogen, and sulfur cycling) were identified to be linked with the change of a specific DOM type during the early decomposition phase. By exploring the ecologically important process of soil invertebrate decomposition and its associated bacterial communities, this study provides evidence, e.g., a statistically significant positive correlation between bacterial community and DOM compositions, which supports the widely recognized yet less-tested microbial community structure-function relationship hypothesis in invertebrate decomposition.

Keywords: bacterial community; decomposition; dissolved organic matter; earthworm; structure–function relationship.


Conflict of interest statement

The authors declare that the research was conducted in the absence of any commercial or financial relationships that could be construed as a potential conflict of interest.

Figures

FIGURE 1
FIGURE 1
Loss of earthworm mass in native soil (A) and non-native soil (B), and the comparison of decomposition rates between native soil (Beijing) and non-native soil (Xuchang) (C). Decomposition rates were estimated as the slope of a linear regression of mass loss versus time.
FIGURE 2
FIGURE 2
The dissolved organic matter (DOM) composition of decaying earthworm changed during decomposition in native soil and non-native soil. Representative excitation-emission spectra of DOM in native soil (A) and non-native soil (B). Five fractions in excitation-emission spectra (C): tyrosine-like proteins (region 1), tryptophan-like proteins (region 2), fulvic acid-like organics (region 3), microbial byproduct-like materials (region 4), and humic acid-like organics (region 5). The color refers to increasing of fluorescence intensity from blue to red in A–C. The amount of total DOM and all five fractions showed a clear temporal pattern either in native soil (D) or non-native soil (E). The shifts of DOM composition over time were visualized in the principal coordinate analysis (PCoA; F–H) based on the Bray–Curtis distance of excitation-emission spectra. The triangles indicate the samples in native soil (Beijing), circles indicate those in non-native soil (Xuchang), and the crosses indicate the samples in native soil and non-native soil at day 0.
FIGURE 3
FIGURE 3
The richness [number of observed operational taxonomic units (OTUs)] and Simpson index of bacterial communities on decaying earthworm. Bacterial diversity showed clear temporal pattern in both native soil treatment (A,C) and non-native soil treatment (B,D). The richness (A,B) and Simpson index (C,D) of bacterial communities showed higher values before day 3 and then decreased after day 3. The temporal changes of bacterial richness were marginally different between native soil and non-native soil either before day 3 (E, p = 0.06) or after day 3 (E, p = 0.07). The Simpson index was significantly different in two soils after day 3 (F, p = 0.03).
FIGURE 4
FIGURE 4
The principal coordinate analyses (PCoAs) based on the Bray–Curtis distance of bacterial communities at different sampling times. Triangles indicate the samples in native soil (Beijing), circles indicate those in non-native soil (Xuchang), and the crosses indicate the samples in native soil and non-native soil at day 0. PCoA of bacterial communities in native and non-native soil treatments (A). Decomposition time had a significant effect on bacterial community composition in native soil (B, p < 0.01) as well as in non-native soil (C, p < 0.01).
FIGURE 5
FIGURE 5
The shared genera between different sampling times and the unique genera at a specific sampling time in native soil treatment (A) and non-native soil treatment (B). The sampling times (days 0, 1, 3, 5, and 8) are indicated by the nodes with labels. Each unlabeled node represented an individual genus. Connections (black lines) were drawn between specific sampling time and the related genera.
FIGURE 6
FIGURE 6
The abundance of specific bacterial genera changed as decomposition proceeded in native soil (A) and non-native soil (B). Green lines indicate that the abundance of bacterial genus significantly decreased with time (p < 0.05), red lines indicate that the abundance of bacterial genus that significantly increased (p < 0.05), and gray lines indicate that there was no significant change in bacterial abundance over time (p > 0.05). Two representative genera, Ensifer (C) and Lysinibacillus (D), were selected to show the relationships between taxonomic abundance and decomposition time. Source tracking was used to quantify the proportion of the likely source environments (source), earthworm-derived (E) and soil-derived (F), to the microbial community on decaying earthworm. Asterisks indicate significant differences in the contribution of likely source between native soil and non-native soil treatments (independent samples t-test, p < 0.05).
FIGURE 7
FIGURE 7
Correlations between bacterial community and dissolved organic matter (DOM) composition for decaying earthworm in both soils (A), native soil treatment (B, Beijing), and non-native soil treatment (C, Xuchang). The Mantel test (9999 permutations) calculated Pearson’s correlation between the Euclidean distance of bacterial community and Bray–Curtis distance of DOM composition.
FIGURE 8
FIGURE 8
Correlations between changes in the abundance of bacterial functional groups and changes in the amount of dissolved organic matter (DOM) in native soil (A) and non-native soil (B). Only significant (p < 0.05) correlations are shown. Red lines represent positive correlations, and green lines represent negative correlations. Each unlabeled rectangle represents a specific functional group. Each labeled rectangle represents a specific sampling time. The five groups arranged from left to right are the five types of DOM: tyrosine-like proteins (region 1), tryptophan-like proteins (region 2), fulvic acid-like organics (region 3), microbial byproduct-like materials (region 4), and humic acid-like organics (region 5).

Similar articles

Cited by

References

    1. Bar-On Y. M., Phillips R., Milo R. (2018). The biomass distribution on Earth. Proc. Natl. Acad. Sci. U.S.A. 115 6506–6511. - PMC - PubMed
    1. Barton P. S., Evans M. J., Foster C. N., Pechal J. L., Bump J. K., Quaggiotto M. M., et al. (2019). Towards quantifying carrion biomass in ecosystems. Trends Ecol. Evol. 34 950–961. 10.1016/j.tree.2019.06.001 - DOI - PubMed
    1. Bastian M., Heymann S., Jacomy M. (2009). Gephi: an open source software for exploring and manipulating networks. Proc. Third Int. ICWSM Conf. 8 361–362.
    1. Benbow M. E., Barton P. S., Ulyshen M. D., Beasley J. C., DeVault T. L., Strickland M. S., et al. (2019). Necrobiome framework for bridging decomposition ecology of autotrophically and heterotrophically derived organic matter. Ecol. Monogr. 89:e01331.
    1. Benbow M. E., Receveur J. P., Lamberti G. A. (2020). Death and decomposition in aquatic ecosystems. Front. Ecol. Evol. 8:17. 10.3389/fevo.2020.00017 - DOI

LinkOut - more resources