. 2021 Aug 11:12:663851.
doi: 10.3389/fpls.2021.663851. eCollection 2021.

Genomic and Phenotypic Biology of Novel Strains of Dickeya zeae Isolated From Pineapple and Taro in Hawaii: Insights Into Genome Plasticity, Pathogenicity, and Virulence Determinants

Affiliations

Genomic and Phenotypic Biology of Novel Strains of Dickeya zeae Isolated From Pineapple and Taro in Hawaii: Insights Into Genome Plasticity, Pathogenicity, and Virulence Determinants

Gamze Boluk et al. Front Plant Sci. .

Abstract

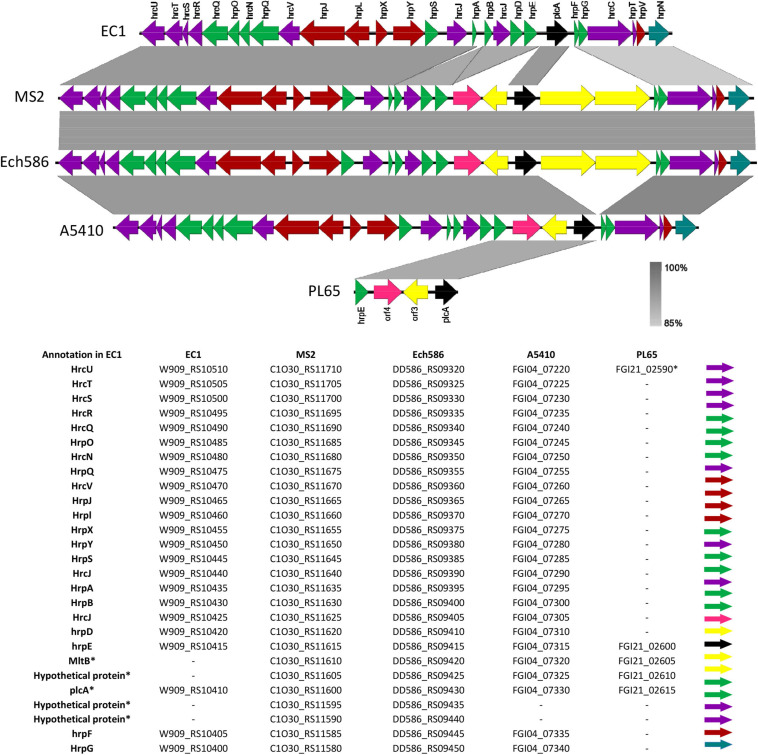
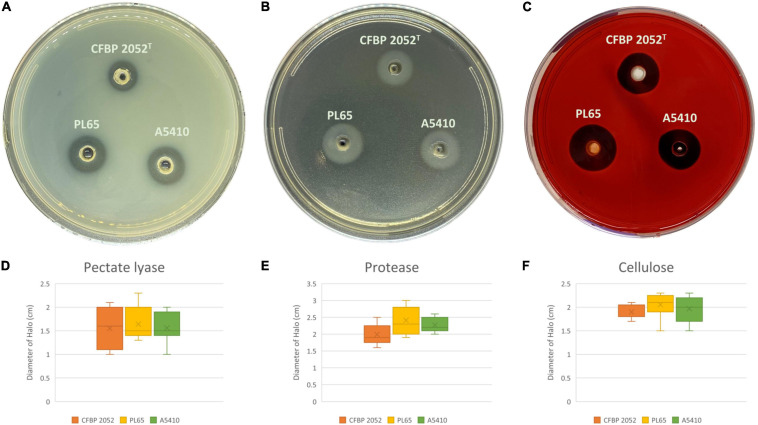
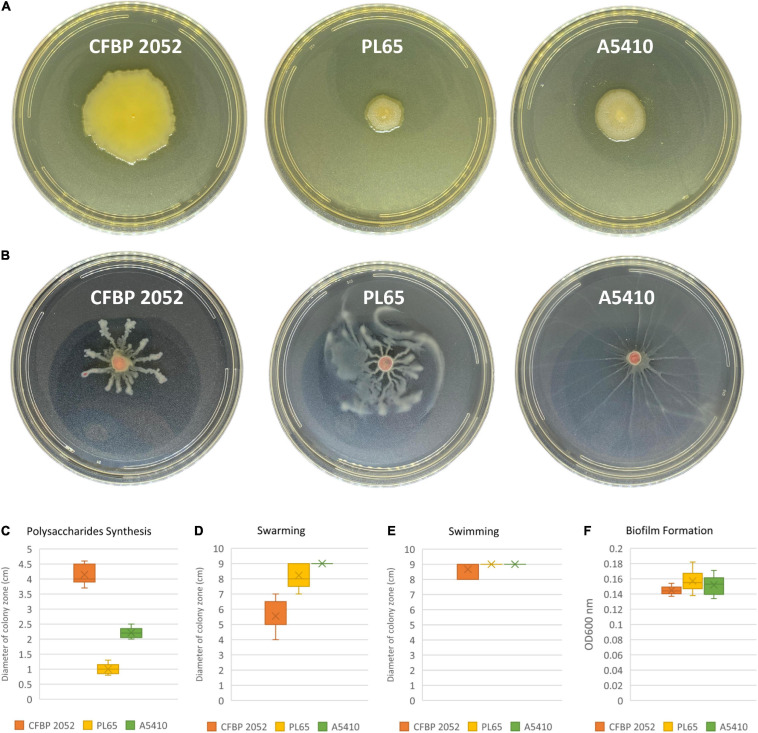
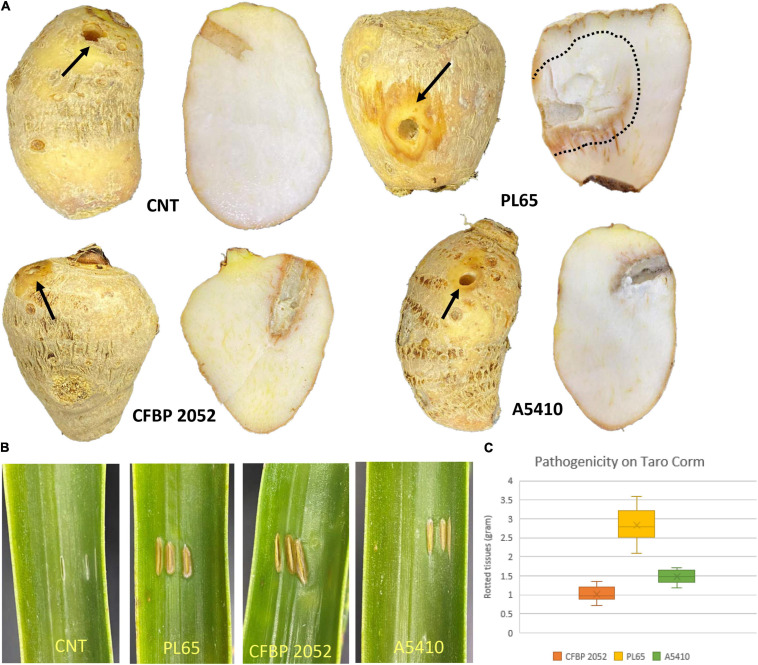
Dickeya zeae, a bacterial plant pathogen of the family Pectobacteriaceae, is responsible for a wide range of diseases on potato, maize, rice, banana, pineapple, taro, and ornamentals and significantly reduces crop production. D. zeae causes the soft rot of taro (Colocasia esculenta) and the heart rot of pineapple (Ananas comosus). In this study, we used Pacific Biosciences single-molecule real-time (SMRT) sequencing to sequence two high-quality complete genomes of novel strains of D. zeae: PL65 (size: 4.74997 MB; depth: 701x; GC: 53.6%) and A5410 (size: 4.7792 MB; depth: 558x; GC: 53.5%) isolated from economically important Hawaiian crops, taro, and pineapple, respectively. Additional complete genomes of D. zeae representing three additional hosts (philodendron, rice, and banana) and other species used for a taxonomic comparison were retrieved from the NCBI GenBank genome database. Genomic analyses indicated the truncated type III and IV secretion systems (T3SS and T4SS) in the taro strain, which only harbored one and two genes of T3SS and T4SS, respectively, and showed high heterogeneity in the type VI secretion system (T6SS). Unlike strain EC1, which was isolated from rice and recently reclassified as D. oryzae, neither the genome PL65 nor A5410 harbors the zeamine biosynthesis gene cluster, which plays a key role in virulence of other Dickeya species. The percentages of average nucleotide identity (ANI) and digital DNA-DNA hybridization (dDDH) between the two genomes were 94.47 and 57.00, respectively. In this study, we compared the major virulence factors [plant cell wall-degrading extracellular enzymes and protease (Prt)] produced by D. zeae strains and evaluated the virulence on taro corms and pineapple leaves. Both strains produced Prts, pectate lyases (Pels), and cellulases but no significant quantitative differences were observed (p > 0.05) between the strains. All the strains produced symptoms on taro corms and pineapple leaves, but the strain PL65 produced symptoms more rapidly than others. Our study highlights the genetic constituents of pathogenicity determinants and genomic heterogeneity that will help to understand the virulence mechanisms and aggressiveness of this plant pathogen.

Keywords: Dickeya zeae; comparative genomics; pathogenicity determinants and virulence factors; pectinolytic bacteria; phylogenomics; pineapple; taro (Colocasia esculenta).


Conflict of interest statement

The authors declare that the research was conducted in the absence of any commercial or financial relationships that could be construed as a potential conflict of interest.

Figures

FIGURE 1
FIGURE 1
Summary of the general pectin degradation pathway in soft rot bacteria.
FIGURE 2
FIGURE 2
Sharing of plant cell wall-degrading enzymes (PCWDEs) in Dickeya species. The types of cell wall-degrading enzymes are indicated for each of the strains. (A) Concatenated Neighbor-Joining phylogenetic dendrogram based on 86 PCWDEs in Dickeya sp. The Neighbor-Joining method was applied to determine the distances, with each node being supported by a bootstrap of 1,000 replicates to assess reliability. (B) Color scales based on the presence and absence of 86 plant cell wall-degrading genes in the genomes. Dark blue (formula image
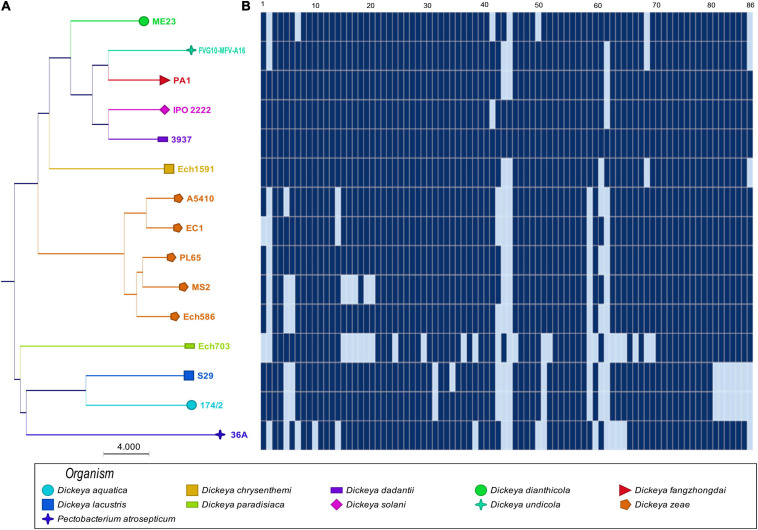
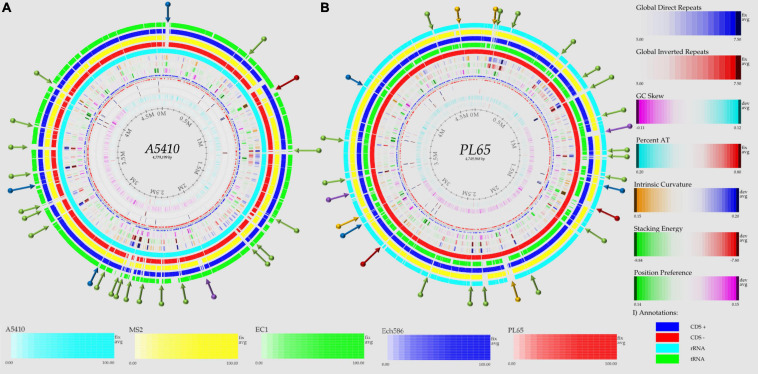
) shows the presence of genes, and light blue (formula image) shows the absence of genes. In (B), numbers 1–86 are described in Supplementary Table 1.
FIGURE 3
FIGURE 3
Basic Local Alignment Search Tool (BLAST) matrix between and within the total proteomes of Dickeya genus. A pairwise protein comparison was performed using BLAST. All protein-coding sequences were compared with each other across the genomes. The BLAST hit was considered as significant when 50% of the alignment showed identical matches and if the coverage of an alignment was at least 50%. The color scale intensity from dark green to light green highlights a decrease in the degree of homology between the proteomes, whereas the color scale from dark red to light red shows decreasing homologous hits within the proteome itself.
FIGURE 4
FIGURE 4
Pan- and core-genome analyses among the Dickeya species. Pan- and core-genome plot: (A) The pan and core genome analyses were developed by employing BLAST with a cutoff of 50% identity and 50% coverage of the longest gene. (B) Pan-genome tree: the respective dendrogram illustrates the grouping of species based upon the shared gene families (core genome) defined in the pan- and core-genome analysis. Organisms are marked 1–14; 1, PL65; 2, A5410; 3, MS2; 4, Ech586; 5, EC1 (D. zeae); 6, D. undicola FVG10-MFV-A16; 7, D. aquatica 174/2; 8, D. lacustris S29; 9, D. solani IPO 2222; 10, D. dadantii 3937; 11, D. dianthicola ME23; 12, D. fangzhongdai PA1; 13, D. paradisiaca Ech703; and 14, D. chrysanthemi Ech1591.
FIGURE 5
FIGURE 5
Genome BLAST atlases within the D. zeae complex species. The genomes of novel strains (A) A5410 and (B) PL65 were used as references to generate the circular graphics. Data of DNA, RNA, and gene features of both the references were obtained after annotating the genomes using the NCBI prokaryotic genome annotation pipeline (PGAP). From the most inward lane, the figures display the size of the genome (axis), percent AT (red = high AT), GC skew (blue = most Gs), inverted and direct repeats (DRs; color = repeat), a position preference, stacking energy, and an intrinsic curvature. Following these layers, the external solid rings (indicated with a unique color) represent the genomes of other D. zeae strains mapped against the references. Olive arrows highlight those unique DNA regions associated with a high intrinsic curvature, stacking energy and a position reference found solely in the novel strains A5410 and PL65. Dark-red arrows pinpoint the areas of the genome with a low intrinsic curvature, stacking energy, and a position reference. Dark-blue arrows indicate a low intrinsic curvature and low stacking energy but a high position reference. Orange arrows show areas of the genome displaying a high intrinsic curvature and high stacking energy but a low position reference, whereas purple arrows represent those genetic zones absent in some D. zeae isolates. BLAST genome atlases were created using the CMG-biotools pipeline.
FIGURE 6
FIGURE 6
Comparison of D. zeae genome sequences against each other. Venn diagram showing the number of clusters of orthologous genes, which are shared and unique at the strain level. Venn diagrams (A–E) are shown for the deduced proteins of A5410, PL65, Ech586, EC1, and MS2, respectively. Values were calculated by OrthoMCL clustering analyses using the following parameters: p-value cut-off = 1 × 10⁻⁵; identity cut-off = 90%; percent match cut-off = 80, deduced proteins of A5410, PL65, Ech586, EC1, and MS2, respectively. (F) The complete genome alignment of five linearized D. zeae genomes was performed using progressiveMAUVE. The scale represents the coordinates of each genome. Different color blocks represent local collinear blocks (LCBs), which are conserved segments in five genomes. Within LCBs, the white area represents low similarity regions or regions unique to one genome but absent in another. LCBs above the black horizontal central line are in forwarding orientation and below this are in reverse orientation. Colored lines show the rearrangement of LCBs among the genomes.
FIGURE 7
FIGURE 7
The unique gene clusters present in D. zeae strains. (A) The nitrogen fixation cluster from genome A5410. (B) The pilus assembly protein cluster from PL65.
FIGURE 8
FIGURE 8
The circular view of the genomes of (A) A5410 and (C) PL65 strains generated using Proteome Comparison tool of Pathosystems Resource Integration Center (PATRIC) showing the physical map of significant features. From outside in: position label Mb (shown in formula image
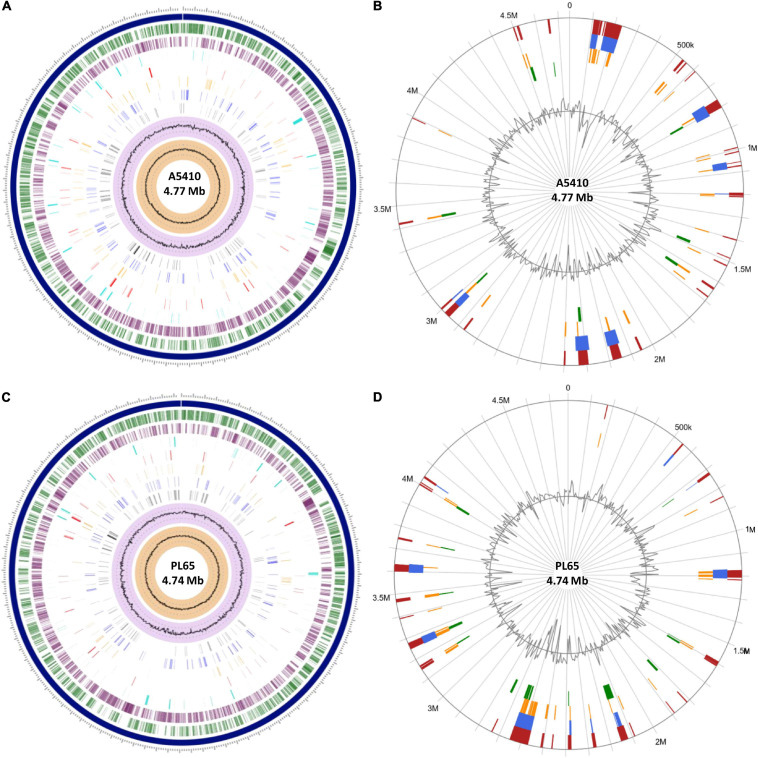
); the order of contigs (shown in formula image); distribution of coding sequences in forward strands (shown in formula image); distribution of coding sequences in reverse strands (shown in formula image); distribution of non-coding elements along the chromosome (shown in formula image); distribution of genes involved in antibiotic resistance (shown in formula image); distribution of other virulence factors (shown in formula image); distribution of genes encoding transporter proteins (shown in formula image); distribution of genes encoding drug targets (shown in formula image); distribution of GC content (shown in formula image); and distribution of GC skew (shown in formula image). Circular visualization of the predicted Genomic Islands (GIs) on A5410 (B) and PL65 (D) strains. The analysis was conducted in IslandViewer 4. The interactive visualization of the distinct islands across the genomes is shown with blocks colored according to the predictor tool as described: IslandPick (shown in formula image) based on genome comparison, IslandPath-DIMOB (shown in formula image) based on associated GIs features such as transfer RNAs (tRNAs), transposon elements, integrases, and sequence bias, SIGI-HMM (shown in formula image), based on the codon usage bias with a Hidden Markov model criterion and the integrated results of the four tools (shown in formula image).
FIGURE 9
FIGURE 9
Comparison of the genetic organization of type III secretion system (T3SS) among five D. zeae strains. The arrow position represented a forward/reverse gene orientation. The arrow color signified a specific gene composition within the T3SS. A pairwise alignment between the linear sequences was rendered based upon the BLAST algorithm with cut-off values from 85 to 100%. Regions with a higher nucleotide identity were displayed with a shaded gray.
FIGURE 10
FIGURE 10
Extracellular cell wall-degrading enzymes produced by three D. zeae strains. The three D. zeae strains assayed on the (A) pectate lyase (Pel), (B) protease (Prt), and (C) cellulose (Cel) plates. Samples of 50 μl of overnight culture were added to the assay plate wells (3 mm in diameter) and incubated at 28°C. The Pel assay plates were treated with 4 N HCl after 10 h. The Cel assay plates were stained with 0.1% (w/v) Congo red for 10 h and decolored with 5 M NaCl. The Prt assay plates were observed after 24 h without any further treatment. (D–F) indicate the production of Pel, Prt, and Cel from D. zeae strains, respectively.
FIGURE 11
FIGURE 11
Exopolysaccharide production and motility of three D. zeae strains. (A) Exopolysaccharide [extracellular polysaccharide (EPS)] production of cells grown in Super Optimal Broth (SOB) medium of three D. zeae strains, and the colony diameter measured 24 h later; (B) swarming capacity of three D. zeae strains was observed in semi-solid medium, after 24 h at 28°C; (C) production of exopolysaccharides; (D) capability of swarming; (E) capability of swimming; and (F) ability of biofilm formation.
FIGURE 12
FIGURE 12
Pathogenicity of D. zeae strains on taro corm and pineapple leaf. (A) Infected and control taro corm (CNT) after incubation. Decayed tissue is indicated by black arrows and black dotted lines on the taro corm. (B) Infected and control leaves (CNT) 72 h after inoculation. (C) Percentage of macerated tissue from taro corms.

References

    1. Adeolu M., Alnajar S., Naushad S., Gupta R. S. (2016). Genome-based phylogeny, and taxonomy of the ‘Enterobacteriales’: proposal for Enterobacteriales ord. nov. divided into the families Enterobacteriaceae, Erwiniaceae fam. nov., Pectobacteriaceae fam. nov., Yersiniaceae fam. nov., Hafniaceae fam. nov., Morganellaceae fam. nov., and Budviciaceae fam. nov. Int. J. Syst. Evol. Microbiol. 66 5575–5599. 10.1099/ijsem.0.001485 - DOI - PubMed
    1. Alfano J. R., Collmer A. (2004). Type III secretion system effector proteins: double agents in bacterial disease and plant defense. Annu. Rev. Phytopathol. 42 385–414. 10.1146/annurev.phyto.42.040103.110731 - DOI - PubMed
    1. Alič Š, Pédron J., Dreo T., Van Gijsegem F. (2019). Genomic characterization of the new Dickeya fangzhongdai species regrouping plant pathogens and environmental isolates. BMC Genomics 20:34. 10.1186/s12864-018-5332-3 - DOI - PMC - PubMed
    1. Altschul S. F., Gish W., Miller W., Myers E. W., Lipman D. J. (1990). Basic local alignment search tool. J. Mol. Biol. 215 403–410. 10.1016/S0022-2836(05)80360-2 - DOI - PubMed
    1. Antúnez-Lamas M., Cabrera-Ordóñez E., López-Solanilla E., Raposo R., Trelles-Salazar O., Rodríguez-Moreno A., et al. (2009). Role of motility and chemotaxis in the pathogenesis of Dickeya dadantii 3937 (ex Erwinia chrysanthemi 3937). Microbiology 155 434–442. 10.1099/mic.0.022244-0 - DOI - PubMed

LinkOut - more resources