. 2021 Aug 11:12:698983.
doi: 10.3389/fgene.2021.698983. eCollection 2021.

Comparative Transcriptomic Analysis Reveals the Immunosuppressive Targets of Mesalazine in Dextran Sulfate Sodium-Induced Ulcerative Colitis

Affiliations

Comparative Transcriptomic Analysis Reveals the Immunosuppressive Targets of Mesalazine in Dextran Sulfate Sodium-Induced Ulcerative Colitis

Rong Li et al. Front Genet. .

Abstract

Ulcerative colitis (UC) is a complex inflammatory bowel disorder that can induce colonic and rectal dysfunction. Mesalazine, a first-line medicine, is routinely prescribed for UC treatment. However, the pharmacological targets of mesalazine against UC are not detailed in current publications. In the current study, a transcriptomics strategy was applied to reveal the therapeutic targets and molecular mechanisms of mesalazine for treating dextran sulfate sodium (DSS)-induced UC in mice. Compared with the UC group, a total of 1,663 differentially expressed genes were identified in mesalazine-treated mice, of which 262 were upregulated and 1,401 were downregulated. GO and KEGG enrichment analyses indicated that the protective actions of mesalazine for treating UC were related to the functional regulation of immune inflammatory response, such as the regulation of T cells, white blood cells, and cytokine receptor pathways. In addition, ingenuity pathway analysis of the gene network further revealed the inhibitory action of mesalazine on C-C motif chemokine ligands (CCL11 and CCL21) and C-X-C motif chemokine ligands (CXCL3 and CXCR2). Taken together, the current transcriptomic findings revealed anti-UC pharmacological targets, including the newly discovered biotargets CCL11, CCL21, CXCL3, and CXCR2, of mesalazine against DSS-induced intestinal inflammation.

Keywords: differentially expressed genes; mesalazine; pharmacological targets; transcriptomics; ulcerative colitis.


Conflict of interest statement

The authors declare that the research was conducted in the absence of any commercial or financial relationships that could be construed as a potential conflict of interest.

Figures

FIGURE 1
FIGURE 1
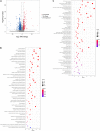
Dextran sulfate sodium (DSS) induced colitis through the induction of inflammatory response. The volcano plot shows the differential expression of genes in the gut of DSS-induced colitis mice. The genes with | log2 (fold change: DSS/Ctrl)| > 1 and -log B and H corrected p-value > 1.3 were considered differentially expressed genes (DEGs). The red dot represents upregulated genes, the green dot represents downregulated genes, and the gray dot represents genes with no significant change. (B) The rich factor plot shows the alteration of biological processes related to immunity in the gut of DSS-induced colitis mice. The size of the dot represents the number of DEGs. The color intensity of the dots represents the significance of the biology processes. (C) The rich factor plot showed the alteration of cell signaling pathways related to immunity in the gut of DSS-induced colitis mice. The size of the dot represents the number of DEGs. The color intensity of the dots represents the significance of the signaling pathways.
FIGURE 2
FIGURE 2
Immunosuppressive effects of mesalazine on DSS-induced colitis. The volcano plot shows the differential expression of genes in the mesalazine-treated colitis mice. The genes with | log2 (fold change: mesalazine + DSS/DSS)| > 1 and -log B and H corrected p-value > 1.3 were considered DEGs. The red dot represents upregulated genes, the green dot represents downregulated genes, and the gray dot represents genes with no significant change. (B) The rich factor plot shows the alteration of biological processes related to immunity in the gut of mesalazine-treated mice with colitis. The size of the dot represents the number of DEGs. The color intensity of the dots represents the significance of the biology processes. (C) The rich factor plot showed the alteration of cell signaling pathways related to immunity in the gut of mesalazine-treated colitis mice. The size of the dots represents the number of DEGs. The color intensity of the dots represents the significance of the signaling pathways.
FIGURE 3
FIGURE 3
The gene network involved in the immunosuppressive effect of mesalazine on DSS-induced colitis. Ingenuity pathway analysis shows the contribution of different molecules in the immunosuppressive effect of mesalazine. The red symbol represents upregulated genes; the green shape represents downregulated genes.
FIGURE 4
FIGURE 4
In vivo effects of mesalazine treatment on DSS-induced colitis. (A) Hematoxylin and eosin staining show the structural changes including visible crypt abscess, inflammatory infiltration, and cytoclasis in DSS-induced colitis. These alterations were reversed by mesalazine treatment. (B) Mesalazine treatment relieved DSS-induced inflammatory cytokines including TNF-α, IL-1α, IL-6, and IL-8 in the colon samples via its anti-inflammation action.

References

    1. Amatya N., Garg A. V., Gaffen S. L. (2017). IL-17 signaling: the Yin and the Yang. Trends Immunol. 38 310–322. 10.1016/j.it.2017.01.006 - DOI - PMC - PubMed
    1. Bai B., Wu F., Ying K., Xu Y., Shan L., Lv Y., et al. (2021). Therapeutic effects of dihydroartemisinin in multiple stages of colitis-associated colorectal cancer. Theranostics 11 6225–6239. 10.7150/thno.55939 - DOI - PMC - PubMed
    1. Bopanna S., Ananthakrishnan A. N., Kedia S., Yajnik V., Ahuja V. (2017). Risk of colorectal cancer in Asian patients with ulcerative colitis: a systematic review and meta-analysis. Lancet Gastroenterol. Hepatol. 2 269–276. 10.1016/s2468-1253(17)30004-3 - DOI - PMC - PubMed
    1. Breschi A., Gingeras T. R., Guigó R. (2017). Comparative transcriptomics in human and mouse. Nat. Rev. Genet. 18 425–440. 10.1038/nrg.2017.19 - DOI - PMC - PubMed
    1. Chao G. Y., Wallis R. H., Marandi L., Ning T., Sarmiento J., Paterson A. D., et al. (2014). Iddm30 controls pancreatic expression of Ccl11 (Eotaxin) and the Th1/Th2 balance within the insulitic lesions. J. Immunol. 192 3645–3653. 10.4049/jimmunol.1302383 - DOI - PubMed

LinkOut - more resources