. 2021 Aug 25;8(8):210666.
doi: 10.1098/rsos.210666. eCollection 2021 Aug.

Effects of go/no-go training on food-related action tendencies, liking and choice

Affiliations

Effects of go/no-go training on food-related action tendencies, liking and choice

Loukia Tzavella et al. R Soc Open Sci. .

Abstract

Inhibitory control training effects on behaviour (e.g. 'healthier' food choices) can be driven by changes in affective evaluations of trained stimuli, and theoretical models indicate that changes in action tendencies may be a complementary mechanism. In this preregistered study, we investigated the effects of food-specific go/no-go training on action tendencies, liking and impulsive choices in healthy participants. In the training task, energy-dense foods were assigned to one of three conditions: 100% inhibition (no-go), 0% inhibition (go) or 50% inhibition (control). Automatic action tendencies and liking were measured pre- and post-training for each condition. We found that training did not lead to changes in approach bias towards trained foods (go and no-go relative to control), but we warrant caution in interpreting this finding as there are important limitations to consider for the employed approach-avoidance task. There was only anecdotal evidence for an effect on food liking, but there was evidence for contingency learning during training, and participants were on average less likely to choose a no-go food compared to a control food after training. We discuss these findings from both a methodological and theoretical standpoint and propose that the mechanisms of action behind training effects be investigated further.

Keywords: action tendencies; approach bias; choice; food; go/no-go training; liking.


Figures

Figure 2.
Figure 2.
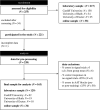
Flow diagram of recruitment and participant-level data exclusions. There were 255 individuals recruited and assessed for eligibility across laboratory sites and online via personal communication. Thirty-four participants were excluded after screening for not meeting the advertised inclusion/exclusion criteria and datasets were obtained from 221 participants. The online sample was recruited by the University of Bath and University of Exeter. One participant was excluded for providing incomplete data and 220 datasets were submitted for pre-processing and inspection. First, we examined performance in the go/no-go training task. There were no participants with a mean reaction time on no-signal trials (GoRT) greater than 3 s.d. from the group mean and there were no cases of consistently missed (i.e. default option of 50) responses on food rating trials. Six participants had a percentage of errors in signal trials that was greater than 3 s.d. from the group mean and six participants also had a percentage of correct responses in no-signal trials lower than 85%. Note that some participants met more than one exclusion criterion. Performance in the AAT was inspected and 50 participants were excluded as their percentage of errors in either the pre- or post-training blocks was greater than 25%. The final sample consisted of 163 participants.
Figure 1.
Figure 1.
Schematic diagram of the study procedure, go/no-go training and approach–avoidance tasks. (a) After completing the screening and initial survey, participants rated all food stimuli (liking) and proceeded to perform the pre-training AAT blocks. In the training phase, participants completed six blocks of go/no-go training. The post-training AAT blocks were then presented and followed by food liking ratings. At the end of the study, participants completed a food choice task and several questionnaires, in random order. (b) The go/no-go training paradigm involved go (no-signal) and no-go (signal) trials that occurred with equal probability. On go trials, participants had to respond within 1250 ms by pressing the ‘C’ and ‘M’ keys to indicate the picture location (left or right, respectively). On no-go trials, participants were instructed not to respond at all. The inter-trial interval (ITI) was 1250 ms. Food categories were randomly assigned to three conditions. Go foods were only paired with no-signal trials and no-go foods were always associated with signal trials. Control foods were presented in both signal and no-signal trials (50 : 50). (c) In the AAT, participants were asked to respond according to the format of the presented picture (portrait or landscape). Response-format assignments were approximately counterbalanced across participants. As an example, on approach trials, a participant would have to pull the mouse towards them when the picture was in the portrait format (approach trial) and push it away from them when the picture was in the landscape format (avoid trial). Push and pull actions were paired with visual feedback, that is, zoom-out and zoom-in effects, respectively. The maximum reaction time (maxRT) was 1500 ms and the ITI was set to 500 ms. Participants clicked on a central ‘X’ to begin a trial (self-timed start).
Figure 3.
Figure 3.
Raincloud plot of the approach–avoidance bias scores pre- and post-training across training conditions. There were no differences between the sample mean changes in approach–avoidance bias scores for no-go and go foods compared to control foods, as shown by the dotted lines. At a closer inspection, individual bias scores do not seem to be clustered around the positive end of the distribution as it would be expected for appetitive energy-dense foods, but actually show less dispersion around zero. Exploratory analyses confirmed that baseline bias scores for go, no-go and control foods did not statistically deviate from zero (see Baseline approach bias scores). The ‘split-half violin’ elements in the plot show smoothed distributions and boxplot vertical lines represent the range, excluding outliers based on IQR. Square boxes have been added to depict the sample means, connected with dotted lines across training conditions.
Figure 4.
Figure 4.
Raincloud plot of the mean liking ratings pre- and post-training across training conditions. Liking ratings were registered on a VAS ranging from 0 to 100. There appears to be a general trend of devaluation across training conditions which could be attributed to regression to the mean (but see Discussion), although the plot shows that on average, participants did not like the taste of the foods ‘very much’ (e.g. greater than 80). Given that the foods were not selected based on participants’ ratings and we used a fixed set of stimuli, we consider that they were adequately appetitive. The ‘split-half violin’ elements in the plot show smoothed and trimmed distributions and boxplot vertical lines represent the range, excluding outliers based on the IQR. Square boxes have been added to depict the sample means, connected with dotted lines across training conditions.

References

    1. World Health Organization. 2018Obesity and overweight. See https://www.who.int/news-room/fact-sheets/detail/obesity-and-overweight (accessed 24 July 2019).
    1. Hofmann W, Friese M, Strack F. 2009Impulse and self-control from a dual-systems perspective. Perspect. Psychol. Sci. 4, 162-176. (10.1111/j.1745-6924.2009.01116.x) - DOI - PubMed
    1. Strack F, Deutsch R. 2004Reflective and impulsive determinants of social behavior. Pers. Soc. Psychol. Rev. 8, 220-247. (10.1207/s15327957pspr0803_1) - DOI - PubMed
    1. Kakoschke N, Kemps E, Tiggemann M. 2017The effect of combined avoidance and control training on implicit food evaluation and choice. J. Behav. Ther. Exp. Psychiatry 55, 99-105. (10.1016/j.jbtep.2017.01.002) - DOI - PubMed
    1. Hofmann W, Friese M, Wiers RW. 2008Impulsive versus reflective influences on health behavior: a theoretical framework and empirical review. Health Psychol. Rev. 2, 111-137. (10.1080/17437190802617668) - DOI

LinkOut - more resources