

Isolating individual polarization effects from the Mueller matrix: comparison of two non-decomposition techniques
- PMID: 34457377
- PMCID: PMC8367253
- DOI: 10.1364/BOE.426637
Isolating individual polarization effects from the Mueller matrix: comparison of two non-decomposition techniques
Abstract
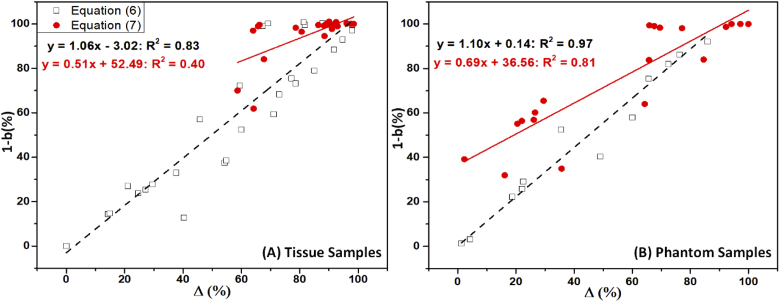
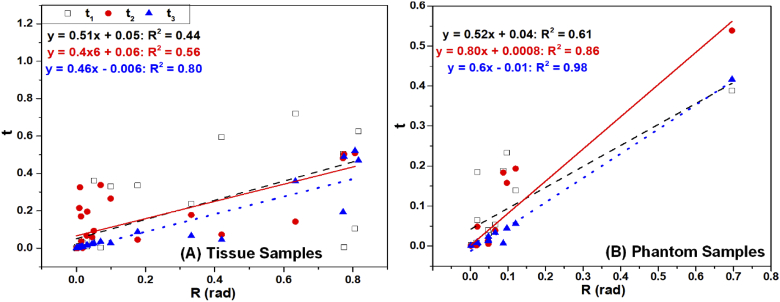
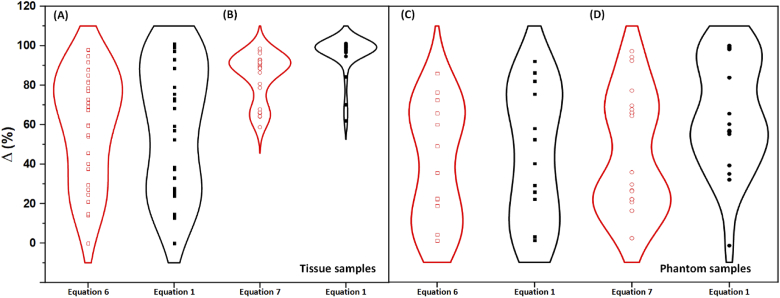
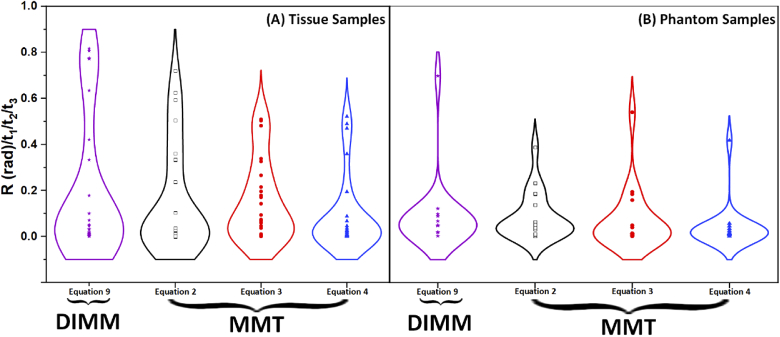
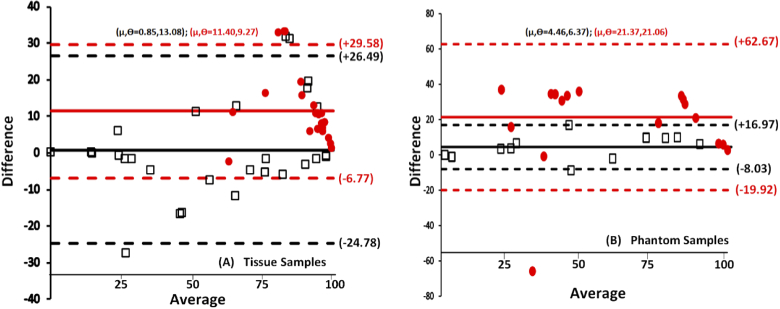
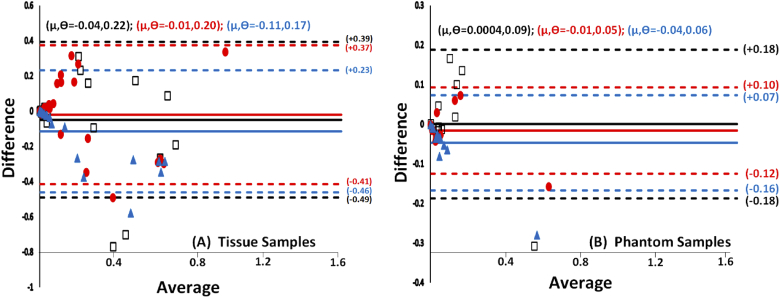
The prevailing formalisms for isolating individual polarization effects from the experimental Mueller matrix M can be broadly divided into two categories; decomposition of M to derive the individual optical effects and directly associating the individual optical effects to specific elements of M (i.e., non-decomposition techniques). Mueller matrix transformation (MMT) and direct interpretation of Mueller matrix (DIMM) are two popular techniques of the latter category. In this study, these two non-decomposition techniques (i.e., MMT and DIMM) are compared in a detailed quantitative analysis comprising of tissues (n = 53) and phantom (n = 45) samples. In particular, two commonly investigated polarimetric variables (i.e., depolarization and retardance) were calculated from the experimentally measured M using both the non-decomposition (i.e., MMT and DIMM) techniques. The comparison carried out with scatter plots (integrated with the correlation coefficients), violin plots and Bland and Altman plots revealed better agreement of depolarization-related variables (as compared to the retardance) between the two non-decomposition techniques. The comparative analyses presented here would be beneficial for the interpretation of polarimetric variables and optical characterization of turbid media.
© 2021 Optical Society of America under the terms of the OSA Open Access Publishing Agreement.
Conflict of interest statement
The authors declare that there are no conflicts of interest related to this article and no commercial relationships of the authors relevant to the topic of the study.
Figures
Similar articles
-
Comparative study of differential matrix and extended polar decomposition formalisms for polarimetric characterization of complex tissue-like turbid media.J Biomed Opt. 2012 Oct;17(10):105006. doi: 10.1117/1.JBO.17.10.105006. J Biomed Opt. 2012. PMID: 23064484
-
Polar decomposition of 3 x 3 Mueller matrix: a tool for quantitative tissue polarimetry.Opt Express. 2006 Oct 2;14(20):9324-37. doi: 10.1364/oe.14.009324. Opt Express. 2006. PMID: 19529316
-
Mueller matrix decomposition for extraction of individual polarization parameters from complex turbid media exhibiting multiple scattering, optical activity, and linear birefringence.J Biomed Opt. 2008 Jul-Aug;13(4):044036. doi: 10.1117/1.2960934. J Biomed Opt. 2008. PMID: 19021363
-
Polarization-resolved Stokes-Mueller imaging: a review of technology and applications.Lasers Med Sci. 2019 Sep;34(7):1283-1293. doi: 10.1007/s10103-019-02752-1. Epub 2019 Mar 4. Lasers Med Sci. 2019. PMID: 30830559 Review.
-
A Review on PolSAR Decompositions for Feature Extraction.J Imaging. 2024 Mar 24;10(4):75. doi: 10.3390/jimaging10040075. J Imaging. 2024. PMID: 38667973 Free PMC article. Review.
Cited by
-
Assessment of tissue pathology using optical polarimetry.Lasers Med Sci. 2022 Apr;37(3):1907-1919. doi: 10.1007/s10103-021-03450-7. Epub 2021 Oct 23. Lasers Med Sci. 2022. PMID: 34689277
-
Polarization and Orbital Angular Momentum of Light in Biomedical Applications: feature issue introduction.Biomed Opt Express. 2021 Sep 14;12(10):6255-6258. doi: 10.1364/BOE.442828. eCollection 2021 Oct 1. Biomed Opt Express. 2021. PMID: 34745733 Free PMC article.
References
-
- Shukla P., Awasthi A., Pandey P. K., Pradhan A., “Discrimination of normal and dysplasia in cervix tissue by Mueller matrix analysis,” in SPIE Proceedings Biomedical Applications of Light Scattering II, 2008, vol. 6864, p. 686417.
-
- Pierangelo A., Manhas S., Benali A., Fallet C., Totobenazara J. L., Antonelli M. R., Novikova T., Gayet B., Martino A., Validire P., “Multispectral Mueller polarimetric imaging detecting residual cancer and cancer regression after neoadjuvant treatment for colorectal carcinomas,” J. Biomed. Opt. 18(4), 046014 (2013).10.1117/1.JBO.18.4.046014 - DOI - PubMed
LinkOut - more resources
Full Text Sources