. 2021 Aug 12:9:698292.
doi: 10.3389/fcell.2021.698292. eCollection 2021.

3D Organoid Culture From Adult Salivary Gland Tissues as an ex vivo Modeling of Salivary Gland Morphogenesis

Affiliations

3D Organoid Culture From Adult Salivary Gland Tissues as an ex vivo Modeling of Salivary Gland Morphogenesis

Donghyun Kim et al. Front Cell Dev Biol. .

Abstract

Lumen formation of salivary glands has been investigated using in vivo or ex vivo rudiment culture models. In this study, we used a three-dimensional (3D) salivary gland organoid culture system and demonstrated that lumen formation could be recapitulated in mouse SMG organoids. In our organoid culture system, lumen formation was induced by vasoactive intestinal peptide and accelerated by treatment with RA. Furthermore, lumen formation was observed in branching duct-like structure when cultured in combination of fibroblast growth factors (FGF) in the presence of retinoic acid (RA). We suggest RA signaling-mediated regulation of VIPR1 and KRT7 as the underlying mechanism for lumen formation, rather than apoptosis in the organoid culture system. Collectively, our results support a fundamental role for RA in lumen formation and demonstrate the feasibility of 3D organoid culture as a tool for studying salivary gland morphogenesis.

Keywords: lumen formation; morphogenesis; organoid culture; retinoic acid; salivary gland organoid; stem cells; vasoactive intestinal peptide.


Conflict of interest statement

The authors declare that the research was conducted in the absence of any commercial or financial relationships that could be construed as a potential conflict of interest.

Figures

FIGURE 1
FIGURE 1
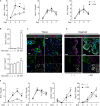
Recapitulation of lumen formation during SMG development in a mouse SMG organoid culture. (A) Organoid growth from single cells was monitored at each time point. Black arrows indicate internal lumen formation as shown in the bright-field microscopy images. Scale bar indicates 100 μm. (B) SMG organoids were harvested at each time point and subjected to whole-mount immunofluorescence microscopy for the evaluation of KRT5 (white), KRT19 (green), and KRT7 (red) expressions from days 0 to 9. Up to day 5, images were obtained through maximum intensity projection. From days 7 to 9, single images were obtained from z-stack. Micro-lumens were denoted with white asterisks. Scale bars indicate 20 μm. Nuclei were counterstained with DAPI (blue). (C) KRT5 (white), CD133 (green), and KRT7 (red) expressions on day 4. Scale bars indicate 50 μm. Nuclei were counterstained with DAPI (blue). (D) The organoids were treated with 200 nM of VIP on day 2, and lumen enlargement was observed on day 4. Black arrows indicate internal lumen formation. Scale bars indicate 100 μm. (E) The proportion of organoids with lumen were determined (n = 3). The results are expressed as the mean ± SD. **p < 0.01. (F) SMG organoids were harvested on days 5 and 9, and 200 nM of VIP was treated on the last 1 day. Organoid were subjected to immunofluorescence staining for KRT5 (green) and KRT7 (red). Scale bars indicate 50 μm. Nuclei were counterstained with DAPI (blue). All experiments were performed three times independently.
FIGURE 2
FIGURE 2
Retinoic acid promotes lumen formation in SMG organoids. (A) SMG organoids were cultured with different doses of RA and treated with 200 nM VIP on day 4. Microscopic images of lumen formation were obtained on day 6. Scale bars indicate 100 μm. (B) The proportion of organoids containing internal lumen were calculated, followed by statistical analysis (n = 3). Results are expressed as the mean ± SD. ***p < 0.001. (C–E) SMG organoids were cultured with or without RA in combination with 1 nM bFGF and 5 nM FGF10 throughout the culturing period. At day 9, organoids were either unstimulated or stimulated with VIP for 1 day. (C) Branching ducts were observed with brightfield microscopy. Black arrows indicate formation of lumens near end buds. Scale bars indicate 100 μm. (D) Harvested organoid were subjected to H&E staining to observe lumen formation in branching ducts (red arrows). Scale bars indicate 100 μm. (E) Organoids were subjected to immunofluorescence staining for KRT5 (green) and KRT7 (red). Scale bars indicate 50 μm. Nuclei were counterstained with DAPI (blue). All experiments were performed three times independently.
FIGURE 3
FIGURE 3
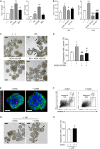
Retinoic acid induces Vipr1 gene expression. (A) SMG organoids were treated with or without RA (300 nM) for the indicated time. After harvesting, the organoids were subjected to qRT-PCR to evaluate gene expression associated with VIP signaling (n = 4). (B) SMG organoids were treated with varying doses of RA for 7 days and subjected to qRT-PCR for the evaluation of gene expression of Vipr1 and Rarb, a positive control, for RA-mediated signaling (n = 4). (C) Expression of VIPR1 (green) in mouse SMG tissues (left) was assessed by co-staining with KRT5 (magenta, left), KRT7 (cyan, left), ACTA2 (magenta, right), and MIST1 (cyan, right). Nuclei were counterstained with DAPI (white) and each single channel image was placed below. Scale bars indicate 20 μm. (D) The mouse SMG organoids cultured with (bottom) or without RA (top) were subjected to immunofluorescence for the evaluation of VIPR1 (green), KRT5 (magenta), and KRT7 (cyan) expressions. Nuclei were counterstained with DAPI (white), and each single channel image was placed below. Scale bars indicate 50 μm. (E) The expression of several salivary gland markers in organoids treated with or without RA were analyzed using qRT-PCR at the indicated time points (n = 4). Results are expressed as the mean ± SEM. *p < 0.05, **p < 0.01, and ***p < 0.001. All experiments were performed at least three times independently.
FIGURE 4
FIGURE 4
RAR activation induces lumen formation in SMG organoids. (A) SMG organoids were cultured with 300 nM RA, TTNPB (RAR agonist), or bexarotene (RXR agonist) for 7 days and subjected to qRT-PCR for the detection of Vipr1 and Krt7 expression (n = 4). (B) SMG organoids were treated with RA (300 nM), RA + 3 μM AGN-193109 (RAR antagonist), or RA + 3 μM HX (HX-531, RXR antagonist) throughout the culturing period and subjected to qRT-PCR for the detection of Vipr1 and Krt7 expression (n = 4). (C–D) SMG organoids were treated with RA (300 nM), AGN-193109 (3 μM), or both. The organoids were treated with VIP (200 nM) on day 2 for lumen formation. After 3 days, lumen formation was observed via microscopic images (C). Black arrows indicate organoids containing visible lumen. The proportion of organoids with lumen were calculated and statistically analyzed (D) (n = 3). Scale bars indicate 100 μm in (C). (E) SMG organoids were treated with 50μM z-VAD-FMK, a pan-caspase inhibitor, for 2 days, followed by whole-mount immunostaining with antibodies against CC3 (cleaved caspase-3) and TJP1 (ZO-1). DAPI (blue) was used for counterstaining the nucleus. Scale bars indicate 20 μm. (F) Apoptotic cell death (Annexin-V+ PI) in SMG organoids treatedwith or without zVAD was examined using flow cytometry. (G) Representative bright-field images of organoids with lumen were obtained on day 5. Black arrows indicate organoids containing visible lumen. Scale bars indicate 100 μm. (H) The proportion of organoids with lumen were calculated (n = 3). Results are expressed as the mean ± SEM. *p < 0.05, **p < 0.01, and ***p < 0.001 when compared to the non-treated groups. #p < 0.05, ##p < 0.01, and ###p < 0.001 when compared to the RA-treated groups. All experiments were performed three times independently.

Similar articles

Cited by

References

    1. Abashev T. M., Metzler M. A., Wright D. M., Sandell L. L. (2017). Retinoic acid signaling regulates Krt5 and Krt14 independently of stem cell markers in submandibular salivary gland epithelium. Dev. Dyn. 246 135–147. 10.1002/dvdy.24476 - DOI - PMC - PubMed
    1. Clevers H. (2016). Modeling Development and Disease with Organoids. Cell 165 1586–1597. 10.1016/j.cell.2016.05.082 - DOI - PubMed
    1. Cunningham T. J., Duester G. (2015). Mechanisms of retinoic acid signalling and its roles in organ and limb development. Nat. Rev. Mol. Cell Biol. 16 110–123. 10.1038/nrm3932 - DOI - PMC - PubMed
    1. Cunningham T. J., Zhao X., Sandell L. L., Evans S. M., Trainor P. A., Duester G. (2013). Antagonism between retinoic acid and fibroblast growth factor signaling during limb development. Cell Rep. 3 1503–1511. 10.1016/j.celrep.2013.03.036 - DOI - PMC - PubMed
    1. Dawson M. I., Xia Z. (2012). The retinoid X receptors and their ligands. Biochim. Biophys. Acta 1821 21–56. - PMC - PubMed