

Comparison of machine learning techniques to handle imbalanced COVID-19 CBC datasets
- PMID: 34458574
- PMCID: PMC8372002
- DOI: 10.7717/peerj-cs.670
Comparison of machine learning techniques to handle imbalanced COVID-19 CBC datasets
Abstract
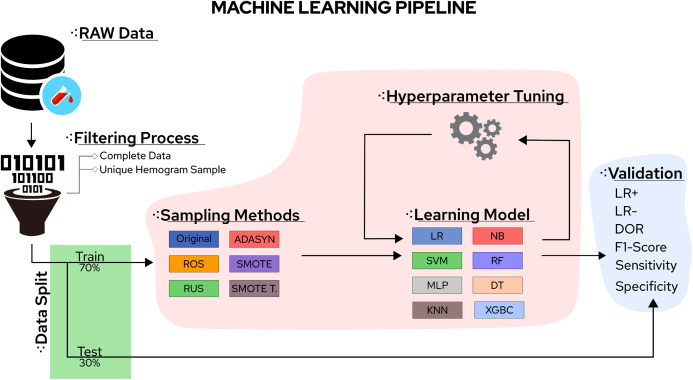
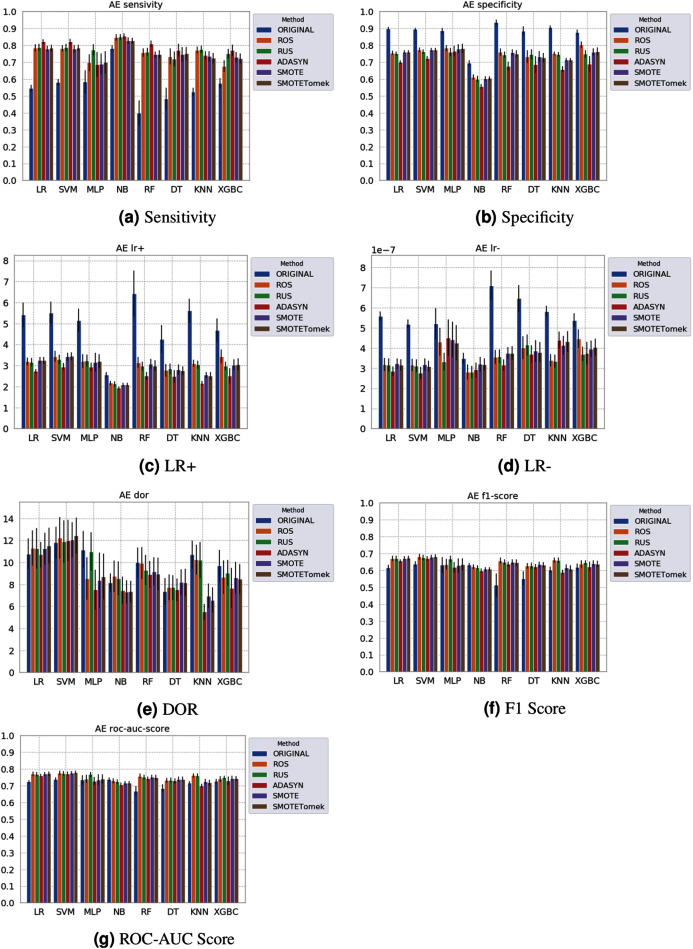
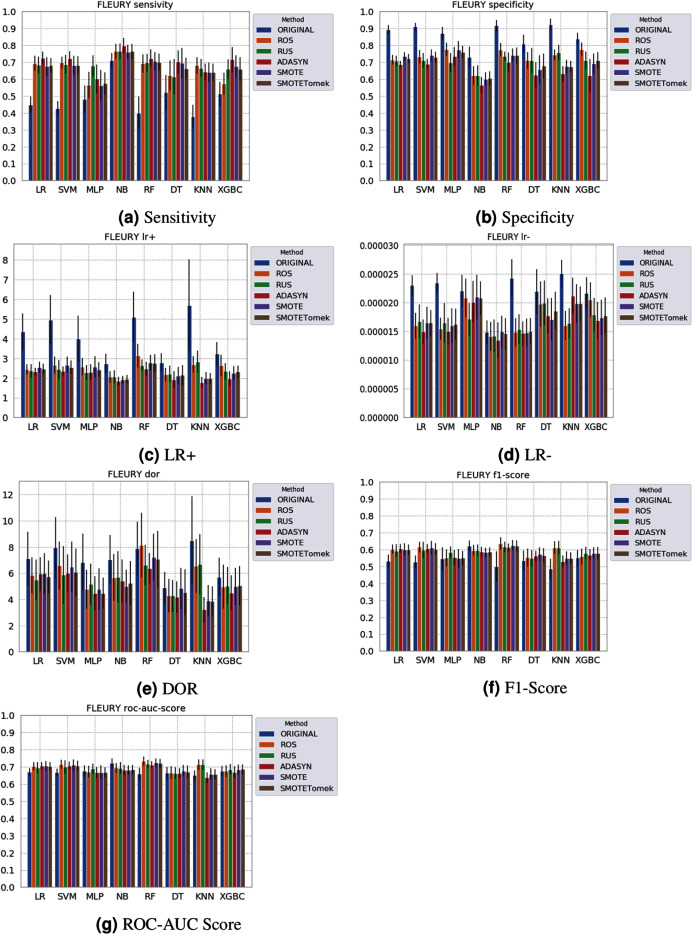
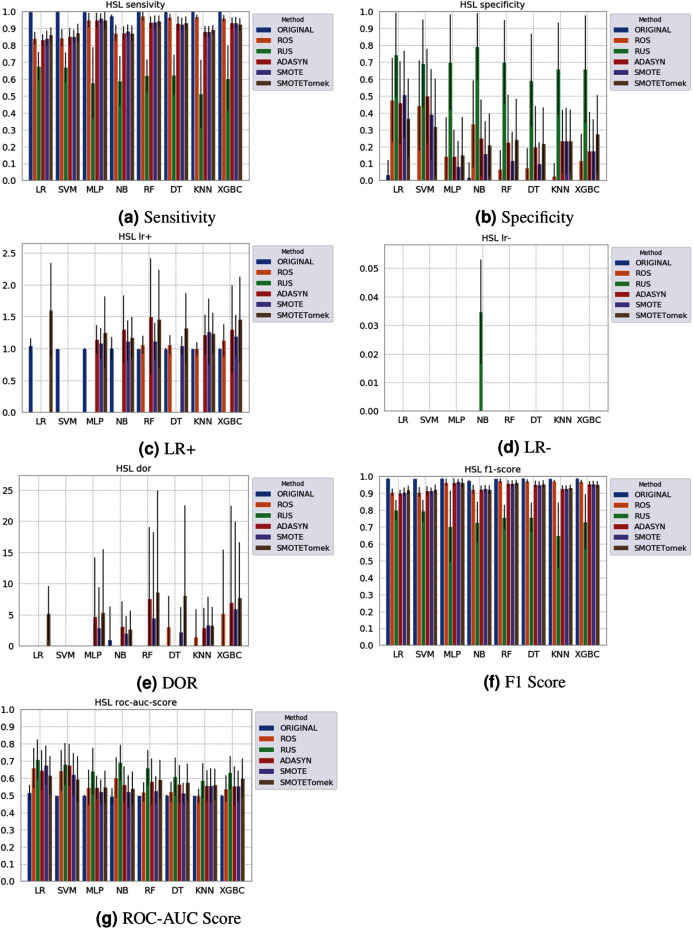
The Coronavirus pandemic caused by the novel SARS-CoV-2 has significantly impacted human health and the economy, especially in countries struggling with financial resources for medical testing and treatment, such as Brazil's case, the third most affected country by the pandemic. In this scenario, machine learning techniques have been heavily employed to analyze different types of medical data, and aid decision making, offering a low-cost alternative. Due to the urgency to fight the pandemic, a massive amount of works are applying machine learning approaches to clinical data, including complete blood count (CBC) tests, which are among the most widely available medical tests. In this work, we review the most employed machine learning classifiers for CBC data, together with popular sampling methods to deal with the class imbalance. Additionally, we describe and critically analyze three publicly available Brazilian COVID-19 CBC datasets and evaluate the performance of eight classifiers and five sampling techniques on the selected datasets. Our work provides a panorama of which classifier and sampling methods provide the best results for different relevant metrics and discuss their impact on future analyses. The metrics and algorithms are introduced in a way to aid newcomers to the field. Finally, the panorama discussed here can significantly benefit the comparison of the results of new ML algorithms.
Keywords: Covid; Data mining; Hemogram; Imbalanced datasets; Machine learning.
© 2021 Dorn et al.
Conflict of interest statement
The authors declare that they have no competing interests.
Figures

Similar articles
-
QCovSML: A reliable COVID-19 detection system using CBC biomarkers by a stacking machine learning model.Comput Biol Med. 2022 Apr;143:105284. doi: 10.1016/j.compbiomed.2022.105284. Epub 2022 Feb 12. Comput Biol Med. 2022. PMID: 35180500 Free PMC article.
-
Machine learning algorithms for outcome prediction in (chemo)radiotherapy: An empirical comparison of classifiers.Med Phys. 2018 Jul;45(7):3449-3459. doi: 10.1002/mp.12967. Epub 2018 Jun 13. Med Phys. 2018. PMID: 29763967 Free PMC article.
-
Role of biological Data Mining and Machine Learning Techniques in Detecting and Diagnosing the Novel Coronavirus (COVID-19): A Systematic Review.J Med Syst. 2020 May 25;44(7):122. doi: 10.1007/s10916-020-01582-x. J Med Syst. 2020. PMID: 32451808 Free PMC article.
-
Improved support vector machine classification for imbalanced medical datasets by novel hybrid sampling combining modified mega-trend-diffusion and bagging extreme learning machine model.Math Biosci Eng. 2023 Sep 15;20(10):17672-17701. doi: 10.3934/mbe.2023786. Math Biosci Eng. 2023. PMID: 38052532
-
Benchmarking of Machine Learning classifiers on plasma proteomic for COVID-19 severity prediction through interpretable artificial intelligence.Artif Intell Med. 2023 Mar;137:102490. doi: 10.1016/j.artmed.2023.102490. Epub 2023 Jan 18. Artif Intell Med. 2023. PMID: 36868685 Free PMC article. Review.
Cited by
-
Comparative performance of twelve machine learning models in predicting COVID-19 mortality risk in children: a population-based retrospective cohort study in Brazil.PeerJ Comput Sci. 2025 May 28;11:e2916. doi: 10.7717/peerj-cs.2916. eCollection 2025. PeerJ Comput Sci. 2025. PMID: 40567691 Free PMC article.
-
Comparing machine learning algorithms to predict COVID‑19 mortality using a dataset including chest computed tomography severity score data.Sci Rep. 2023 Jul 13;13(1):11343. doi: 10.1038/s41598-023-38133-6. Sci Rep. 2023. PMID: 37443373 Free PMC article.
-
Machine learning approaches to predict the need for intensive care unit admission among Iranian COVID-19 patients based on ICD-10: A cross-sectional study.Health Sci Rep. 2024 Sep 2;7(9):e70041. doi: 10.1002/hsr2.70041. eCollection 2024 Sep. Health Sci Rep. 2024. PMID: 39229475 Free PMC article.
-
Novel Biomarker Prediction for Lung Cancer Using Random Forest Classifiers.Cancer Inform. 2023 Apr 21;22:11769351231167992. doi: 10.1177/11769351231167992. eCollection 2023. Cancer Inform. 2023. PMID: 37113644 Free PMC article.
-
COVID-19 health data prediction: a critical evaluation of CNN-based approaches.Sci Rep. 2025 Mar 17;15(1):9121. doi: 10.1038/s41598-025-92464-0. Sci Rep. 2025. PMID: 40097568 Free PMC article.
References
-
- Alves MA, Castro GZ, Oliveira BAS, Ferreira LA, Ramrez JA, Silva R, Guimarães FG. Explaining machine learning based diagnosis of COVID-19 from routine blood tests with decision trees and criteria graphs. Computers in Biology and Medicine. 2021;132:104335. doi: 10.1016/j.compbiomed.2021.104335. - DOI - PMC - PubMed
LinkOut - more resources
Full Text Sources
Miscellaneous