. 2021 Jul 24:11:100123.
doi: 10.1016/j.mtbio.2021.100123. eCollection 2021 Jun.

Multiplexed bio-imaging using cadmium telluride quantum dots synthesized by mathematically derived process parameters in a continuous flow active microreactor

Affiliations

Multiplexed bio-imaging using cadmium telluride quantum dots synthesized by mathematically derived process parameters in a continuous flow active microreactor

S Pandey et al. Mater Today Bio. .

Abstract

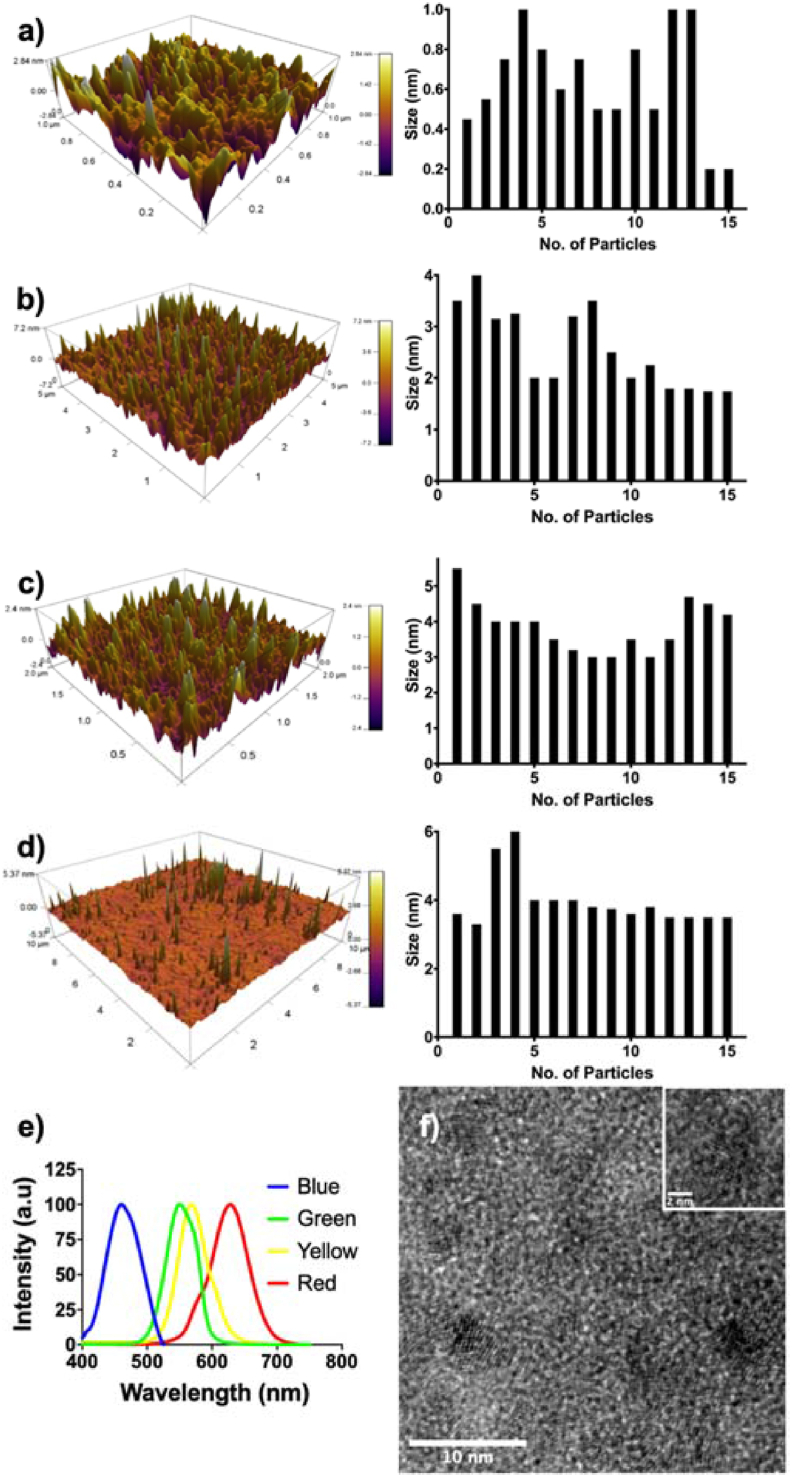
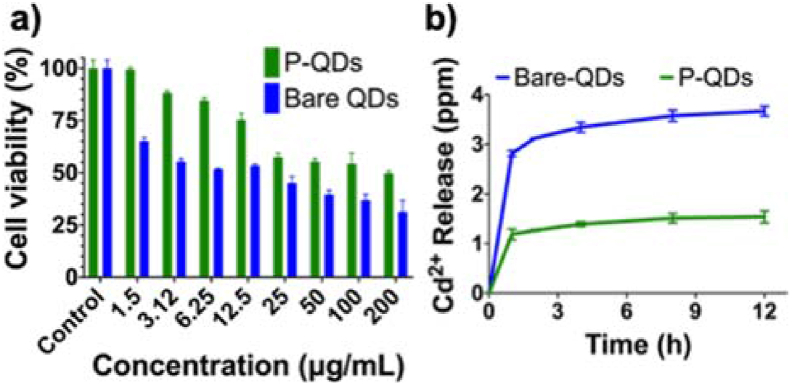
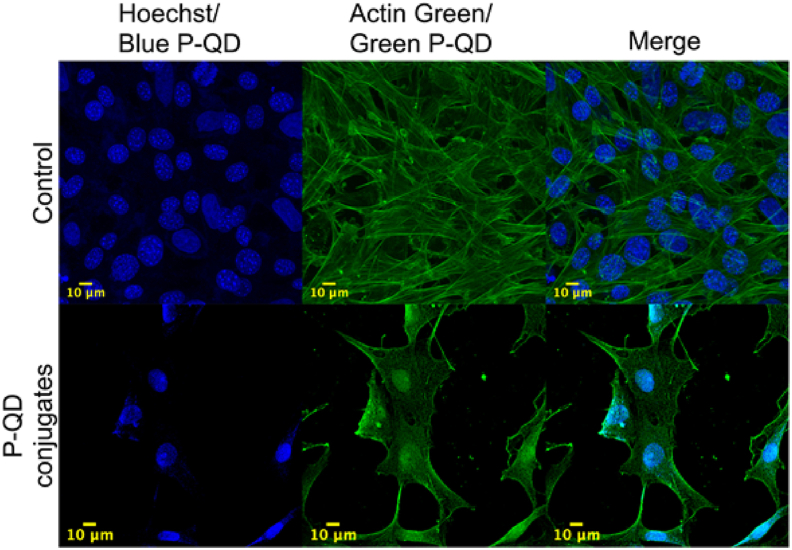
Quantum dots (QDs) are semiconductor nanocrystals with unique size-tunable emissions. To obtain a precise emission spectrum, monodispersity in size is imperative, which is achieved by controlling the reaction kinetics in a continuous flow of active microreactors. Further, a multivariate approach (dimensional analysis) is employed to impose stringent control on the reaction process resulting in monodispersed preparation of cadmium telluride (CdTe) quantum dots. Dimensional analysis knits multiple variables into a dimensionless mathematical form which not only predicts parameters precisely to obtain narrow size tunability but also guarantees reproducibility in synthesis. Analytical, structural, and optical characterization of the microreactor synthesized polydimethylsiloxane (PDMS) coated CdTe QDs reveal quantum efficient (61.5%), photostable (44%), and biocompatible nanocrystals of 5-15 nm. Further, PDMS-coated QDs (P-QDs) are conjugated with organelle-specific antibodies/biomarkers for in-vitro imaging in NIH 3T3 cells. Likewise, proliferating cell nuclear antigen (PCNA) and anti-myosin (MF20), cardiomyocytes antibodies are conjugated with P-QDs (red and green, respectively) to image the zebrafish's cardiac tissue. Antibodies tagged with quantum dots are imaged simultaneously using confocal microscopy. Thus, multiplexed bio-imaging of in-vitro and zebrafish tissue is demonstrated successfully. The results indicate the suitability of continuous flow active microreactor in conjunction with the mathematical prediction of process parameters to synthesize reproducibly monodispersed and quantum efficient QDs.

Keywords: Dimensional analysis; Fluorescent nanocrystals; Microreactor synthesis; Multiplexed imaging; PDMS.


Conflict of interest statement

The authors declare that they have no known competing financial interests or personal relationships that could have appeared to influence the work reported in this paper.

Figures

Image 1
Graphical abstract
Fig. 1
Fig. 1
PDMS microreactor used to synthesize QDs: a) Schematic along with dimensions b) Optical image. c) Schematic of the setup. d) Chemical reactions involved in the synthesis of PDMS coated CdTe quantum dots.
Fig. 2
Fig. 2
AFM 3D topographic images and size distribution graph different sized QDs of a) 0.5 nm; b) 3.32 nm; c) 3.34 nm; and d) 3.92 nm; e) Photoluminescence spectra of all the QDs; f) TEM of green-colored CdTe nanoparticles are seen in a size range of 3–5 nm (atomic planes are visible in the inset image).
Fig. 3
Fig. 3
a) FT-IR spectra of bare CdTe and PDMS coated CdTe QDs. b) TEM showing uniformly dispersed P-QDs with the size of ~3–5 nm. The inset of the image shows an enlarged image revealing atomic planes. c) Photoluminescence spectra recorded at an excitation wavelength of 320 nm. The background picture shows different colored P-QDs.
Fig. 4
Fig. 4
a) Cytotoxicity studies with NIH 3T3 cells indicate biocompatibility of P-QDs at a dose of 6.25 μg/mL b) Time-dependent ion leaching studies show low Cd2+ release from P-QDs as compared to bare counterparts.
Fig. 5
Fig. 5
Confocal microscopic images of conventional and microreactor synthesized QDs internalized in HepG2 cells. DAPI is used for staining the nucleus. The excitation wavelength used for visualizing DAPI and QDs was 405 nm. Scale bar: 50 μm; Magnification: 63×.
Fig. 6
Fig. 6
Confocal microscopic images of NIH 3T3 cells. Hoechst 33342 (360/460) and Actin Green (495/518) were used as a control to stain the nucleus and cytoskeleton, respectively, and captured sequentially. Blue and green QDs were conjugated with SMAR-1 nucleus-specific protein and smooth muscle actin antibodies to target and cytoskeleton, respectively. The bottom panel was captured simultaneously at an excitation wavelength of 405 nm. Scale bar: 10 μm; Magnification: 63×.
Fig. 7
Fig. 7
Confocal images of sagittal cardiac sections showing cardiomyocytes and proliferating cells in wild-type zebrafish cardiac tissue. The dye control panel shows Alexa Fluor 488-phalloidin and Alexa Fluor 647-phalloidin conjugated with primary antibodies of MF20 and PCNA, respectively. The overlay image shows Alexa Fluor 555 Phalloidin (Green) and Alexa Fluor 647-phalloidin conjugated with PCNA primary antibody. A comparison of fluorescence intensities of QDs and dyes analyzed using ImageJ software is shown as a bar chart. PQDs control panel represents confocal images stained with unconjugated green and red P-QDs as a negative control. Green P-QDs conjugated MF20, and red P-QDs conjugated PCNA recognize cardiomyocytes and nuclei undergoing DNA synthesis. Arrowheads point to the proliferating cells in the injury region (for dye control and QDs). The yellow dotted line (for dye control and QDs) demarcates the healthy cardiac tissue from the cryo-injured region. The images with the dye were captured after 4 dpci, whereas those with QDs were imaged after 7 dpci. Scale bar: 50 μm; Magnification: 63×.

References

    1. Koole R., Groeneveld E., Vanmaekelbergh D., Meijerink A., de Mello Donegá C. Nanoparticles. Springer Berlin Heidelberg; Berlin, Heidelberg: 2014. Size effects on semiconductor nanoparticles; pp. 13–51. - DOI
    1. Iga A.M., Robertson J.H.P., Winslet M.C., Seifalian A.M. Clinical potential of quantum dots. J. Biomed. Biotechnol. 2007;2007:1–10. doi: 10.1155/2007/76087. - DOI - PMC - PubMed
    1. Pandey S., Bodas D. High-quality quantum dots for multiplexed bioimaging: a critical review. Adv. Colloid Interface Sci. 2020;278:102137. doi: 10.1016/j.cis.2020.102137. - DOI - PubMed
    1. Girija Aswathy R., Sivakumar B., Brahatheeshwaran D., Ukai T., Yoshida Y., Maekawa T., Kumar S.D. Biocompatible fluorescent jelly quantum dots for bioimaging. Mater. Express. 2011;1:291–298. doi: 10.1166/mex.2011.1045. - DOI
    1. Cui H., Wang R., Zhou Y., Shu C., Song F., Zhong W. Dual-function fluorescent probe for cancer imaging and therapy. Luminescence. 2016;31:813–820. doi: 10.1002/bio.3028. - DOI - PubMed