Review
. 2021 Mar 31;2(3):796-814.
doi: 10.1039/d1cb00014d. eCollection 2021 Jun 1.

Fluorescent proteins of the EosFP clade: intriguing marker tools with multiple photoactivation modes for advanced microscopy

Affiliations
Review

Fluorescent proteins of the EosFP clade: intriguing marker tools with multiple photoactivation modes for advanced microscopy

Karin Nienhaus et al. RSC Chem Biol. .

Abstract

Optical fluorescence microscopy has taken center stage in the exploration of biological structure and dynamics, especially on live specimens, and super-resolution imaging methods continue to deliver exciting new insights into the molecular foundations of life. Progress in the field, however, crucially hinges on advances in fluorescent marker technology. Among these, fluorescent proteins (FPs) of the GFP family are advantageous because they are genetically encodable, so that live cells, tissues or organisms can produce these markers all by themselves. A subclass of them, photoactivatable FPs, allow for control of their fluorescence emission by light irradiation, enabling pulse-chase imaging and super-resolution microscopy. In this review, we discuss FP variants of the EosFP clade that have been optimized by amino acid sequence modification to serve as markers for various imaging techniques. In general, two different modes of photoactivation are found, reversible photoswitching between a fluorescent and a nonfluorescent state and irreversible green-to red photoconversion. First, we describe their basic structural and optical properties. We then summarize recent research aimed at elucidating the photochemical processes underlying photoactivation. Finally, we briefly introduce various advanced imaging methods facilitated by specific EosFP variants, and show some exciting sample applications.


Conflict of interest statement

There are no conflicts of interest to declare.

Figures
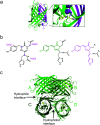
Fig. 1
Fig. 1. Overall structure of EosFP, a GFP-type protein. (a) Each monomer folds into an eleven-strand β-barrel, with the ends closed by loops and short α-helical structures. An α-helix running along its axis is interrupted by the chromophore generated from the tripeptide His62-Tyr63-Gly64. It is displayed in stick representation in the barrel and as a close-up. The N- and C-terminal fractions of the β-can that result from cleavage of the EosFP polypeptide chain upon green-to-red photoconversion are colored in magenta and green, respectively. (b) Chromophore-forming tripeptide (left, Cα atoms marked with magenta dots) and mature green and red chromophores (right, conjugated π-systems colored in green and red, respectively). (c) Tetrameric arrangement of protomers A–D, showing the hydrophilic AC and BD interfaces and the hydrophobic CD interface.
Fig. 2
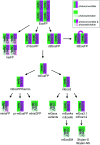
Fig. 2. Evolutionary tree of photoactivatable EosFP. The oligomerization state is represented by the number of protein depictions, the background color encodes the photoactivation mode (photoconvertible, green/magenta; photoswitchable, green/light green; photoconvertible and photoswitchable, green/light green/magenta/light magenta).
Fig. 3
Fig. 3. Genetic engineering of EosFP. Protomers are shown in cartoon representation; mutated residues are depicted in van der Waals representation, using the same colors as for the list of engineered variants below (with sequence changes specified in parentheses). (a) Modifications of EosFP to obtain monomeric mEosFP (red), the thermostable mEosFPthermo and the primable pr-mEosFP variants (orange), and mIrisFP (magenta). (b) Additional modifications of mEosFP to obtain mEos2 (magenta), mEos3.1 and mEos3.2 (blue) and mEos4a and mEos4b (orange).
Fig. 4
Fig. 4. Optical absorption data of mEosFPthermo in the pH range 3–10. (a) Absorption spectra of the green chromophore; (b) absorption spectra of the red chromophore. The line colors in the two panels vary from (a) black to green and (b) black to red to indicate increasing sample pH. Spectra at pH 7.4 are plotted in blue. (c and d) Normalized peak absorption of the A (open symbols) and B (closed symbols) bands of the (c) green and (d) red chromophores. Fits with the Hendersson–Hasselbalch relation, yielding (c) pK = 5.3 and (d) pK = 5.8, are included as solid lines.
Fig. 5
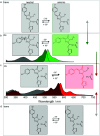
Fig. 5. Isomerization and protonation states of the EosFP-type chromophore. (a) Neutral (left) and anionic (right) green trans chromophores. (b) Neutral (left, with arrows indicating isomerization around the phenoxy (P) and imidazolinone (I) bonds of the methene bridge) and anionic (right) green cis chromophores. Non-fluorescent and fluorescent species are depicted in grey and green, respectively. Absorption and emission spectra are shown below. Grey: A absorption bands of the neutral cis (and/or trans) chromophores; dark green: B absorption bands of the anionic (cis and/or trans) chromophores; bright green: emission spectrum of the anionic cis species. Cistrans isomerization is reversible, as indicated by the grey-green double-headed arrow on the right. (c) Neutral (left) and anionic (right) red-emitting cis chromophores. Absorption and emission spectra are plotted below (grey: A absorption bands; red: B absorption bands; bright red: emission). Green-to-red photoconversion is irreversible, as indicated by the green-red arrow on the right. (d) Neutral (left) and anionic (right) red trans chromophores. Cistrans isomerization is reversible, as indicated by the grey-red double-headed arrow on the right. Adapted from ref. with permission from IOP Publishing, copyright 2016.
Fig. 6
Fig. 6. Transitions between EosFP-type chromophores. (a) Green (green box) and red (red box) chromophore states. C, cis. T, trans. Superscripts indicate the protonation state (H, protonated; −, deprotonated). Colored arrows represent light-induced transitions: 405 nm (violet), 473 or 488 nm (blue), 532 or 561 nm (green). Grey arrows indicate the pH-dependent ground state equilibria. (b) Absorption spectra of green and red pr-mEosFP, with absorption bands (A, B, S0–S2) labeled in the corresponding colors. Wavelengths of photoactivating laser irradiation are indicated by arrows (color-coding as in panel (a)).
Fig. 7
Fig. 7. Application of EosFP and variants in pulse-chase experiments. (a) Cell tracking. The mRNA of tetrameric EosFP was microinjected into a Xenopus laevis oocyte, so that all descendant cells express the marker as shown for stage 2 (two cells). At stage 3 (four cells), EosFP molecules in one cell were selectively photoconverted to the red state and the descendant cells were tracked over time. (b) Organelle tracking. Mitochondria in rabbit kidney cells were labeled with tdEosFP fused to a mitochondrial targeting signal. After photoconversion in the region marked by the violet square by focused 405 nm irradiation, the red-labeled markers were followed over time. (c) Protein tracking. Parts of the cytoskeleton of a HeLa cell are highlighted by RITA-mEosFPthermo. After photoconversion of the FPs in the region marked by the violet circle at time zero, red-emitting RITA proteins appeared within 20 s in the region marked by the white square in the leftmost image (see close-ups at 0, 20 and 40 s on the right). Adapted from ref. with permission from Wiley-VCH, copyright 2011.
Fig. 8
Fig. 8. Schematic depictions of SMLM. The fluorescence emission properties of the inactive (“off”) and active (“on”) chromophore species are indicated by the color code of the lettering. Grey: dark, non-emitting; green: green-emitting; magenta: red-emitting. (a) SMLM based on irreversible green-to-red photoconversion by using 405 nm light activation. (b) SMLM based on photoconversion by using dual-color (488 nm/∼700 nm), i.e., primed light activation. (c) SMLM based on reversible photoswitching (shown for the green chromophore).
Fig. 9
Fig. 9. Dual-color SMLM combined with pulse-chase imaging on a live HeLa cell. (a) TIRF microscopy image of green paxillin–mIrisFP located at focal adhesions. (b) SMLM reconstruction using photoswitching of green mIrisFP. Afterwards, mIrisFP molecules in the region marked by the violet oval were irradiated for 30 s with 405 nm light for green-to-red photoconversion. (c and d) SMLM images of red paxillin–mIrisFP (c) 75 s and (d) 600 s after photoconversion.
Fig. 10
Fig. 10. Dual-channel SMLM of SW-13 cells co-expressing wild-type desmin fused to mIrisGFP and desmin mutant Asn116Ser fused to mEosFPthermo. (a and b) SMLM images of (a) the wild-type desmin fusion protein using photoswitching of mIrisFP and (b) the mutant fusion protein using 405 nm photoconversion of mEosFPthermo. (c) Dual-color (overlay) SMLM image. Scale bar, 1 μm. Adapted from ref. with permission from American Society for Biochemistry and Molecular Biology, copyright 2012.
Fig. 11
Fig. 11. Sequential dual-channel SMLM using EosFP variants with orthogonal green-to-red photoconversion modes. (a) Widefield image of a HeLa cell, with actin filaments and microtubules labeled with LifeAct-pr-mEos2 and E-MAP-115-mEos2, respectively. The green emission from the two markers is indistinguishable. (b) SMLM of red-converted LifeAct-pr-mEos2 using primed photoconversion (488/642 nm). (c) SMLM of red-converted E-MAP-115-mEos2 using 405 nm photoconversion, with the fluorescence of red-emitting mEos2 depicted in blue color to distinguish the two markers in the overlay shown in (d). Scale bar, 10 μm. Adapted from ref. with permission from John Wiley and Sons, copyright 2017.
Fig. 12
Fig. 12. Images of caveolae on the plasma membrane of a live COS-7 cell expressing Skylan-NS-caveolin at 23 °C. TIRF images (a) with deconvolution and combined with (b) SIM, (c) PA NL-SIM, and (d) saturated PA NL-SIM (45-nm resolution) are shown. Insets in (a–d) show individual caveolae. (e) Diversity of caveolae ring diameters as visualized by PA NL-SIM. (f) Larger rings may represent surface-docked vesicles. (g) Clusters of caveolae reminiscent of clathrin plaques. Scale bars, 100 nm. Adapted from ref. with permission from American Association for the Advancement of Science, copyright 2015.
Fig. 13
Fig. 13. Widefield and SOFI images of CCPs in live U2OS cells, using clathrin fused with Skylan-S for labeling. (a–c) TIRFM images. (d–f) SOFI images from second-order cumulants. (g–i) SOFI images from third-order cumulants. (b, e and h) Close-up views of the boxed regions in panels a, d, and g, respectively. (c, f and i) Close-up views of the boxed regions in panels b, e, and h, respectively. Scale bars, 10 μm (a, d and g), 3 μm (b, e and h), and 500 nm (c, f and i). Adapted from ref. with permission from American Chemical Society, Copyright 2015.
None
Karin Nienhaus
None
Gerd Ulrich Nienhaus

Similar articles

Cited by

References

    1. Fluorescence Microscopy: From Principles to Biological Applications, ed. U. Kubitscheck, Wiley-VCH GmbH, Weinheim, Germany, 2017
    1. Stockert J. C. and Blazquez-Castro A., Fluorescence Microscopy in Life Sciences, ed. U. A. E. Sharjah, Bentham Science Publishers, 2017
    1. Far-Field Optical Nanoscopy, ed. P. Tinnefeld, C. Eggeling and S. W. Hell, Springer Berlin Heidelberg, 2015
    1. Hell S. W. Science. 2007;316:1153–1158. doi: 10.1126/science.1137395. - DOI - PubMed
    1. Betzig E. Patterson G. H. Sougrat R. Lindwasser O. W. Olenych S. Bonifacino J. S. Davidson M. W. Lippincott-Schwartz J. Hess H. F. Science. 2006;313:1642–1645. doi: 10.1126/science.1127344. - DOI - PubMed