Review
. 2021 Jun 15;2(4):1115-1143.
doi: 10.1039/d1cb00024a. eCollection 2021 Aug 5.

Imaging therapeutic peptide transport across intestinal barriers

Affiliations
Review

Imaging therapeutic peptide transport across intestinal barriers

Jannik Bruun Larsen et al. RSC Chem Biol. .

Abstract

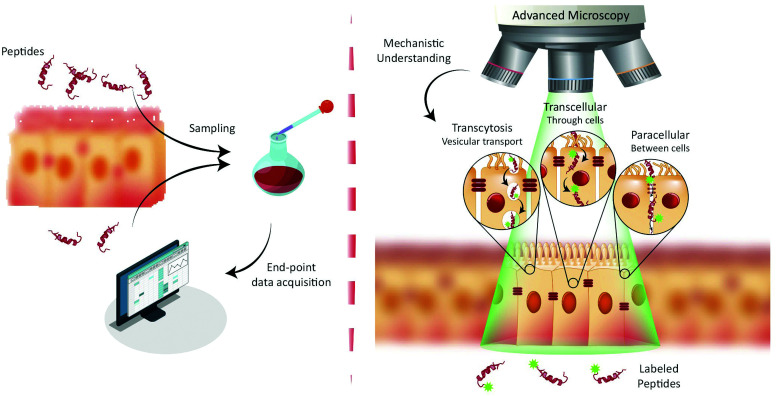
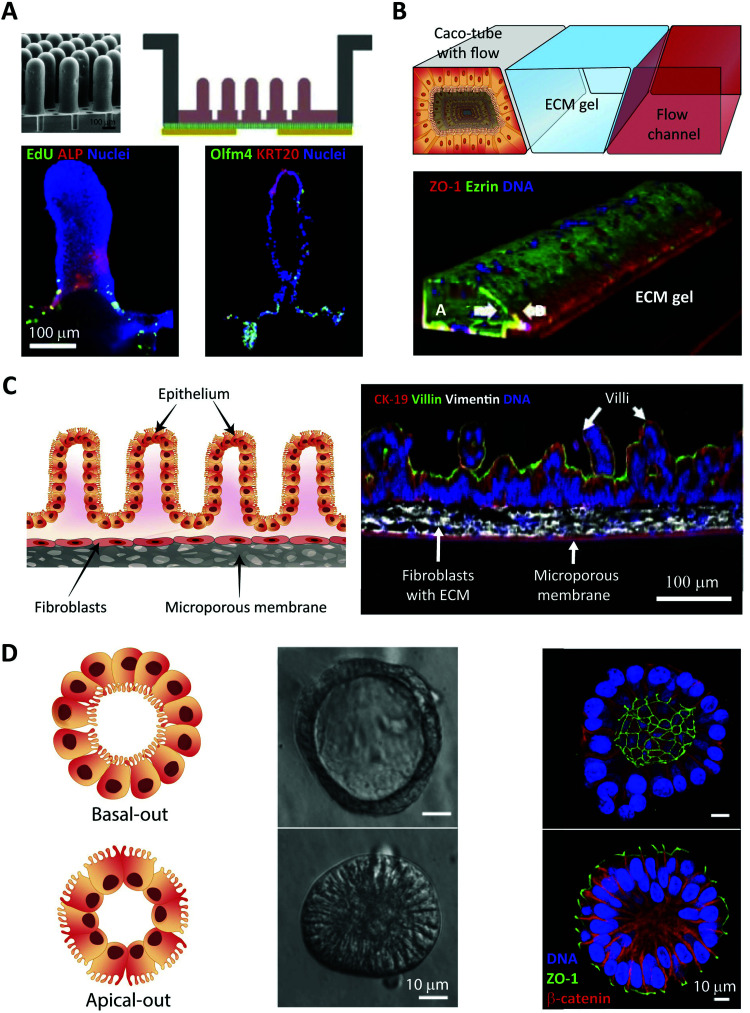
Oral delivery is a highly preferred method for drug administration due to high patient compliance. However, oral administration is intrinsically challenging for pharmacologically interesting drug classes, in particular pharmaceutical peptides, due to the biological barriers associated with the gastrointestinal tract. In this review, we start by summarizing the pharmacological performance of several clinically relevant orally administrated therapeutic peptides, highlighting their low bioavailabilities. Thus, there is a strong need to increase the transport of peptide drugs across the intestinal barrier to realize future treatment needs and further development in the field. Currently, progress is hampered by a lack of understanding of transport mechanisms that govern intestinal absorption and transport of peptide drugs, including the effects of the permeability enhancers commonly used to mediate uptake. We describe how, for the past decades, mechanistic insights have predominantly been gained using functional assays with end-point read-out capabilities, which only allow indirect study of peptide transport mechanisms. We then focus on fluorescence imaging that, on the other hand, provides opportunities to directly visualize and thus follow peptide transport at high spatiotemporal resolution. Consequently, it may provide new and detailed mechanistic understanding of the interplay between the physicochemical properties of peptides and cellular processes; an interplay that determines the efficiency of transport. We review current methodology and state of the art in the field of fluorescence imaging to study intestinal barrier transport of peptides, and provide a comprehensive overview of the imaging-compatible in vitro, ex vivo, and in vivo platforms that currently are being developed to accelerate this emerging field of research.


Conflict of interest statement

None.

Figures

Fig. 1
Fig. 1. Paradigms for studying peptide transport across intestinal barriers. (left) Traditionally, peptide transport across intestinal barriers has been studied using barrier model systems employing end-point assays offering only indirect mechanistic insight on peptide transport mechanisms. (right) Fluorescence live-cell imaging offers the ability to directly visualize and track peptide transport across intestinal barrier models allowing for determination of the transport mechanisms (such as transcytosis, transcellular and/or paracellular) governing peptide transport.
Fig. 2
Fig. 2. Examples of fluorescence imaging used to elucidate peptide and PE transport mode of action. (A) Immunofluorescence imaging of canine gastric tissue uncovering a transcellular barrier transport mechanism of oral semaglutide. Top, semaglutide (red) and DNA (blue) stains reveal that peptide is predominantly localized to the region in and around of the Rybelsus tablet. Bottom, semaglutide (red) is shown to reside in the cytoplasm of mucosal epithelial cells (white arrows) with intact tight junctions depicted by ZO-1 (green) and DNA (blue). Semaglutide is also detected in capillaries under the epithelium marked by white asterisks. Reproduced from ref. 29 with permission from The American Association for the Advancement of Science, copyright 2018. (B) Immunofluorescence imaging of rat jejunum epithelium reveal that the “Transient Permeation Enhancement” (TPE) delivery technology employed for the octreotide system affects the paracellular permeability. Top, a transient disruption of ZO-1 (red) distribution is induced after one minute incubation with TPE (middle) as compared to saline (left). After 120 minutes incubation with TPE, the ZO-1 organization displays its normal puncta-like morphology (right). Bottom, paracellular flux of the tracer LC-biotin (blue) (white arrows) displayed after incubation with TPE, with the lateral membrane stained for actin (red). Reproduced from ref. 33 with permission from Springer Nature, copyright 2014. (C) Elucidating the ability of the microbial toxin VP8 and the Ca2+ chelator EGTA to affect the TJ fence function by imaging caco-2 cell monolayers. In control cells (lower left), imaging of the diffusion marker Bodipy-Sphingomyelin-BSA (green) revealed a staining restricted to the apical cell layer. After addition of either VP8 (top) or EGTA (lower right) clear baso-lateral membrane staining of Bodipy-Sphingomyelin-BSA is evident (see white arrows). Reproduced from ref. 35 with permission from The Company of Biologists Ltd, copyright 2004. (D) Distribution of PIP peptide analogs in caco-2 cell monolayers imaged after 45 min of apical incubation. Binding of Alexa488-streptavidin (green) to active biotinylated PIP peptides (left) or non-active biotinylated PIP peptides (right) reveal a strong colocalization with occluding (red) for active PIP, but a random cytosolic distribution for non-active PIP. Reproduced from ref. 39 with permission from Elsevier, copyright 2018.
Fig. 3
Fig. 3. Fluorescence imaging modalities applicable to study peptide transport across membranes and cellular barriers. (A) A schematic of the illumination strategies and the optical sectioning capabilities of different microscopy modalities. The illumination light (green) excites fluorophores in the sample and, effectively, light is collected from a modality-dependent subset of the fluorophores near the focal plane (green dots). (B) A schematic comparing different imaging modalities in terms of their performance with respect to useful imaging depth and maximum temporal resolution when used to image extended samples that are sparsely labeled. In low-light situations, modalities that rely on scanning (CLSM, 2PM) or do not yield efficient background rejection (WFM) are slower than camera-based methods (LLSM, SDCM, TIRFM) that collect light from all pixels in an image plane in parallel. WFM's poor rejection of fluorescence away from the focal plane strongly limits its useful penetration depth due to loss of contrast. (C) A schematic illustrating how the three major classes of super-resolution fluorescence imaging methods overcome the diffraction limit of conventional fluorescence imaging. (D) A schematic comparing the three super-resolution imaging modalities in terms of their typical performance in terms of temporal and lateral spatial resolution.
Fig. 4
Fig. 4. Representative illustration of imaging-compatible biological models applicable to study peptide transport across the intestinal barrier. The pros and cons of various model systems are qualitatively compared with respect to complexity, compatibility with imaging modalities, and measurement throughput.
Fig. 5
Fig. 5. Strategies for fluorescent labeling of peptides. (A) The chemical core structures of the most common and commercially available fluorophores. The properties of the fluorophore derivatives can be chemically tailored, by changing the substitution pattern of the respective core structures or by the addition of chemical moieties. This results in a great variety of different fluorophores available for many different applications. (B) The chemistry behind the commonly employed fluorophore conjugation techniques using either amine-, thiol- and click-reactive probes. Amine-reactive probes target amine groups like lysine residues or the N-terminus. A wide variety of different amine-reactive probes is available. This makes it an advantageous method, when labeling peptides during SPPS. Thiol-selective probes are advantageous, when labelling peptides in solution. Due to the low abundance of cysteine residues this conjugation techniques results in a high regioselectivity. Click-reactive probes offer the advantage of bioorthogonality, however, an unnatural amino acid with an alkyne or azide moiety needs to be incorporated into the peptide sequence. (C) Schematic overview of the MALDI-MSI method for the evaluation of peptide degradation or modification in vivo. A frozen intestinal section is first cryosliced and placed on a glass slide before a matrix is applied and the MALDI-MS is performed. For each pixel a mass spectrum is obtained allowing the creation of raster graphics which can be compared to histological sections. Reproduced from ref. 181 with permission from American Chemical Society, copyright 2021.
Fig. 6
Fig. 6. Using membrane model systems to study peptide translocation. (A) Left, schematic illustration showing the concept of the peptide:membrane interaction and translocation experiment using the simplest membrane model system, GUVs. Influx of CF (green) in the inner GUVs constitutes a sensitive method for proving the ability of peptides to translocate across membranes. Right, studying the membrane translocation of fluorescent Transportan 10 analogs (Rhodamine-TP10W, red) using a microscopy-based multivesicular vesicle assay, employing CF influx into GUVs as a function of time (8.5, 14, 33, and 75 min). Reproduced from ref. 189 with permission from American Chemical Society, copyright 2013. (B) Top, schematic illustration of cell blebbing, GPMV formation and peptide transport experiment. Bottom, membrane translocation of the fluorescently labeled nona-arginine (Arg9, green) after 1 h, studied using GPMVs labeled with wheat germ agglutinin conjugated to Alexa Fluor 647 (WGA-AF64, white). Reproduced from ref. 204 with permission from Elsevier, copyright 2016.
Fig. 7
Fig. 7. Summary of in vitro and ex vivo intestinal barrier models for studying peptide transport. (A) Example of micro-engineered scaffolds to generate crypt-villus architecture of human small intestinal epithelium. Top left, an electron microscopy image of the PDMS stamp used to create, top right, a micromolded collagen scaffold in a modified Transwell insert; bottom, visualization of cellular differentiation and polarization using immunostaining. Left, absorptive enterocytes localized on the villi (ALP, red) and proliferative cells localized in the crypt (EdU, green). Right, terminally differentiated tissues of the intestine expressing human cytokeratin 20 localized on villi tips (KRT20, red) and stem cells localized to crypts and adjacent regions (Olfm4, green). Reproduced from ref. 226 with permission from Elsevier, copyright 2017. (B) Top, OrganoPlate by MIMETAS: schematic of the three lane system at the center of each channel network, consisting of a Caco-2 cell tubular lane, an extracellular matrix (ECM) gel lane, and a perfusion lane. Bottom, 3D reconstruction of a confocal z-stack showing the Caco-2 cell tubular morphology visualized by staining the tight junction protein ZO-1 (red), the brush border-protein Ezrin (green), and DNA (blue). White arrows indicate the apical (A) and basal sides (B). Reproduced from ref. 232 with permission from Springer Nature, copyright 2017. (C) EpiIntestinal™ model, an ex vivo model for studying drug absorption in the small intestine based on primary human cell-based organotypic small intestinal micro-tissues. Left, an illustration showing different types of cells and the microporous membrane underneath. Right, immmunostained cross-sections of the reconstructed microtissues showing cytokeratin-19 stained columnar epithelial cells (CK-19, red), villin stained apical surface of epithelium (green) and vimentin stained fibroblasts in the underlying ECM substrate (white). Reproduced from ref. 235 with permission from Springer Nature, copyright 2018. (D) Left, two types of organoid morphology, basal-out and apical-out, can be produced, with the latter potentially facilitating studies of peptide transport across the intestinal barrier from the apical to the basal side. Middle, organoids imaged using modulation contrast microscopy. Right, confocal microscopy images with nuclei in blue, ZO-1 (green) and β-catenin (red) illustrate how the orientation of the organoid organization is flipped when going from the basal-out to the apical-out system. Reproduced from ref. 252 with permission from Cell Press, copyright 2019.
Fig. 8
Fig. 8. Imaging cells in lab-on-a-chip platforms. (A) Schematic cross-section of a microfluidic organ-on-a-chip. Top, left, device showing cyclic mechanical strain using the two vacuum chambers, which creates a shear stress in the perpendicular direction. Top, right, photograph of the device with blue and red dyes representing upper and lower microchannels, respectively. Bottom left, a differential interference contrast micrograph showing intestinal crypt (red arrow) and villi (white arrow) formation for Caco-2 cells grown in the chip. Bottom center, confocal immunofluorescence image of horizontal cross-section of intestinal villi stained for F-actin (green) labelling the apical brush border of polarized intestinal epithelial cells and DNA (blue), reproduced from ref. 268 with permission from National Academy of Sciences, copyright 2016. Bottom right, confocal fluorescence image showing vertical cross section of an intestinal villi inside the chip, stained for F-actin (green), Mucin-2 (magenta), and DNA (blue). Reproduced from ref. 256 with permission from The Royal Society of Chemistry, copyright 2012. (B) Schematic of microfluidic platform of the mini-intestine, consisting of a hydrogel chamber in the center, fed by the two medium reservoirs, perspective and side view (left). Bright-field and fluorescence time-course experiments showing the real-time formation of epithelium in mini-intestine chip (right). Reproduced from ref. 244 with permission from Springer Naturee, copyright 2020. (C) Left, schematic of the integrated device for observation of insulin granules inside the adherent cells cultured under continuous medium perfusion. Right, microscopic images of the MIN6-m9/insulin-GFP cells captured on the integrated system with different illumination modes, bright-field, epifluorescence microscopy (EPIFM), and TIRFM. Reproduced from ref. 284 with permission from Springer Nature, copyright 2012.
Fig. 9
Fig. 9. In vivo imaging of the intestinal barrier. (A) An illustration showing a mouse with a surgically implanted imaging window allowing visualization of the small intestine. (B) A schematic showing an IVM setup where an intestinal section is externalized from an anesthetized mouse and placed inside a glass based imaging chamber. (C) An example of a IVM setup being used to demonstrate differential uptake of orally administered particles and antigens. Dextran-fluorescein (Dex-Fluo) (green) enters through Goblet cell-associated passageways (white arrows), while 20 nm polystyrene nanoparticles (NP) (red) enter via intestinal epithelial cells. Reproduced from ref. 303 with permission from Public Library of Science, copyright 2014.

References

    1. Rader A. F. B. Weinmuller M. Reichart F. Schumacher-Klinger A. Merzbach S. Gilon C. Hoffman A. Kessler H. Angew. Chem., Int. Ed. 2018;57:14414–14438. doi: 10.1002/anie.201807298. - DOI - PubMed
    1. Lau J. L. Dunn M. K. Bioorg. Med. Chem. 2018;26:2700–2707. doi: 10.1016/j.bmc.2017.06.052. - DOI - PubMed
    1. Mitragotri S. Burke P. A. Langer R. Nat. Rev. Drug Discovery. 2014;13:655–672. doi: 10.1038/nrd4363. - DOI - PMC - PubMed
    1. Tibbitt M. W. Dahlman J. E. Langer R. J. Am. Chem. Soc. 2016;138:704–717. doi: 10.1021/jacs.5b09974. - DOI - PubMed
    1. Drucker D. J. Nat. Rev. Drug Discovery. 2020;19:277–289. doi: 10.1038/s41573-019-0053-0. - DOI - PubMed