. 2021 Sep 27;49(17):9821-9835.
doi: 10.1093/nar/gkab715.

Conservation and divergence of meiotic DNA double strand break forming mechanisms in Arabidopsis thaliana

Affiliations

Conservation and divergence of meiotic DNA double strand break forming mechanisms in Arabidopsis thaliana

Nathalie Vrielynck et al. Nucleic Acids Res. .

Abstract

In the current meiotic recombination initiation model, the SPO11 catalytic subunits associate with MTOPVIB to form a Topoisomerase VI-like complex that generates DNA double strand breaks (DSBs). Four additional proteins, PRD1/AtMEI1, PRD2/AtMEI4, PRD3/AtMER2 and the plant specific DFO are required for meiotic DSB formation. Here we show that (i) MTOPVIB and PRD1 provide the link between the catalytic sub-complex and the other DSB proteins, (ii) PRD3/AtMER2, while localized to the axis, does not assemble a canonical pre-DSB complex but establishes a direct link between the DSB-forming and resection machineries, (iii) DFO controls MTOPVIB foci formation and is part of a divergent RMM-like complex including PHS1/AtREC114 and PRD2/AtMEI4 but not PRD3/AtMER2, (iv) PHS1/AtREC114 is absolutely unnecessary for DSB formation despite having a conserved position within the DSB protein network and (v) MTOPVIB and PRD2/AtMEI4 interact directly with chromosome axis proteins to anchor the meiotic DSB machinery to the axis.


Figures

Figure 1.
Figure 1.
The DSB protein interaction network. (A) Summary of the yeast two-hybrid assay results. Dark green indicates growth on SD-LWHA for at least one of the combinations tested (involving either full-length or truncated versions of the tested proteins). Light green indicates growth on SD-LWH medium for at least one of the combinations tested. Pink indicates that none of the combinations tested conferred auxotrophy. The complete set of results is given in Supplementary Table S1. (B) Summary of the bimolecular fluorescence complementation (BiFC) assays. Green indicates that an interaction was detected with at least one of the combinations tested. Pink indicates that none of the combinations tested conferred a YFP signal. Gray indicates that the interaction was not tested. The complete set of results is given in Supplementary Table S1. Interactions of PRD1 with SPO11-1, SPO11-2, MTOPVIB, PRD3 and DFO correspond to results reported by (69). (C) Schematic representation of the interaction network. Green arrows: Strong interactions between two proteins. Bold letters: proteins essential for DSB formation. Gray shapes: Proteins that directly interact with axial proteins ASY1, ASY3 or ASY4. (D) Detailed depiction of interaction domains defined in yeast two-hybrid assays. Schematic representation of the DSB proteins with their functional domains (WHD for winged-helix domain, transd. for transducer domain, PH for pleckstrin homology domain). Blue vertical bars indicate structurally conserved motifs. Below each protein, black bars represent the regions that interact with the proteins indicated on the right or below the bars.
Figure 2.
Figure 2.
Immunolocalization of SPO11-1-cMYC on spreads of male meiocytes. (A) Co-immunolocalization of the axis protein ASY1 (magenta) and SPO11-1-cMYC (green) in SPO11-1-cMYC expressing plant lines (containing the spo11-1-2–/– mutation) and wild-type (Col-0) (without SPO11-1-cMYC); size bar: 10 μm. (B) Detection of SPO11-1-cMYC foci in spo11-2-3 and mtopVIb mutants; size bar: 10 μm. (C) Quantification of SPO11-1-cMYC foci in Col-0 (Wt), spo11-1-2 (L: leptotene, Z: zygotene, P: pachytene), spo11-2-3, mtopVIb-2, prd1-2, prd2-1, prd3-4, dfo-2, asy1-2 and asy3-1 (see Supplementary Figure S4). Statistical analysis was used to compare the mean of SPO11-1-cMyc in spo11-1-2 (all stages included) to the mean of all other plant lines indicated (one-way ANOVA, with Dunnett correction for multiple comparisons, 99% confidence interval; ns, 0.01 < P; *** P < 0.0001; error bars represent SD).
Figure 3.
Figure 3.
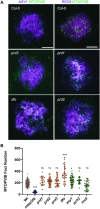
Immunolocalization of MTOPVIB on spreads of male meiocytes. (A) Co-immunolocalization of an axis protein (ASY1 or REC8, magenta) together with MTOPVIB (green); scale bar: 5 μm. (B) MTOPVIB foci counts in various mutant backgrounds. Statistical analysis compares mean foci numbers in each mutant to wild-type mean (one-way ANOVA with Dunnett correction for multiple comparison, 99% confidence interval; ns, 0.01 < P; * 0.001 < P < 0.01; *** P < 0.0001; error bars represent SD). Alleles investigated were mtopVIb-2, prd1-2, prd2-1, prd3-3, dfo-1, asy1-4, pch2-1 and rec8-3.
Figure 4.
Figure 4.
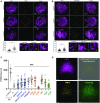
AtMER2/PRD3 and MTOPVIB form non-overlapping foci, more tightly associated with unpaired axes than paired axes. (A and B) Co-immunolocalization of the axis protein ASY3 (magenta) with either PRD3 (A, yellow) or MTOPVIB (B, yellow) using STED nanoscopy. Enlargements correspond to the boxes indicated with dashed white lines. White arrows indicate unpaired axes, and blue arrows indicate paired axes. Graphs represent the distances measured from foci to the unpaired or paired meiotic axes. Differences between the mean values were evaluated (non-parametric Mann–Whitney test; **** P < 0.0001; error bars represent SD); size bar: 2 μm. (C) Quantification of PRD3 foci in Col-0 (Wt, L: leptotene, Z: zygotene, P: pachytene), spo11-1-2, spo11-2-3, spo11-1-2 spo11-2-3, mtopVIb-2, prd1-2, prd2-1, prd3-4, dfo-2, asy1-2 and asy3-1 plants (see Supplementary Figure S5). Statistical analysis was used to compare the mean of Col-0 (leptotene/zygotene) to the mean of each mutant (one-way ANOVA, with Dunnett correction for multiple comparison, 99% confidence interval; ns, 0.01 < P; *** P < 0.0001; error bars represent SD). (D) Co-immunolocalization of the axis associated protein ASY1 (magenta), PRD3 (yellow) and MTOPVIB (green). The reconstructed image shows the detected PRD3 (yellow spheres) and MTOPVIB foci (green spheres) using the Imaris spot detection tool. Hardly any colocalization could be detected; size bar: 5 μm.
Figure 5.
Figure 5.
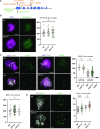
AtREC114/PHS1 is not essential for meiotic DSB formation. (A) AtREC114/PHS1 gene structure. Blue rectangles represent exons. Colored triangles indicate the position of the mutations (insertion lines in orange; CRISPR-Cas9 generated mutants in green). (B) Co-immunolocalization of the axis protein ASY1 (magenta) and MTOPVIB (green) in wild-type and phs1-2 meiocytes. The graph shows the quantification of MTOPVIB foci numbers. (C) Co-immunolocalization of the axis protein ASY1 (magenta), the central element protein ZYP1 (white) and RAD51 (green). Quantification of RAD51 foci according to the level of synapsis is shown. No or low ZYP1 signal, corresponding to leptotene or early zygotene were grouped together; extended ZYP1 signal corresponding to late zygotene and pachytene stages were counted together. Quantification of DMC1 foci in wild-type and mutants is also shown, all stages counted together. (D) Immunolocalization of MLH1 in wild-type, phs1-2 and phs1-5 meiocytes. The graph shows the quantification of MLH1 foci number on meiocytes at diplotene and diakinesis stages (determined according to ZYP1 staining, not shown); scale bars = 5 μm. Statistical analyses compare mean foci numbers either between wild-type and mutant (MLH1 and RAD51 foci, unpaired Student’s t-tests) or between all means (MTOPVIB and DMC1 foci numbers, one-way ANOVA, with Tukey correction for multiple comparison). All tests were analyzed using a 99% confidence interval; ns 0.01 < P; *** P < 0.0001; error bars represent SD.

References

    1. Wang S., Zickler D., Kleckner N., Zhang L.. Meiotic crossover patterns: obligatory crossover, interference and homeostasis in a single process. Cell Cycle. 2015; 14:305–314. - PMC - PubMed
    1. Hunter N.Meiotic recombination: the essence of heredity. Cold Spring Harb. Perspect. Biol. 2015; 7:a016618. - PMC - PubMed
    1. Mercier R., Mézard C., Jenczewski E., Macaisne N., Grelon M.. The molecular biology of meiosis in plants. Annu. Rev. Plant Biol. 2015; 66:297–327. - PubMed
    1. Zelkowski M., Olson M.A., Wang M., Pawlowski W.P.. Diversity and determinants of meiotic recombination landscapes. Trends Genet. 2019; 35:359–370. - PubMed
    1. de Massy B.Initiation of meiotic recombination: how and where? Conservation and specificities among eukaryotes. Annu. Rev. Genet. 2013; 47:563–599. - PubMed

Publication types

MeSH terms