. 2022 Feb 18;51(1):265-278.
doi: 10.1093/ije/dyab172.

Potential test-negative design study bias in outbreak settings: application to Ebola vaccination in Democratic Republic of Congo

Affiliations

Potential test-negative design study bias in outbreak settings: application to Ebola vaccination in Democratic Republic of Congo

Carl A B Pearson et al. Int J Epidemiol. .

Abstract

Background: Infectious disease outbreaks present unique challenges to study designs for vaccine evaluation. Test-negative design (TND) studies have previously been used to estimate vaccine effectiveness and have been proposed for Ebola virus disease (EVD) vaccines. However, there are key differences in how cases and controls are recruited during outbreaks and pandemics of novel pathogens, whcih have implications for the reliability of effectiveness estimates using this design.

Methods: We use a modelling approach to quantify TND bias for a prophylactic vaccine under varying study and epidemiological scenarios. Our model accounts for heterogeneity in vaccine distribution and for two potential routes to testing and recruitment into the study: self-reporting and contact-tracing. We derive conventional and hybrid TND estimators for this model and suggest ways to translate public health response data into the parameters of the model.

Results: Using a conventional TND study, our model finds biases in vaccine effectiveness estimates. Bias arises due to differential recruitment from self-reporting and contact-tracing, and due to clustering of vaccination. We estimate the degree of bias when recruitment route is not available, and propose a study design to eliminate the bias if recruitment route is recorded.

Conclusions: Hybrid TND studies can resolve the design bias with conventional TND studies applied to outbreak and pandemic response testing data, if those efforts collect individuals' routes to testing. Without route to testing, other epidemiological data will be required to estimate the magnitude of potential bias in a conventional TND study. Since these studies may need to be conducted retrospectively, public health responses should obtain these data, and generic protocols for outbreak and pandemic response studies should emphasize the need to record routes to testing.

Keywords: DRC; Ebola; Test-negative design; mathematical modelling; outbreak response.


Figures

Figure 1
Figure 1
The modelled population and recruitment into the test-negative design study. (a) Individuals and their contacts are either targeted for vaccination (filled circles—dark blue receive the vaccine and light blue do not) or not (open circles). (b) The fraction who are targeted (and thus may be vaccinated) is pin; none of the non-targeted population (open circles, N label) receives the vaccine. Of those targeted, some are not vaccinated (e.g. because they are ineligible due to age, pregnancy, recent illness, immunocompromised status or because there is only sufficient study vaccine to deliver partial coverage) (light blue, U label) and some are (dark blue, V label). The vaccine coverage in the targeted population is L. In the recruitable population (the combination of N, U and V), non-vaccinees (N and U) are infected on EVD exposure, whereas vaccines (V) avoid disease at the vaccine efficacy, E. (c) An expected number of self-reported people test negative (circles with _ sign), B, until a test-positive (circle with + sign) is identified. This leads to an expected amount of follow-up testing, λ, which finds R” more cases if the initial case is in the non-targeted population, and (1-LE)R” if targeted. The coverage, L, efficacy, E, and targeted fraction, pin, determine the likelihood of observing the self-reporting case among targeted vs non-targeted individuals and vaccinated vs unvaccinated individuals. (d) Resulting categories that can be recruited into the study. U and V are, respectively, the unvaccinated and vaccinated individuals in the targeted population; N are non-targeted individuals. The ’ vs ’ annotations indicate, respectively, self-reporting vs contact-traced, and the _ vs + subscripts indicate test-negative and test-positive outcomes, respectively.
Figure 2
Figure 2
The modelled population and recruitment into the TND study. (a) Individuals and their contacts are either targeted for vaccination (filled circles—dark blue receive the vaccine and light blue do not) or not (open circles). (b) The fraction who are targeted (and thus may be vaccinated) is pin; none of the non-targeted population (open circles, N label) receives the vaccine. Of those targeted, some are not vaccinated (e.g. because they are ineligible due to age, pregnancy, recent illness, immunocompromised status or because there is only sufficient study vaccine to deliver partial coverage) (light blue, U label) and some are (dark blue, V label). The vaccine coverage in the targeted population is L. In the recruitable population (the combination of N, U and V), non-vaccinees (N and U) are infected on EVD exposure, whereas vaccines (V) avoid disease at the vaccine efficacy, E. (c) An expected number of self-reported people test negative (circles with _ sign), B, until a test-positive (circle with + sign) is identified. This leads to an expected amount of follow-up testing, λ, which finds R” more cases if the initial case is in the non-targeted population, and (1-LE)R” if targeted. The coverage, L, efficacy, E, and targeted fraction, pin, determine the likelihood of observing the self-reporting case among targeted vs non-targeted individuals and vaccinated vs unvaccinated individuals. (d) Resulting categories that can be recruited into the study. U and V are, respectively, the unvaccinated and vaccinated individuals in the targeted population; N are non-targeted individuals. The ’ vs ”annotations indicate, respectively, self-reporting vs contact-traced, and the _ vs + subscripts indicate test-negative and test-positive outcomes, respectively
Figure 3
Figure 3
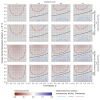
Bias trends across all model parameters. The figure illustrates the bias trends with respect to true efficacy, E, and vaccination coverage in the targeted population, L. The 16 panels correspond to combinations of example values for: (outer columns) self-reporting test-negative fraction (f_ at low = 0.8 and high = 0.99); (inner columns) the recruitment route ratio (ρ at low = 0.5 and high = 2; less than 1 implies more self-reporting recruitment, greater than 1 implies more contact-tracing recruitment); (outer rows) contact-tracing test-positive fraction (p_t at low = 0.1 and high = 0.3); and the targeted fraction (pinf_- at low = 0.6 and high = 0.9)
Figure 4
Figure 4
Impact of decreasing targeted fraction among recruits. The panels show decreasing targeted fraction (columns from left to right) for scenarios stratified by self-reported test-negative fraction in recruitment (0.8 and 0.99) and recruitment route ratio (0.1 and 0.3) (rows). This figure shows 70% coverage level in the targeted population, L = 0.7
Figure 5
Figure 5
Bias due to inability to exclude contact-traced test-negatives. The panels show decreasing targeted fraction (columns from left to right) for scenarios stratified by self-reported test-negative fraction in recruitment (0.8 and 0.99) and recruitment route ratio (0.1 and 0.3) (rows). This figure shows 70% coverage level among targeted individuals, L = 0.7. The range of bias is usually smaller than when recruitment is restricted to the targeted population only (Figure 3)
Figure 6
Figure 6
Bias possible when recruiting targeted individuals only. These bias envelopes were computed assuming outbreak response metrics For Review Only [“SR” ]_-∈(6500, 7000), [“SR” ]_+∈(100, 150), [“CT” ]_+∈(100, 400) and [“CT” ]_-∈(900, 1200), which corresponds to 97.7–98.6% of self-reporting cases testing negative, testing 6–16 contact-traced individuals per self-reported case and 10–25% of those contact-traced individuals testing positive. If the study is restricted to recruit only the targeted population (leftmost panel), then bias can be limited to less than 3% overestimation. However, as the targeted fraction falls, the error range generally increases, to >15% peak bias for high coverage (90%) and low targeted fraction (40%). Higher coverage in the targeted population generally increases bias; this reflects increasing differences between the targeted and non-targeted individuals
Figure 7
Figure 7
Bias possible when recruitment is restricted to self-reported individuals only. If the study analysis is able to restrict recruits to only self-reporting individuals, then there is no bias (left panel). However, as For Review Only contact-traced test-negative individuals are increasingly included (moving right across panels), bias range increases to between 1% overestimate and 5% underestimate. However, this range is notably smaller than if only recruiting from the targeted population (Figure 5). As with restricting recruitment to targeted individuals only, higher levels of coverage lead to wider bias range. These ranges reflect the same parameters used in Figure 6, including targeted fraction p_in ∈(0.4,1). In this figure, the overestimate bounds (upper ribbon lines) closely align

References

    1. Halloran ME, Auranen K, Baird S. et al. Simulations for designing and interpreting intervention trials in infectious diseases. BMC Med 2017;15:223. - PMC - PubMed
    1. Bellan SE, Eggo RM, Gsell P-S. et al. An online decision tree for vaccine efficacy trial design during infectious disease epidemics: the InterVax-Tool. Vaccine 2019;37:4376–81. - PMC - PubMed
    1. Dean NE, Gsell PS, Brookmeyer R. et al. Design of vaccine efficacy trials during public health emergencies. Sci Transl Med 2019;11. doi: 10.1126/scitranslmed.aat0360. - PMC - PubMed
    1. Baden LR, Rubin EJ, Morrissey S, Farrar JJ, Drazen JM.. We can do better - improving outcomes in the midst of an emergency. N Engl J Med 2017;377:1482–84. - PubMed
    1. WHO. Vaccination in Acute Humanitarian Emergencies: A Framework for Decision Making. Geneva: World Health Organization, 2017.

Publication types

MeSH terms