. 2021 Sep;20(9):e13468.
doi: 10.1111/acel.13468. Epub 2021 Aug 30.

Inhibition of the cGAS-STING pathway ameliorates the premature senescence hallmarks of Ataxia-Telangiectasia brain organoids

Affiliations

Inhibition of the cGAS-STING pathway ameliorates the premature senescence hallmarks of Ataxia-Telangiectasia brain organoids

Julio Aguado et al. Aging Cell. 2021 Sep.

Abstract

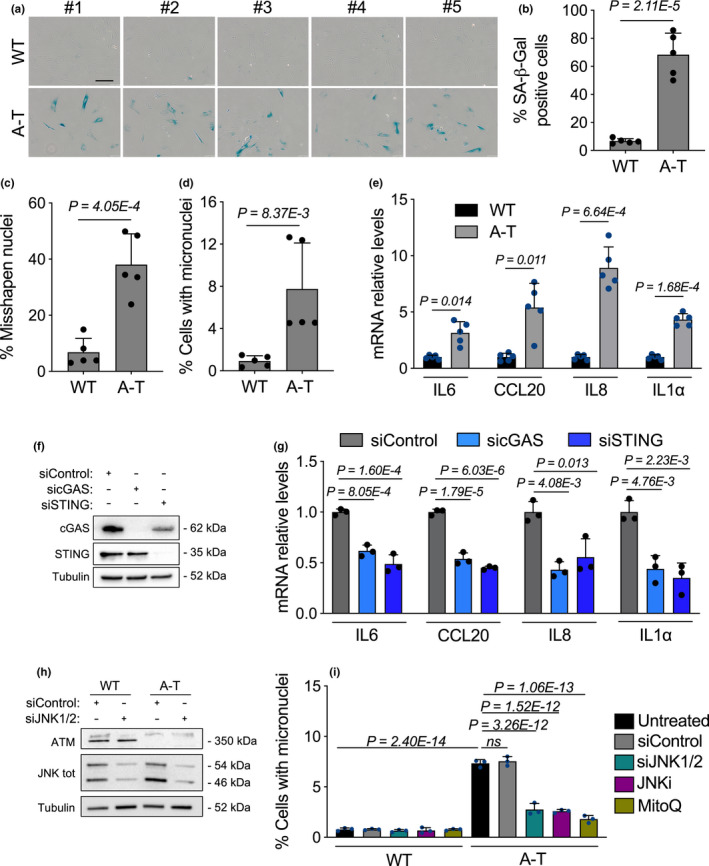
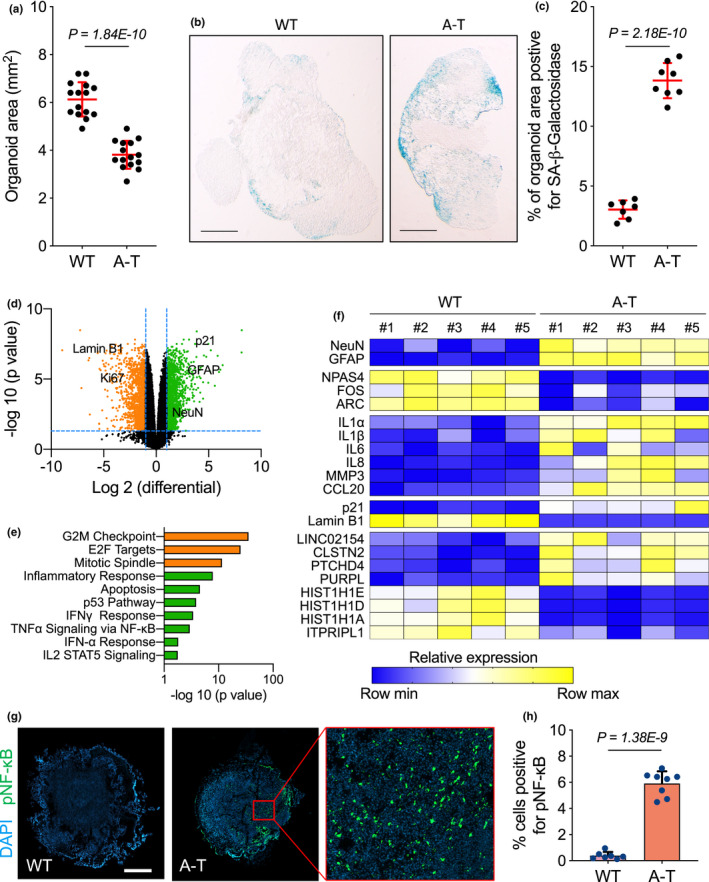
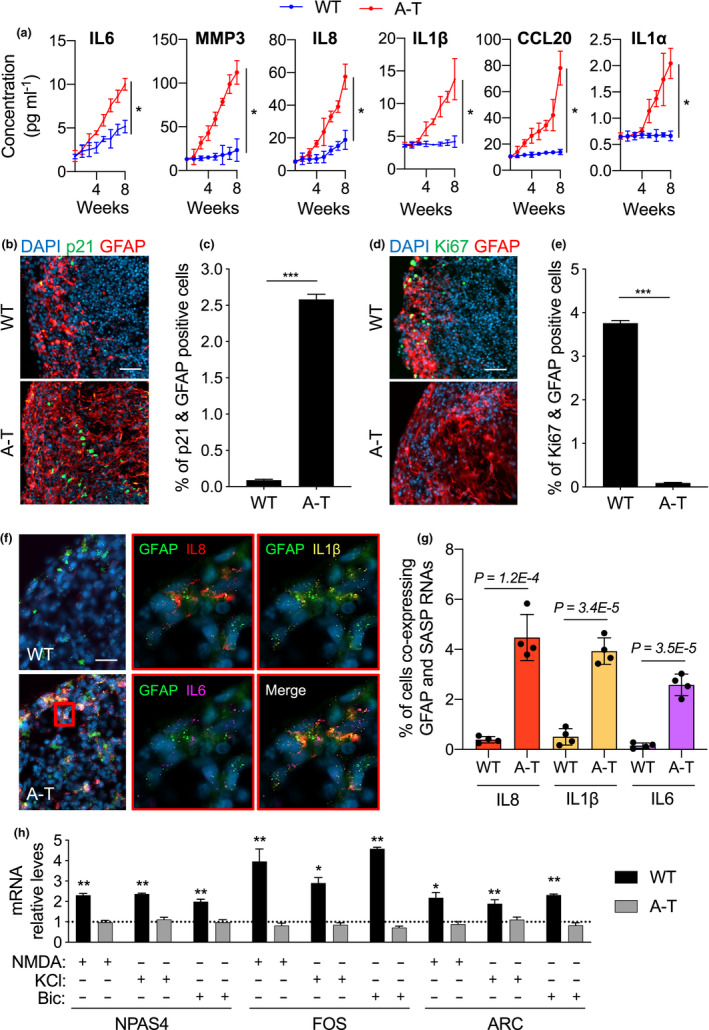
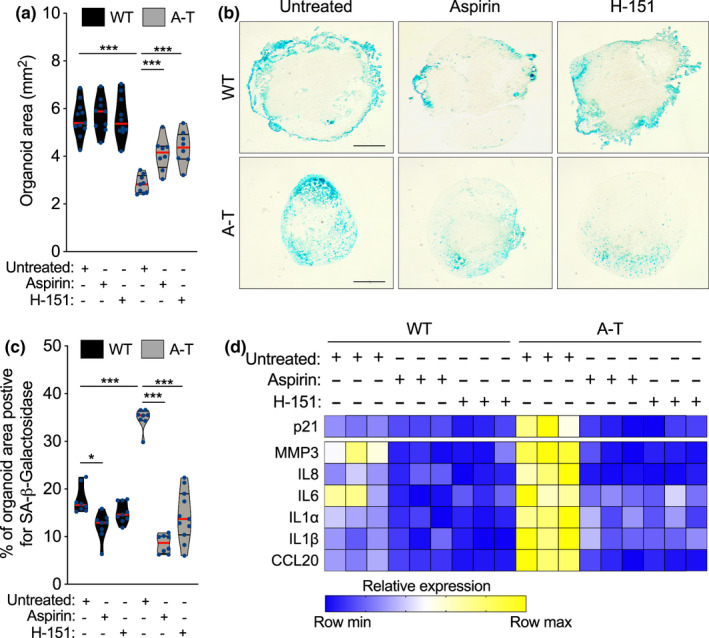
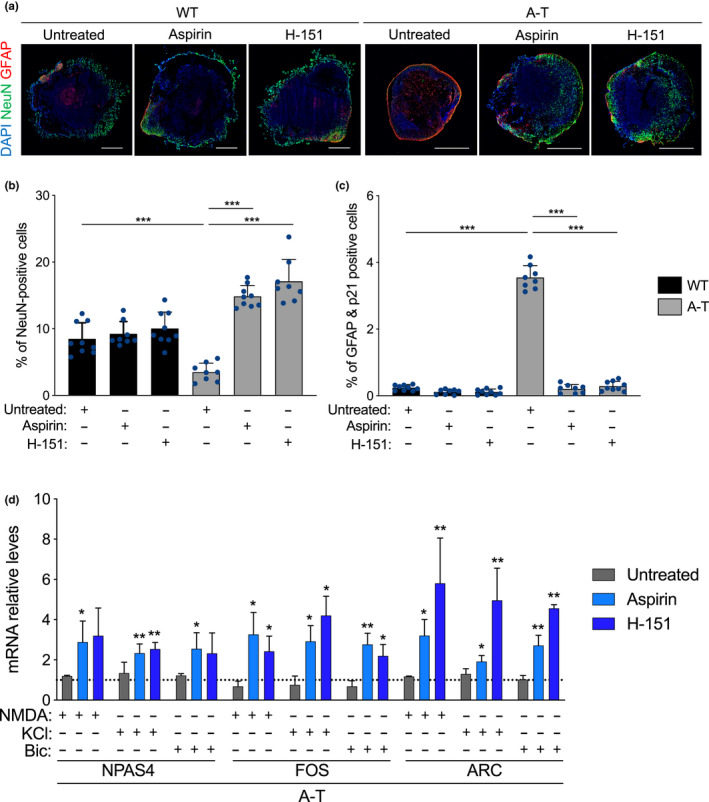
Ataxia-telangiectasia (A-T) is a genetic disorder caused by the lack of functional ATM kinase. A-T is characterized by chronic inflammation, neurodegeneration and premature ageing features that are associated with increased genome instability, nuclear shape alterations, micronuclei accumulation, neuronal defects and premature entry into cellular senescence. The causal relationship between the detrimental inflammatory signature and the neurological deficiencies of A-T remains elusive. Here, we utilize human pluripotent stem cell-derived cortical brain organoids to study A-T neuropathology. Mechanistically, we show that the cGAS-STING pathway is required for the recognition of micronuclei and induction of a senescence-associated secretory phenotype (SASP) in A-T olfactory neurosphere-derived cells and brain organoids. We further demonstrate that cGAS and STING inhibition effectively suppresses self-DNA-triggered SASP expression in A-T brain organoids, inhibits astrocyte senescence and neurodegeneration, and ameliorates A-T brain organoid neuropathology. Our study thus reveals that increased cGAS and STING activity is an important contributor to chronic inflammation and premature senescence in the central nervous system of A-T and constitutes a novel therapeutic target for treating neuropathology in A-T patients.

Keywords: Ataxia-Telangiectasia; brain aging; brain organoids; cGAS-STING signalling; cellular senescence; neurodegeneration.


Conflict of interest statement

The authors declare no competing interests.

Figures

FIGURE 1
FIGURE 1
Lack of functional ATM in ONS patient cells induces a cGAS‐STING‐dependent SASP response driven by accumulation of cytoplasmic DNA. (a‐e) 5 wild type (WT) and 5 A‐T human ONS cell lines were used and analysed at identical passage number (passage 20). (a) Representative images of senescence‐associated β‐galactosidase (SA‐β‐gal) positive assays shown in b. Scale bar, 100 μm. (b–d) Each point in the bar plot in (b) shows the average percentage of SA‐β‐gal positive cells of one cell line, (c) the average percentage of cells with misshapen nuclei and in (d) the average percentage of cells with micronuclei. Error bars represent SD; n = 5 independent patient samples; Student's t test. (e) Total RNA from human A‐T ONS patient cells was used to quantify the mRNA expression levels of the indicated SASP genes and normalized to RPLP0 mRNA and compared to WT ONS controls. Error bars represent SD; n = 5 independent biological samples; Student's t test. (f, g) A‐T ONS cells were transfected with the indicated siRNA for 48hr. (f) Representative Western blot analysis of cGAS and STING of whole cell extracts from siRNA‐transfected cells. α‐tubulin was used as loading control. (g) Total RNA from siRNA‐transfected A‐T ONS patient cells was used to quantify the mRNA expression levels of the indicated SASP genes and normalized to RPLP0 mRNA and compared to siControl. Error bars represent SD; n = 3 independent experiments; one‐way ANOVA with Tukey's multiple‐comparison post hoc corrections. (h) Representative Western blot analysis of JNK1/2 and ATM of whole cell extracts from siRNA‐transfected WT and A‐T ONS cells. α‐tubulin was used as loading control. (i) WT and A‐T ONS cells were either transfected with the indicated siRNAs, treated with JNK inhibitor (JNKi, SP600125, 20 μM) or MitoQ (100 nM) for ten days. Cells were thereafter assessed for micronuclei formation. Bar graphs show the percentage of micronuclei‐positive cells. Error bars represent SD; n = 3 independent experiments; one‐way ANOVA with Tukey's multiple‐comparison post hoc corrections
FIGURE 2
FIGURE 2
A‐T brain organoids display smaller size and increased levels of senescence and inflammatory marks. (a–h) WT and A‐T brain organoids (BOs) were generated and grown in vitro for 3 months and collected for analysis. (a) Each point in the scatter plot shows the organoid size of a single BO. Error bars represent SD; n = 15 independent BO samples; Student's t test. (b) Representative images from quantifications shown in (c). Scale bar, 0.7 mm. (c) SA‐β‐gal assays were performed on wild type (WT) and A‐T BOs. Each point in the scatter plot represents a single BO section analysed. Error bars represent SD; n = 3 independent experiments; Student's t test. (d) Volcano plot showing WT versus A‐T brain organoid differential expression of upregulated (green) and downregulated (orange) genes. (e) Gene Set Enrichment Analysis using ageing hallmark gene sets from the Molecular Signature Database was carried out. The statistically significant signatures were selected (FDR < 0.25) and placed in order of normalized enrichment score, which represents the strength of the relationship between the phenotype and gene signature. Bars indicate the pathways enriched in genes that are downregulated (orange) and upregulated (green) in A‐T BOs as compared to the WT BO group. (f) Total RNA from WT and A‐T BOs were used for RT‐qPCR analysis. B2M mRNA was used as normalizer. n = 5 independent biological samples. Exact P values can be found in Figure S2. (g) Immunofluorescence representative images of WT and A‐T BO sections stained for NF‐κB phosphorylated on serine 536 (pNF‐κB). Scale bar, 0.7 mm. (h) Quantification of data presented in (g). Bar graphs show the percentage of pNF‐κB positive cells. Each point in the scatter plot represents a single BO section analysed. Error bars represent SD; n = 3 independent experiments; Student's t test
FIGURE 3
FIGURE 3
A‐T brain organoids secrete enriched levels of pro‐inflammatory factors and fail to transcribe IEGs upon neuronal excitatory input. (a) Culture media from WT and A‐T BOs was collected once a week for 2 months and used to quantify the secreted levels of the indicated SASP proteins. n = 3 independent experiments. *p < 0.05; two‐way ANOVA with concentration and time used as variables. (b‐h) WT and A‐T Brain organoids (BOs) were generated and grown in vitro for 3 months and collected for analysis. (b) Representative images of BO sections stained for p21 (green) and GFAP (red). Scale bar, 100 µm. (c) Quantification of data presented in b. Bar graphs show the percentage of p21 and GFAP positive cells ±95% confidence interval. n = 3 independent biological samples; at least 100,000 cells per sample have been analysed; ***p < 0.001, chi‐squared test. (d) Representative images of BO sections stained for Ki67 (green) and GFAP (red). Scale bar, 100 µm. (e) Quantification of data presented in d. Bar graphs show the percentage of Ki67 and GFAP positive cells ±95% confidence interval. n = 3 independent biological samples; at least 100,000 cells per sample have been analysed; ***p < 0.001, chi‐squared test. (f) Representative images of RNAscope in situ hybridization on BO sections for GFAP (green), IL‐8 (red), IL1B (yellow) and IL‐6 (magenta). Cell nuclei were stained with DAPI (blue). Scale bars, 30 μm. (g) Quantification of data presented in f. Bar graphs show the percentage of cells that are simultaneously labelled by GFAP and the indicated SASP RNAscope HiPlex probes. Error bars represent SD; n = 4 independent biological samples; Student's t test. (h) 3‐month‐old WT and A‐T BOs were treated with NMDA (100 µM), KCl (55mM) and Bicuculline (50 µM) for 30 min. Immediately after, BOs were collected for RNA extraction. RT‐qPCR analysis of the indicated IEGs was performed, and RPLP0 mRNA was used as normalizer. Bar graphs show fold change of IEG levels in stimulated organoids relative to untreated (depicted by a grid line). Error bars represent SD; n = 3 independent experiments. *p<0.05, **p<0.01, Student's t test
FIGURE 4
FIGURE 4
Inhibition of cGAS and STING reduces tissue degeneration and cellular senescence in brain organoids. (a–e) WT and A‐T BOs where treated for one month with aspirin (4mM) or H‐151 (3 µM) starting at 5 months of development. (a) Each point in the scatter plot shows the organoid size of a single BO. At least 8 organoids per condition were analysed. ***p < 0.001; one‐way ANOVA with Tukey's multiple‐comparison post hoc corrections. (b) Representative images from quantifications shown in c. Scale bar, 0.7 mm. (c) SA‐β‐gal assays were performed on WT and A‐T BOs with the indicated treatments. Each point in the scatter plot represents a single BO section analysed. n = 3 independent experiments. *p < 0.05; ***p < 0.001; one‐way ANOVA with Tukey's multiple‐comparison post hoc corrections. (e) Total RNA from WT and A‐T BOs were used for RT‐qPCR analysis. B2M mRNA was used as normalizer. n = 3 independent biological samples. Exact P values can be found in Figure S4
FIGURE 5
FIGURE 5
cGAS and STING inhibition prevents neuronal loss and rescues the transcriptional activation of IEGs upon neuronal excitatory input. (a‐d) WT and A‐T BOs were treated for one month with aspirin (4mM) or H‐151 (3 µM) starting at 5 months of development. (a) Immunofluorescence representative images of BO sections stained for NeuN (green) and GFAP (red). Scale bar, 0.7 mm. (b,c) BO sections stained for NeuN (b) and GFAP & p21 (c) were quantified. Each point in the scatter plot represents a single BO section analysed. Error bars represent SD; n = 4 independent experiments. ***p < 0.001; one‐way ANOVA with Tukey's multiple‐comparison post hoc corrections. (d) A‐T BOs were treated with NMDA (100 µM), KCl (55 mM) and Bicuculline (50 µM) for 30 min. Immediately after, BOs were collected for RNA extraction. RT‐qPCR analysis of the indicated IEGs was performed, and B2M mRNA was used as normalizer. Bar graphs show fold induction of IEG levels in stimulated organoids relative to untreated (no neuronal‐stimulating drug, depicted by a grid line). Error bars represent SD; n = 3 independent experiments. *p < 0.05; **p < 0.01, Each bar was compared to grid line values. Student's t test

References

    1. Acosta, J. C., Banito, A., Wuestefeld, T., Georgilis, A., Janich, P., Morton, J. P., Athineos, D., Kang, T.‐W., Lasitschka, F., Andrulis, M., Pascual, G., Morris, K. J., Khan, S., Jin, H., Dharmalingam, G., Snijders, A. P., Carroll, T., Capper, D., Pritchard, C., … Gil, J. (2013). A complex secretory program orchestrated by the inflammasome controls paracrine senescence. Nature Cell Biology, 15(8), 978–990. 10.1038/ncb2784 - DOI - PMC - PubMed
    1. Aguado, J., Sola‐Carvajal, A., Cancila, V., Revêchon, G., Ong, P. F., Jones‐Weinert, C. W., Wallén Arzt, E., Lattanzi, G., Dreesen, O., Tripodo, C., Rossiello, F., Eriksson, M., & d’Adda di Fagagna, F. (2019). Inhibition of DNA damage response at telomeres improves the detrimental phenotypes of Hutchinson‐Gilford Progeria Syndrome. Nature Communications, 10(1), 4990. 10.1038/s41467-019-13018-3 - DOI - PMC - PubMed
    1. Ahn, J., Xia, T., Konno, H., Konno, K., Ruiz, P., & Barber, G. N. (2014). Inflammation‐driven carcinogenesis is mediated through STING. Nature Communications, 5, 5166. 10.1038/ncomms6166 - DOI - PMC - PubMed
    1. Baker, D. J., & Petersen, R. C. (2018). Cellular senescence in brain aging and neurodegenerative diseases: evidence and perspectives. Journal of Clinical Investigation, 128(4), 1208–1216. 10.1172/JCI95145 - DOI - PMC - PubMed
    1. Barber, G. N. (2015). STING: infection, inflammation and cancer. Nature Reviews Immunology, 15(12), 760–770. 10.1038/nri3921 - DOI - PMC - PubMed

Publication types

MeSH terms