Differential protein expression during growth on model and commercial mixtures of naphthenic acids in Pseudomonas fluorescens Pf-5
- PMID: 34459546
- PMCID: PMC8289671
- DOI: 10.1002/mbo3.1196
Differential protein expression during growth on model and commercial mixtures of naphthenic acids in Pseudomonas fluorescens Pf-5
Abstract
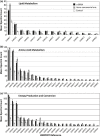
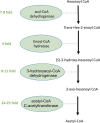
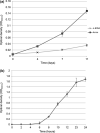
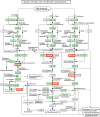
Naphthenic acids (NAs) are carboxylic acids with the formula (Cn H2n+Z O2 ) and are among the most toxic, persistent constituents of oil sands process-affected waters (OSPW), produced during oil sands extraction. Currently, the proteins and mechanisms involved in NA biodegradation are unknown. Using LC-MS/MS shotgun proteomics, we identified proteins overexpressed during the growth of Pseudomonas fluorescens Pf-5 on a model NA (4'-n-butylphenyl)-4-butanoic acid (n-BPBA) and commercial NA mixture (Acros). By day 11, >95% of n-BPBA was degraded. With Acros, a 17% reduction in intensity occurred with 10-18 carbon compounds of the Z family -2 to -14 (major NA species in this mixture). A total of 554 proteins (n-BPBA) and 631 proteins (Acros) were overexpressed during growth on NAs, including several transporters (e.g., ABC transporters), suggesting a cellular protective response from NA toxicity. Several proteins associated with fatty acid, lipid, and amino acid metabolism were also overexpressed, including acyl-CoA dehydrogenase and acyl-CoA thioesterase II, which catalyze part of the fatty acid beta-oxidation pathway. Indeed, multiple enzymes involved in the fatty acid oxidation pathway were upregulated. Given the presumed structural similarity between alkyl-carboxylic acid side chains and fatty acids, we postulate that P. fluorescens Pf-5 was using existing fatty acid catabolic pathways (among others) during NA degradation.
Keywords: Pseudomonas fluorescens; naphthenic acids; oil sands process-affected water; proteomics; tailing ponds; toxicity.
© 2021 The Authors. MicrobiologyOpen published by John Wiley & Sons Ltd.
Conflict of interest statement
None declared.
Figures


Similar articles
-
Microbial biodegradation of aromatic alkanoic naphthenic acids is affected by the degree of alkyl side chain branching.ISME J. 2011 Mar;5(3):486-96. doi: 10.1038/ismej.2010.146. Epub 2010 Oct 21. ISME J. 2011. PMID: 20962873 Free PMC article.
-
Aerobic biotransformation of alkyl branched aromatic alkanoic naphthenic acids via two different pathways by a new isolate of Mycobacterium.Environ Microbiol. 2012 Apr;14(4):872-82. doi: 10.1111/j.1462-2920.2011.02649.x. Epub 2011 Nov 27. Environ Microbiol. 2012. PMID: 22118473
-
Toxicity of naphthenic acid fraction components extracted from fresh and aged oil sands process-affected waters, and commercial naphthenic acid mixtures, to fathead minnow (Pimephales promelas) embryos.Aquat Toxicol. 2015 Jul;164:108-17. doi: 10.1016/j.aquatox.2015.04.024. Epub 2015 Apr 27. Aquat Toxicol. 2015. PMID: 25957715
-
Is biodegradation of bitumen a source of recalcitrant naphthenic acid mixtures in oil sands tailing pond waters?J Environ Sci Health A Tox Hazard Subst Environ Eng. 2005;40(3):671-84. doi: 10.1081/ese-200046637. J Environ Sci Health A Tox Hazard Subst Environ Eng. 2005. PMID: 15756977 Review.
-
In situ bioremediation of naphthenic acids contaminated tailing pond waters in the athabasca oil sands region--demonstrated field studies and plausible options: a review.J Environ Sci Health A Tox Hazard Subst Environ Eng. 2005;40(3):685-722. doi: 10.1081/ese-200046649. J Environ Sci Health A Tox Hazard Subst Environ Eng. 2005. PMID: 15756978 Review.
Cited by
-
The Use of Surface-Modified Nanocrystalline Cellulose Integrated Membranes to Remove Drugs from Waste Water and as Polymers to Clean Oil Sands Tailings Ponds.Polymers (Basel). 2021 Nov 11;13(22):3899. doi: 10.3390/polym13223899. Polymers (Basel). 2021. PMID: 34833197 Free PMC article.
-
Microbial degradation of naphthenic acids using constructed wetland treatment systems: metabolic and genomic insights for improved bioremediation of process-affected water.FEMS Microbiol Ecol. 2023 Nov 13;99(12):fiad153. doi: 10.1093/femsec/fiad153. FEMS Microbiol Ecol. 2023. PMID: 38012121 Free PMC article.
-
Construction of Whole Cell Bacterial Biosensors as an Alternative Environmental Monitoring Technology to Detect Naphthenic Acids in Oil Sands Process-Affected Water.ACS Synth Biol. 2024 Oct 18;13(10):3197-3211. doi: 10.1021/acssynbio.4c00260. Epub 2024 Sep 23. ACS Synth Biol. 2024. PMID: 39312753
References
-
- Ahad, J. M. E. , Pakdel, H. , Gammon, P. R. , Siddique, T. , Kuznetsova, A. , & Savard, M. M. (2018). Evaluating in situ biodegradation of 13C‐labelled naphthenic acids in groundwater near oil sands tailings ponds. Science of the Total Environment, 643, 392–399. - PubMed
-
- Alharbi, H. , Saunders, D. M. , Al‐Mousa, A. , Alcorn, J. , Pereira, A. S. , Martin, J. W. , Giesey, J. P. , & Wiseman, S. B. (2016). Inhibition of ABC transport proteins by oil sands process affected water. Aquatic Toxicology, 170, 81–88. - PubMed
-
- Alldridge, L. , Metodieva, G. , Greenwood, C. , Al‐Janabi, K. , Thwaites, L. , Sauven, P. , & Metodiev, M. (2008). Proteome profiling of breast tumors by gel electrophoresis and nano‐scale electrospray ionization mass spectrometry. Journal of Proteome Research, 7, 1458–1469. - PubMed
-
- Allesen‐Holm, M. , Barken, K. B. , Yang, L. , Klausen, M. , Webb, J. S. , Kjelleberg, S. , Molin, S. , Givskov, M. , & Tolker‐Nielsen, T. (2006). A characterization of DNA release in Pseudomonas aeruginosa cultures and biofilms. Molecular Microbiology, 59, 1114–1128. - PubMed
-
- Altschul, S. F. , Gish, W. , Miller, W. , Myers, E. W. , & Lipman, D. J. (1990). Basic local alignment search tool. Journal of Molecular Biology, 215, 403–410. - PubMed
Publication types
MeSH terms
Substances
Grants and funding
LinkOut - more resources
Full Text Sources

