. 2021 Oct 4;218(10):e20202317.
doi: 10.1084/jem.20202317. Epub 2021 Aug 30.

Helios represses megakaryocyte priming in hematopoietic stem and progenitor cells

Affiliations

Helios represses megakaryocyte priming in hematopoietic stem and progenitor cells

Giovanni Cova et al. J Exp Med. .

Abstract

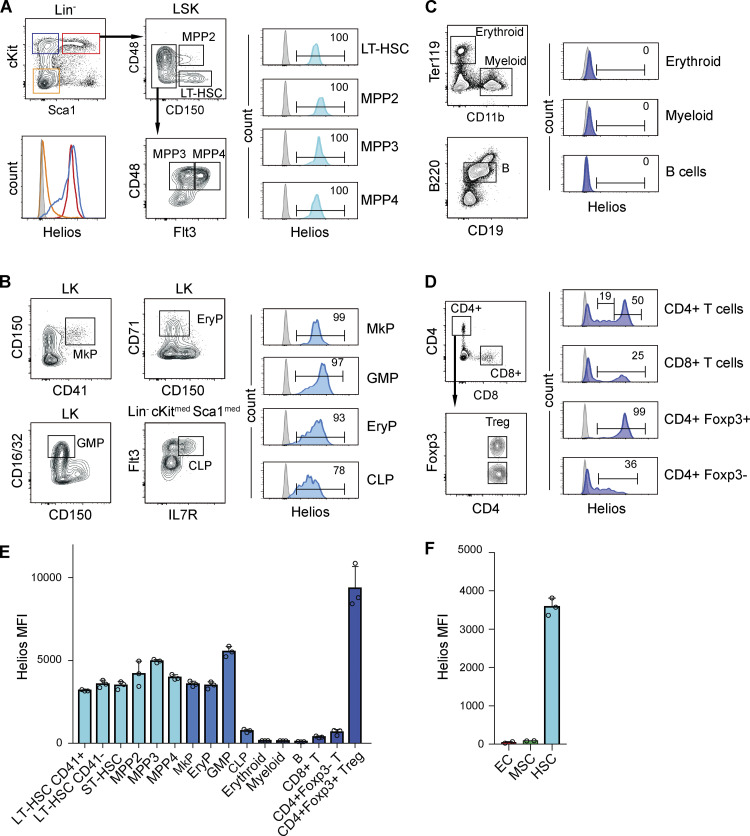
Our understanding of cell fate decisions in hematopoietic stem cells is incomplete. Here, we show that the transcription factor Helios is highly expressed in murine hematopoietic stem and progenitor cells (HSPCs), where it is required to suppress the separation of the platelet/megakaryocyte lineage from the HSPC pool. Helios acts mainly in quiescent cells, where it directly represses the megakaryocyte gene expression program in cells as early as the stem cell stage. Helios binding promotes chromatin compaction, notably at the regulatory regions of platelet-specific genes recognized by the Gata2 and Runx1 transcriptional activators, implicated in megakaryocyte priming. Helios null HSPCs are biased toward the megakaryocyte lineage at the expense of the lymphoid and partially resemble cells of aging animals. We propose that Helios acts as a guardian of HSPC pluripotency by continuously repressing the megakaryocyte fate, which in turn allows downstream lymphoid priming to take place. These results highlight the importance of negative and positive priming events in lineage commitment.


Conflict of interest statement

Disclosures: The authors declare no competing interests exist.

Figures

Figure 1.
Figure 1.
Helios is highly expressed in HSPCs. (A–D) Representative gating strategies and Helios expression in BM hematopoietic cell populations. The gray histograms correspond to total BM cells stained with the secondary Ab alone. In A, the LSK (LinSca1+cKit+, red gate), LK (LinSca1cKit+, blue gate), and LinSca1cKit (orange gate) cells are indicated. Numbers correspond to percentages. The indicated HSPC populations are as follows: LT-HSC, CD48CD150+ LSK; MPP2, CD48+CD150+ LSK; MPP3, CD48+CD150Flt3 LSK; MPP4, CD48+CD150Flt3+ LSK; MkP, CD150+CD41+ LK; GMP, CD150CD16/32+ LK; EryP, CD71+ LK; CLP, LincKitmedSca1medFlt3+IL7R+. The mature cell populations are as follows: erythroid, Ter119+CD71+CD11b; myeloid, CD11b+B220Ter119; B cell, B220+CD19+; CD4+ T cell, CD4+CD8; CD8+ T cell, CD4CD8+; Treg cell, CD4+Foxp3+; non-Treg T cell, CD4+Foxp3. (E) Helios median fluorescence intensity (MFI) in the indicated populations. Light blue bars indicate HSPC populations. Medium blue bars indicate committed progenitors. Dark blue bars indicate mature cells. (F) Helios MFI in BM non-hematopoietic cells: EC, CD45NG2CD31+; MSC, CD45NG2+CD31; total LT-HSCs as positive control. In E and F, mean ± SD of two to three independent experiments.
Figure S1.
Figure S1.
Impact of Helios deficiency on mature BM hematopoietic populations. (A) Combined BM cellularity of tibias, femurs, pelvis, and sternum from 10-wk-old WT and KO mice (females and males). Lines connect samples from the same experiment. (B) Representative contour plots depicting myeloid cells and their relative percentages in 6-, 10-, and 20-wk-old mice. Mean ± SD of two to seven independent experiments. (C) Graphs showing the MFI for Ikaros and Eos in the indicated populations from WT and KO mice. Mean ± SD of three independent experiments. Representative histograms are shown on the right. Splenic Treg cells were used a positive control for Eos expression. (D and E) Representative contour plots depicting B cells and their relative percentages as in B, and B cell development using the Hardy classification scheme. (F) Representative contour plots depicting CD4+ and CD8+ T cells and their relative percentages as in B. (G) Representative contour plots depicting indicated populations as in B for the erythroid population (quantification only for 10- and 20-wk-old mice). Unpaired two-tailed t test: *, P < 0.05; **, P < 0.01.
Figure 2.
Figure 2.
Helios deficiency affects BM megakaryocyte and lymphoid progenitor frequencies. (A–G) Relative abundance of the indicated BM populations in WT and KO mice at 6, 10, and 20 wk of age. Representative contour plots and statistical significance are shown. In the histograms of D and E, the control histogram shows the CD41 level of WT MPPs (CD48+CD150 LSK). Numbers in the plots correspond to percentages. Each data point corresponds to one mouse; mean ± SD are shown per population for four to eight mice from multiple independent experiments. Unpaired two-tailed t test: *, P < 0.05; **, P < 0.01; ***, P < 0.001.
Figure 3.
Figure 3.
In vitro differentiation of Helios KO HSPCs. (A) Strategy of CFU-Mk/CFU-Myeloid and CFU–preB assays. (B) Ratios of CFU-Mk and CFU-Myeloid (granulo-monocyte) from 5 × 10⁴ BM cells seeded after 7 d. Mean ± SD of four independent experiments. Representative MGG staining of different colonies are shown. (C) Number of CFU-preB from 15 × 104 BM cells seeded after 7 d. Each data point represents the mean of duplicate cultures for each mouse. Mean ± SD of four independent experiments. Representative MGG staining of preB cell colonies shown. (D) Strategy of single-cell LT-HSC cultures (left). 100 wells were seeded for each sample. Percentage of wells containing CFU-Mk+ or CFU-Myeloid after 10 d is indicated. Boxes represent the mean ± SD of six independent experiments. Representative MGG staining of colonies are shown. (E) Strategy of single-cell MPP cultures (left). 120 wells were seeded for each sample. Percentage of wells containing CFU-Myeloid after 7 d is indicated. Boxes represent the mean ± SD of four independent experiments. Mk, megakaryocyte; Mo, monocyte/macrophage; PMN, polymorphonuclear granulocyte. Scale bars correspond to 50 µm. Unpaired two-tailed t test: *, P < 0.05; **, P < 0.01. Paired two-tailed t test: ##, P < 0.01.
Figure 4.
Figure 4.
In vivo lymphoid potential of Helios KO HSPCs. (A) Strategy of MPP transplantation (left). Representative contour plot of peripheral blood cell staining (middle). Numbers correspond to percentages. Mean ± SD of four independent experiments with three to five recipient mice per donor genotype (right). Each data point represents the percentage of donor cells per recipient. B, B220+ cells; My, CD11b+ cells. (B) Strategy of LT-HSC transplantation (top left). Representative contour plot of peripheral blood cell staining (top right). Numbers correspond to percentages. Mean ± SD of two (T cells) or three (B and myeloid cells) independent experiments, with six to eight recipient mice per donor genotype (bottom). Each data point represents the percentage donor cells per recipient. (C) HSPC phenotype of Helios cKO mice. Top: Flow cytometry analysis of Helios expression in LSK cells from WT, KO, and cKO mice, analyzed 3 wk after tamoxifen-induced Ikzf2 inactivation. Bottom: Analysis of the indicated BM populations in WT and cKO mice. Mean ± SD of four independent experiments with seven to nine mice per genotype. Unpaired two-tailed test: **, P < 0.01; ***, P < 0.001.
Figure S2.
Figure S2.
BM inflammation phenotype of Helios-KO mice. (A) Representative contour plot of the indicated BM populations, and their relative quantification in 10–20-wk-old mice. (B) Representative dot plot of cytokine staining from enriched and stimulated BM CD4+ T cells (see Materials and methods) of 6-, 10-, and 20-wk-old mice. Mean ± SD of four independent experiments. Unpaired two-tailed t test: *, P < 0.05; **, P < 0.01. (C) Representative histograms of CD41 expression in the indicated populations of WT and KO mice 16 h after poly I:C challenge. CD41 MFI FC was assessed in WT and KO populations from poly I:C– or control-treated mice. Relative quantification of indicated BM populations of WT and KO mice from control and poly I:C–treated mice. Mean ± SD of five independent experiments. Unpaired two-tailed t test: *, P < 0.05; **, P < 0.01; ***, P < 0.001.
Figure 5.
Figure 5.
HSPC phenotype in TKO mice and competitive repopulation assays. (A) Analysis of the indicated populations in mice with a Helios deletion in T cells. WT, Ikzf2f/f CD4-Cre; TKO, Ikzf2f/f CD4-Cre+; KO, Ikzf2−/−. Sex- and age-matched (10–20-wk-old) mice were studied. Mean ± SD of five to eight independent experiments. (B) Strategy of competitive BM transplantations (left). PB, peripheral blood. The percentage of B and myeloid cells from competitor and donor cells is indicated. Mean ± SD of four independent experiments with six or seven recipient mice per genotype. Unpaired two-tailed t test: ***, P < 0.001.
Figure 6.
Figure 6.
Helios KO HSPCs are transcriptionally primed toward the megakaryocyte lineage. (A) Heatmap of up- and down-regulated genes in LT-HSCs, MPP3 cells, and MPP4 cells. Highlighted genes in the LT-HSC samples correspond to those specific for MkPs and up-regulated (in red). (B and C) GSEA of the indicated populations. Ranked gene lists comprise all genes detected in the RNA-seq analysis, ranked according to their FC (KO vs. WT). Gene sets correspond to signature genes for MkPs (Grover et al., 2016), MPP4s (described in Materials and methods), and genes up- or down-regulated in old LT-HSCs (Sun et al., 2014). The normalized enrichment score (NES) and P values are shown for each analysis. (D) Metascape analyses of up- (red) and down- (blue) regulated genes in the KO LT-HSCs. Each cluster is defined by its identity name and is composed of nodes that share similar genes. Node size is proportional to the gene content number. (E) Relative abundance of the indicated BM populations in young (15-wk-old) and old (>1-yr-old) WT and KO mice. The histogram shows representative levels of CD41 in WT and KO LT-HSCs from young and old mice. Mean ± SD of five independent experiments, with three to seven mice per genotype. Unpaired two-tailed t test: *, P < 0.05; **, P < 0.01; ***, P < 0.001.
Figure S3.
Figure S3.
Transcriptome of CD34Flt3 LT-HSCs, Helios expression in young and old mice, and Ikaros expression in KO HSPCs. (A) GSEA of the CLP signature among genes deregulated in KO versus WT MPP3 and MPP4 cells. Ranked gene lists comprise all genes detected in the RNA-seq experiments, ranked according to their FC (KO vs. WT). CLP signature genes (Grover et al., 2016) were used as gene sets. The NES and P values are shown for each analysis. (B) Metascape enrichment analysis for the genes deregulated in Helios-KO LT-HSCs (selected from the analysis shown in Fig. 6 A), after separation into groups meeting stringent (adj P < 0.05) and mild 0.05< adj P < 0.2) statistical criteria. (C) Heatmap of up- and down-regulated genes in WT and KO LT-HSCs (CD34Flt3 LSK) and L-MPPs (CD34+Flt3+ LSK), analyzed with Affymetrix 430 2.0 microarrays. (D) GSEA of LT-HSCs and L-MPP (CD34+Flt3+ LSK) cells, using as ranked lists up- and down-regulated genes (KO vs. WT, P value<0.05). Signature lists of MkP and CLP (Grover et al., 2016) and up- and down-regulated genes in old HSCs (Sun et al., 2014) were used as gene sets. NES and P values are shown for each analysis. (E) Relative Helios protein levels in the indicated HSPC populations of young (10-wk-old) and old (>1-yr-old) WT mice, as determined by MFI of flow cytometry results of six independent experiments. (F) Relative Helios protein in CD41+ and CD41 LT-HSCs of young (10-wk-old) and old (>1-yr-old) WT mice, as determined by MFI of flow cytometry results of six (from young) and three (from old) independent experiments. Unpaired two-tailed t test: **, P < 0.01; ***, P < 0.001.
Figure S4.
Figure S4.
Genomic analysis of Helios function in HPC7 and LSK cells. (A) LSK and LK phenotype of HPC7 cells and Helios expression. Blue histogram corresponds to cells stained with the secondary Ab only. FSC, forward scatter; SSC, side scatter. (B) Helios binding across genomic regions: promoter (−3 kb from transcription start site), gene body (exons, introns, UTR), distal intergenic. (C) Enriched DNA motifs found within the 1000 regions with the strongest Helios binding (ranked by decreasing pileup score). (D) Frequency of genes bound by Helios among those from the LT-HSC, MPP4, or MkP signatures, or among genes deregulated in He KO LT-HSCs. Random sets of 500 genes were selected from genes detected in the RNA-seq experiment. Poorly defined genes (Riken genes or Gene Models, rarely bound by Helios) were excluded from the gene lists that were intersected with the list of Helios-bound genes. ***, P < 0.001 (hypergeometric test). (E) Proportion of Helios-bound sites with a significant increase in chromatin accessibility (ATAC log2FC > 0.5; adj P < 0.1) among all ATAC-seq peaks, or peaks associated with MPP4 or MkP genes. P values were calculated with the hypergeometric test. (F) Metascape analysis of the enriched pathways associated with ATAC-seq regions that were significantly increased in KO LSK cells (adj P < 0.2). (G) Integrative genome viewer screenshots of WT and KO LSK ATAC-seq signals, and Helios, Gata2, and Runx1 binding in HPC7 cells, for the representative MPP4 genes. (H) Left: Seq-miner heatmap showing Helios, Gata2, and Runx1 binding on the 10,890 Helios-bound regions that coincided with an ATAC-seq peak. Three clusters (C1–C3) were defined using K-means clustering. Right: Mean profiles of the ATAC-seq signals in peaks from clusters C1–C3, in each pair of WT/KO replicates. (I) Proportion of Helios sites bound by Gata2 and/or Runx1, based on the magnitude of ATAC-seq changes. P values were calculated with the hypergeometric test, using the frequency of Gata2/Runx1 binding among unchanged peaks (−0.1 < log2FC < 0.1) as a reference distribution.
Figure 7.
Figure 7.
Helios targets HSPC genes through gene repression. (A) Box plots showing the distribution of the log2FC values of the ATAC-seq peaks in KO versus WT LSK samples, bound or not by Helios in HPC7 cells, either among all ATAC-seq peaks or those associated with MPP4 and MkP signature genes. Each box plot was generated with a random selection of 300 regions. Mann–Whitney test: ***, P < 0.001. (B) Percentage of chromatin regions containing “Helios sites” where the ATAC-seq peaks varied between WT and KO cells. Left: ATAC-seq peaks were divided into four subsets, based on whether their intensity decreased or increased < or >0.3-fold (log2FC) in KO cells. Right: Percentage of Helios binding at ATAC-seq peaks with the most significant variations (FC >0.3, adj P < 0.1 or adj P < 0.05). The numbers above each bar indicate the number of Helios-bound peaks (top) within the total number of peaks in the subset (bottom). Hypergeometric test: *, P < 0.02; ***, P < 10−10. (C) Volcano plots showing log2FC versus −log2(adj p) for Helios-bound MkP and MPP4 genes or a set of random genes. Red dots highlight regions for which −log2(adj p) was >3.5. (D) Integrative genome viewer screenshots of representative platelet genes. Shown are ATAC-seq signals in WT and KO LSK cells and Helios, Gata2, and Runx1 binding in HPC7 cells (Gata2 and Runx1 data are from the GEO dataset GSE22178). Boxed regions belong to the regions selected in C as having significant increases of ATAC-seq signals in KO cells. (E) Seq-miner heatmap showing 4,370 regions with significantly increased ATAC-seq signals in KO versus WT LSK cells (adj P < 0.2), along with Helios, Gata2, and Runx1 binding in HPC7 cells. Motif enrichment within the 1327 ATAC-seq peaks bound by Helios (top cluster). (F) Box plot showing ATAC-seq log2FC for regions bound or not by Helios and/or Runx1 and Gata2. ***, P < 0.001 (Mann–Whitney test). (G) Frequency of Gata2 and/or Runx1 binding on Helios-bound MPP4 and MkP sites. In the right part of the graph, analyzed regions were restricted to those with an ATAC-seq log2FC >0.2. **, P < 0.01; ***, P < 0.001 (hypergeometric test). (H) Metascape analysis of the enriched pathways associated with genes commonly bound by Helios and/or Gata2 and Runx1 (cluster C1 in Fig. S4 H). Pathways associated with the megakaryocyte lineage are highlighted.
Figure S5.
Figure S5.
PCAs of single-cell RNA-seq and comparison of HSPCs using protein vs mRNA expression. (A) Ranking of the PC variations that define the HSPC population, (ElbowPlot function; Seurat library). PC1–PC3, which account for most of the variations, are indicated in red. (B) Dot plot depicting PC1–PC3 features with the top 30 negative (red) and positive (blue) genes contributing to each PC, ranked according to their relative score. (C and D) Top: Metascape pathway analysis of the highlighted PC1 and PC2 genes from B. Pathways associated with top negative (red) and positive (blue) PC1 genes are highlighted. Bottom: Representative examples of negative (red) and positive (blue) PC1 or PC2 genes and their expression patterns within the HSPC UMAP. The corresponding positions of these genes are shown in the dot plot in B. (E) Top: Comparison of gene expression values between MPP4 (or MPP3) versus LT-HSC for the PC3 genes. Genes with a positive score, expressed higher in MPP4 cells, are in blue; genes with a negative score, expressed higher in LT-HSCs, are in red. A similar analysis was performed between MPP3 and LT-HSC (green), which showed that MPP3 cells expressed PC3 genes at an intermediate level compared with LT-HSC and MPP4 cells. Bottom: Representative examples of negative (red) and positive (blue) PC3 genes and their expression patterns within the HSPC UMAP. The corresponding positions of these genes are shown in the dot plot in B. (F) Left: UMAPs depicting LT-HSC (CD150+CD48) and MPP (CD150CD48+) populations, as defined by their CD150 and CD48 CITE-seq Ab labeling. Right: UMAPs depicting LT-HSC (Slamf1+Cd48 or Cd34Cd48) and MPP (Slamf1Cd48+) populations, as defined by their mRNA expression.
Figure 8.
Figure 8.
Helios affects lineage priming at the single-cell level. (A and B) UMAP plots of WT and KO HSPCs, derived from one WT and one KO sample with similar numbers of sequenced cells. (A) Characterization and quantification of HSPCs based on their cell cycle feature, as indicated. (B) Characterization and quantification of HSPCs based on their lineage-priming features. The quantification of the cells is shown below the UMAP plots. (C) Left: Heatmaps of single, quiescent WT and KO HSPCs. The order of the cells from left to right corresponds to their lineage priming score. The y axis indicates the 60 genes that contribute the most to the PC3 variance (top 30 negative genes in red, and top 30 positive genes in blue). The white vertical lines correspond to the positions of cells with a lineage priming score of 0. Right: Lineage-priming score of WT and KO quiescent HSPCs. Mean ± SD of two pooled independent experiments. (D) Left: Heatmaps of single, cycling WT and KO HSPCs, ordered as in C. Right: Lineage-priming score of WT and KO cycling HSPCs. Mean ± SD of two pooled independent experiments. Statistical significance calculated with Mann–Whitney test: *, P = 0.01; ****, P < 0.0001.

References

    1. Akashi, K., Traver D., Miyamoto T., and Weissman I.L.. 2000. A clonogenic common myeloid progenitor that gives rise to all myeloid lineages. Nature. 404:193–197. 10.1038/35004599 - DOI - PubMed
    1. Allman, D., Sambandam A., Kim S., Miller J.P., Pagan A., Well D., Meraz A., and Bhandoola A.. 2003. Thymopoiesis independent of common lymphoid progenitors. Nat. Immunol. 4:168–174. 10.1038/ni878 - DOI - PubMed
    1. Anders, S., Pyl P.T., and Huber W.. 2015. HTSeq--a Python framework to work with high-throughput sequencing data. Bioinformatics. 31:166–169. 10.1093/bioinformatics/btu638 - DOI - PMC - PubMed
    1. Aurrand-Lions, M., and Mancini S.J.C.. 2018. Murine Bone Marrow Niches from Hematopoietic Stem Cells to B Cells. Int. J. Mol. Sci. 19:E2353. 10.3390/ijms19082353 - DOI - PMC - PubMed
    1. Badea, T.C., Hua Z.L., Smallwood P.M., Williams J., Rotolo T., Ye X., and Nathans J.. 2009. New mouse lines for the analysis of neuronal morphology using CreER(T)/loxP-directed sparse labeling. PLoS One. 4:e7859. 10.1371/journal.pone.0007859 - DOI - PMC - PubMed

Publication types

MeSH terms