Comparative Study
. 2021 Jan-Dec;13(1):1964420.
doi: 10.1080/19420862.2021.1964420.

A non-clinical comparative study of IL-23 antibodies in psoriasis

Affiliations
Comparative Study

A non-clinical comparative study of IL-23 antibodies in psoriasis

Li Zhou et al. MAbs. 2021 Jan-Dec.

Abstract

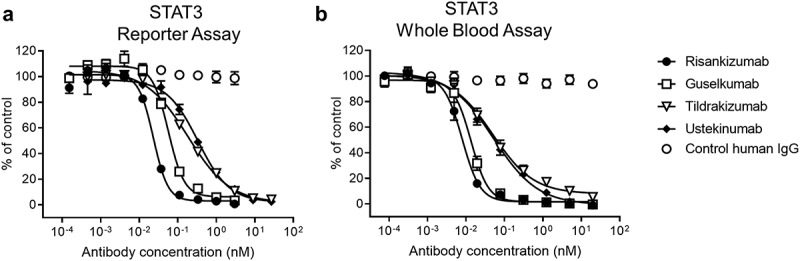
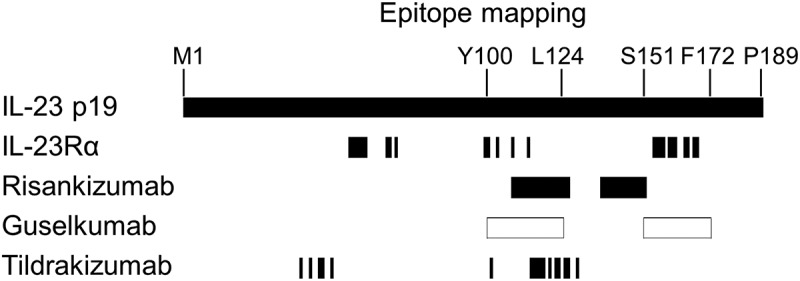
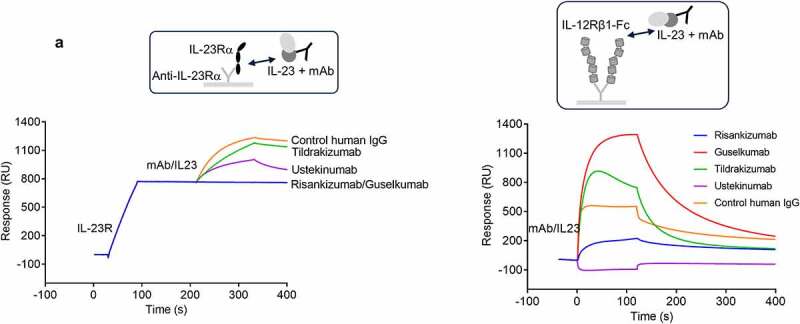
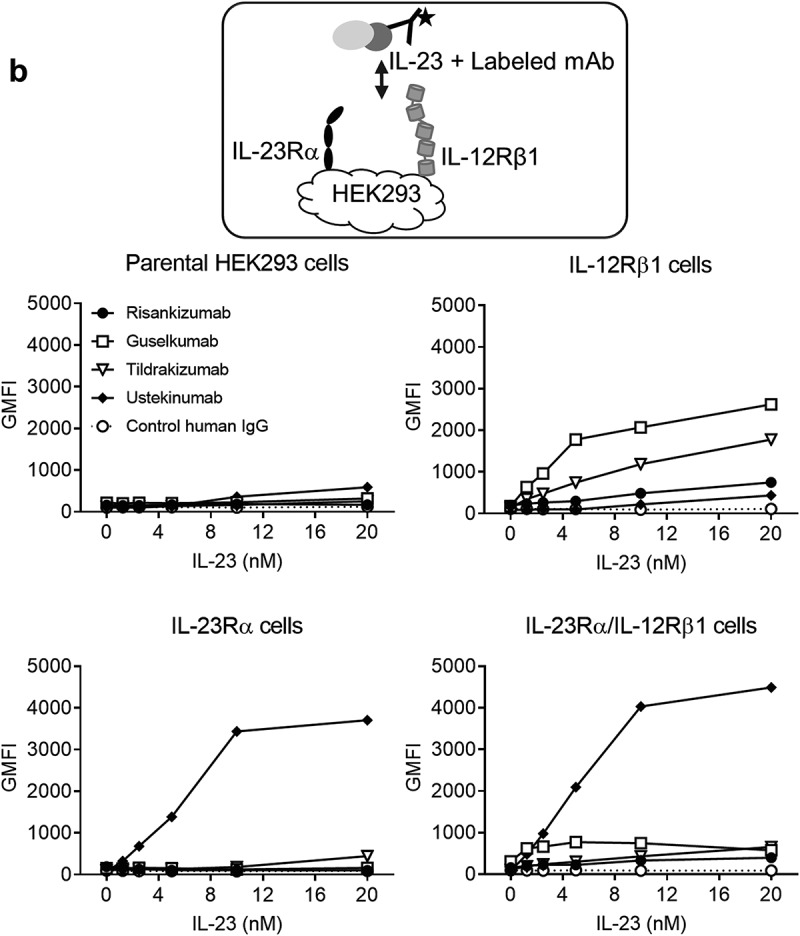
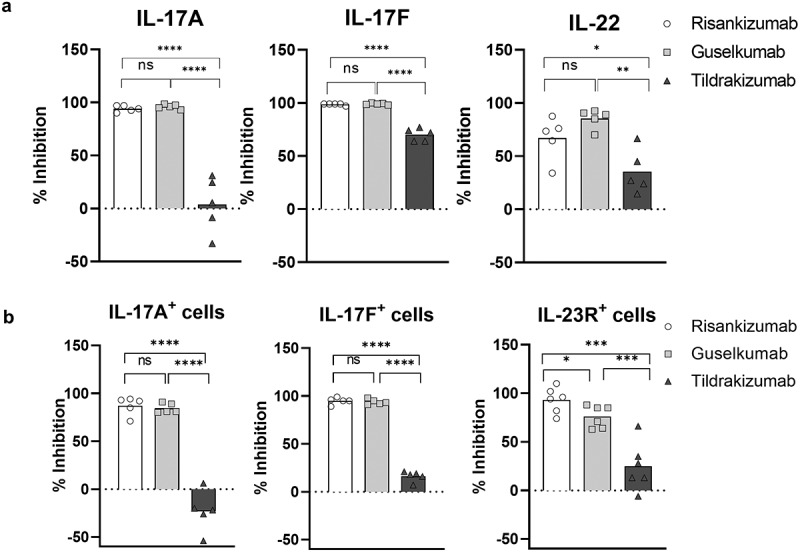
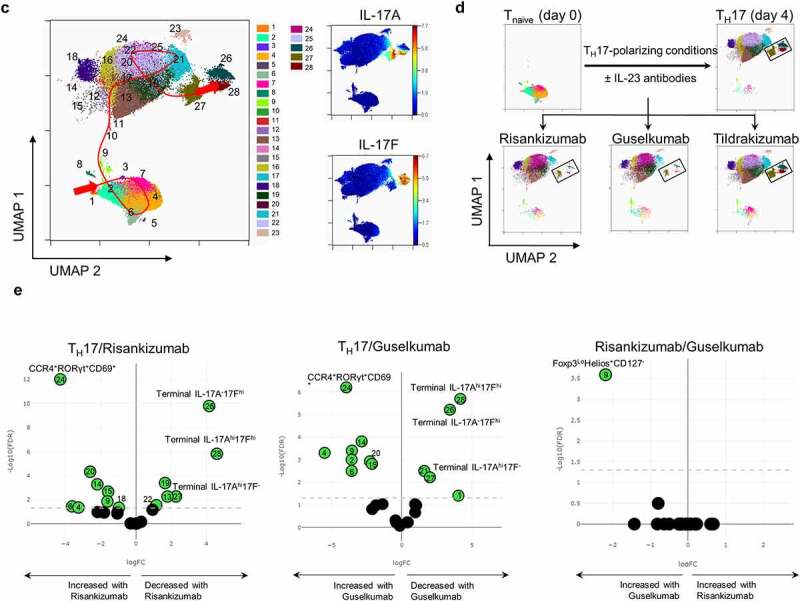
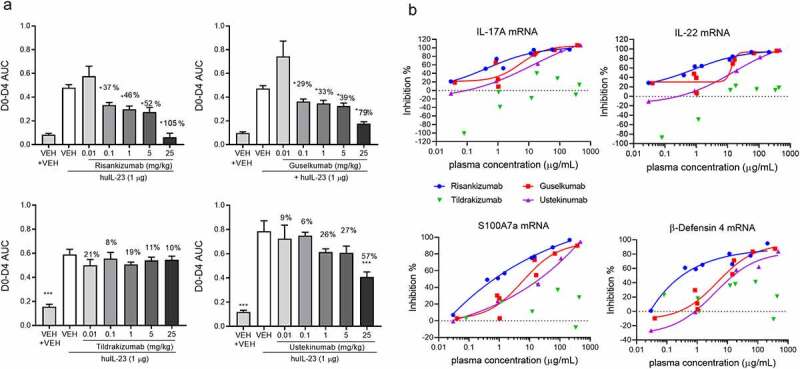
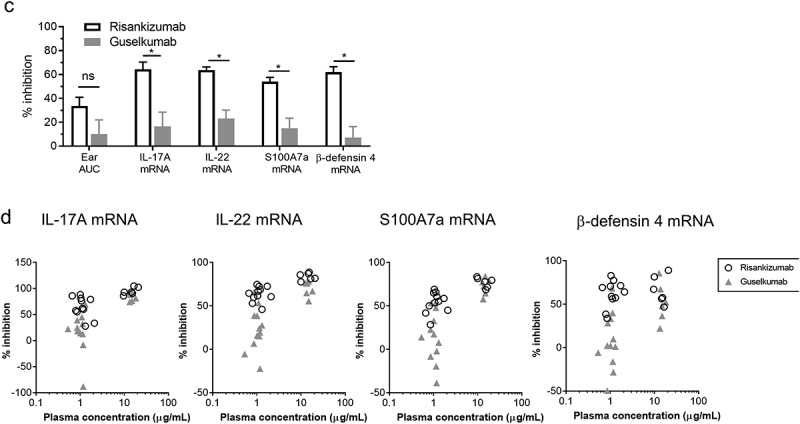
Four antibodies that inhibit interleukin (IL)-23 are approved for the treatment of moderate-to-severe plaque psoriasis. Here, we present non-clinical data comparing ustekinumab, guselkumab, tildrakizumab and risankizumab with regard to thermostability, IL-23 binding affinity, inhibitory-binding mode, in vitro potency and in vivo efficacy. Risankizumab and guselkumab exhibited 5-fold higher affinity for IL-23 and showed more potent inhibition of IL-23 signaling than ustekinumab and tildrakizumab. Risankizumab and guselkumab completely blocked the binding of IL-23 to IL-23Rα as expected, whereas tildrakizumab did not. In vitro, risankizumab and guselkumab blocked the terminal differentiation of TH17 cells in a similar manner, while tildrakizumab had minimal impact on TH17 differentiation. In a human IL-23-induced ear-swelling mouse model, risankizumab and guselkumab were more effective than ustekinumab and tildrakizumab at reducing IL-17, IL-22, and keratinocyte gene expression. Our results indicate that the four clinically approved antibodies targeting IL-23 differ in affinity and binding epitope. These attributes contribute to differences in in vitro potency, receptor interaction inhibition mode and in vivo efficacy in preclinical studies as described in this report, and similarly may affect the clinical performance of these drugs.

Keywords: IL-12; IL-23; autoimmune disease; guselkumab; psoriasis; risankizumab; tildrakizumab; ustekinumab.


Conflict of interest statement

Mark Konrad, Denise Perron, Yibing Wang, Jun Zhang and Gary Overmeyer are former AbbVie employees and may own AbbVie stock. All other listed authors are AbbVie employees and may own AbbVie stock.

Figures

Figure 1.
Figure 1.
In vitro potency of the IL-23 antibodies. (a) Dose-dependent inhibition of STAT3 luciferase reporter expression in HeLa cells with the stimulation of 1 ng/mL IL-23 (n = 3). (b) Dose-dependent inhibition of pSTAT3 expression by FACS in CD45+ CD161hi cells from human whole blood with the stimulation of 1 ng/mL IL-23 (n = 6 with 3 healthy donors). Data are plotted as mean ± SEM. Antibody potency was determined by calculating the inhibitory concentration that results in 50% inhibition (IC50) and 80% inhibition (IC80) with 95% confidence interval (CI). Data and statistical analysis are summarized in (Table 3)
Figure 2.
Figure 2.
Epitope alignment of IL-23 Rα and IL-23 antibodies on the IL-23p19 sequence. The epitopes of guselkumab (white boxes) and risankizumab (black boxes) as determined by HDX-MS. The epitopes of tildrakizumab and IL-23 Rα as determined by x-ray crystallography are shown in black bars
Figure 3.
Figure 3.
The binding mode of antibodies, IL-23 and IL-23 receptors characterized by SPR and FACS. (a) the SPR sensorgram of antibody/IL-23 complexes binding to IL-23 Rα (left) or IL-12Rβ1-Fc (right) immobilized on the chip. (b) IL-23/antibody complexes, comprising Zenon-labeled antibody (10 nM) and human scIL-23 at concentrations ranging from 1.25 to 20 nM, were added to HEK293 cells expressing either one or two IL-23 receptor subunits for one hour on ice prior to FACS analysis
Figure 3.
Figure 3.
Continued
Figure 4.
Figure 4.
Treatment of naïve T cells in TH17 polarizing conditions with IL-23 antibodies results in loss of terminally differentiated IL-17+ cells and accumulation of TH17 differentiation intermediates. (a) The inhibition of IL-17A, IL-17 F and IL-22 cytokine secretion by IL-23 antibodies at day 4 of TH17 polarization analyzed by multiplex. (b) The inhibition of IL-17A, IL-17 F, and IL-23 R expressing cells by IL-23 antibodies at day 4 of TH17 polarization analyzed by mass (IL-17A, IL-17 F; n = 5) or flow (IL-23 R; n = 6) cytometry. ns. not significant. * p ≤ 0.05; ** p ≤ 0.01; *** p ≤ 0.005; **** p ≤ 0.001. (c) UMAP dimension reduction of all events from mass cytometry analysis of all day 4 treatment groups shows the landscape of populations arising during TH17 differentiation. PhenoGraph cell clustering identified 28 populations as shown in the legend. The Wanderlust algorithm was run using PhenoGraph population 2 as the seed population, and populations were then numbered according to the Wanderlust predicted order of differentiation. The red line indicates a likely path of differentiation. The terminally differentiated clusters expressing IL-17A (cluster 27), IL-17 F (cluster 26) or IL-17A and IL-17 F (cluster 28) are shown along with the expression of IL-17A and IL-17 F. (d) The UMAP plot of mass cytometry data from (c) is shown for individual treatment groups, which demonstrates the redistribution of populations as a result of treatment with IL-23 antibodies. Terminally differentiated IL-17hi clusters are highlighted with black rectangles. (e) Volcano plots show the fold change of PhenoGraph clusters following treatment with risankizumab compared to the TH17 control, guselkumab compared to the TH17 control, and risankizumab compared to guselkumab treatment. A false discovery rate (FDR) of 0.05 is shown with the dotted line to indicate the threshold for significant change. Populations that changed significantly are shown in green. n = 5 in c-e
Figure 4.
Figure 4.
Continued
Figure 5.
Figure 5.
Risankizumab and guselkumab differentially inhibited IL-23 induced skin inflammation. (a) Ear swelling of vehicle- and IL-23-injected animals that were administrated with either PBS (Veh+Veh) or various doses of antibodies are represented by day 0 to day 4 area under the curve ear thickness measurement (D0-D4 AUC). Data are shown as bar graph with mean + SEM. Values of mean percentages of inhibition (compared to the IL-23 injected alone animals) of the significantly reduced groups are also labeled on the graph. Data are pooled from two studies of four antibodies with total 11–12 animals in each dosing group. Significance was analyzed using one-way ANOVA with Tukey’s or Dunnetts multiple comparison post hoc analysis. (b) The percentage inhibition of IL-17A, IL-22, S100A7a and β-Defensin 4 mRNA expression from (a) are plotted against the plasma concentrations of the antibody dosed groups in the IL-23 injected animals. Each point represents the mean values of the dosing group from pooled studies. Non-linear regression curve fittings of the four antibodies are also indicated on the plot using four parameter fit algorithm. (c) The percentage inhibitions of ear thickness AUC, and inhibition of IL-17A, IL-22, S100A7a and β-Defensin 4 mRNA expression from the head-to-head comparison studies between 0.1 mg/kg dosed risankizumab and guselkumab are plotted as bar graphs. Data are pooled from two studies with total 11–12 animals in each group and shown as mean + SEM. Significance was analyzed using two-way ANOVA with Sidak’s multiple comparison post hoc analysis. * p ≤ 0.05; ns, no significance, i.e., p > .05. (d) The percentage inhibition of IL-17A, IL-22, S100A7a and β-defensin 4 mRNA expression from individual animals of the head-to-head comparison studies that were dosed with antibodies at 0.1 and 1 mg/kg are plotted against the plasma concentrations of the antibodies of correlated animals. Data are pooled from two studies with 5–6 animals per group in each study
Figure 5.
Figure 5.
Continued

References

    1. Website International Federation of Psoriasis Associations (IFPA) Our Cause: Psoriasis . [Accessed 03]. https://ifpa-pso.com/our-cause
    1. Chiricozzi A, Romanelli P, Volpe E, Borsellino G, Romanelli M.. Scanning the Immunopathogenesis of Psoriasis. Int J Mol Sci. 2018;19(1):1. doi:10.3390/ijms19010179. - DOI - PMC - PubMed
    1. Di Cesare A, Di Meglio P, Nestle FO. The IL-23/Th17 axis in the immunopathogenesis of psoriasis. J Invest Dermatol. 2009;129(6):1339–16. doi:10.1038/jid.2009.59. - DOI - PubMed
    1. Chiricozzi A, Saraceno R, Chimenti MS, Guttman-Yassky E, Krueger JG. Role of IL-23 in the pathogenesis of psoriasis: a novel potential therapeutic target? Expert Opin Ther Targets. 2014;18(5):513–25. doi:10.1517/14728222.2014.889686. - DOI - PubMed
    1. Benson JM, Peritt D, Scallon BJ, Heavner GA, Shealy DJ, Giles-Komar JM, Mascelli MA. Discovery and mechanism of ustekinumab: a human monoclonal antibody targeting interleukin-12 and interleukin-23 for treatment of immune-mediated disorders. MAbs. 2011;3(6):535–45. doi:10.4161/mabs.3.6.17815. - DOI - PMC - PubMed

Publication types

MeSH terms