

Non-Contact Automatic Vital Signs Monitoring of Infants in a Neonatal Intensive Care Unit Based on Neural Networks
- PMID: 34460758
- PMCID: PMC8404938
- DOI: 10.3390/jimaging7080122
Non-Contact Automatic Vital Signs Monitoring of Infants in a Neonatal Intensive Care Unit Based on Neural Networks
Abstract
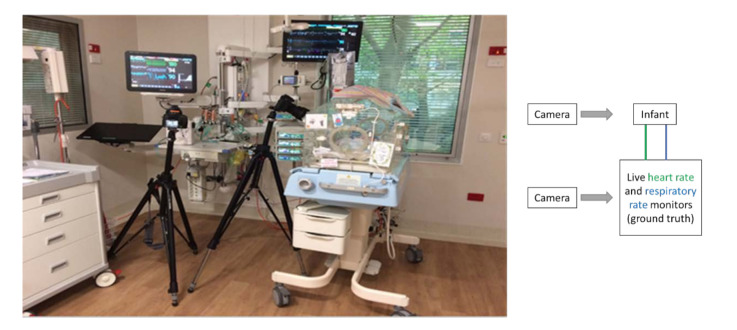
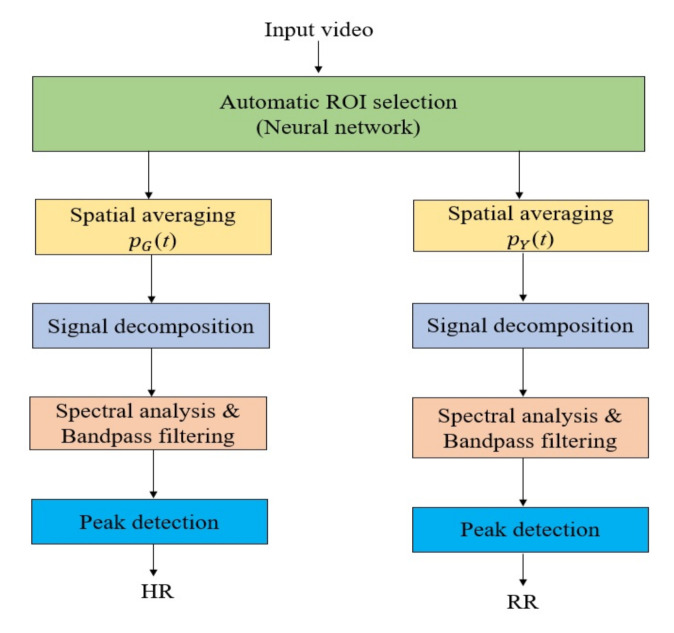
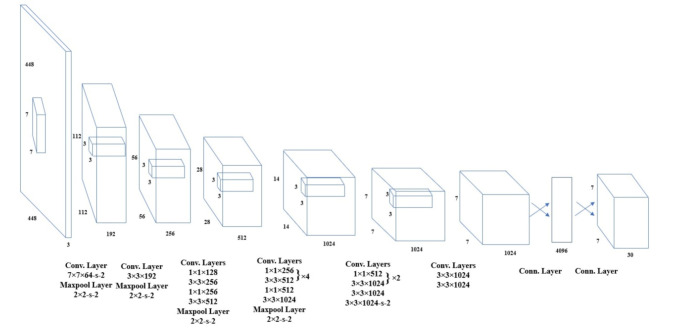
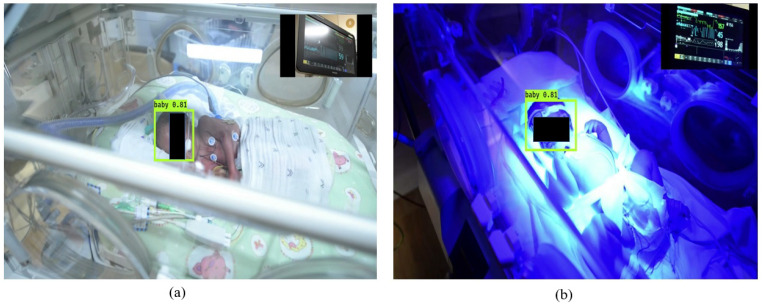
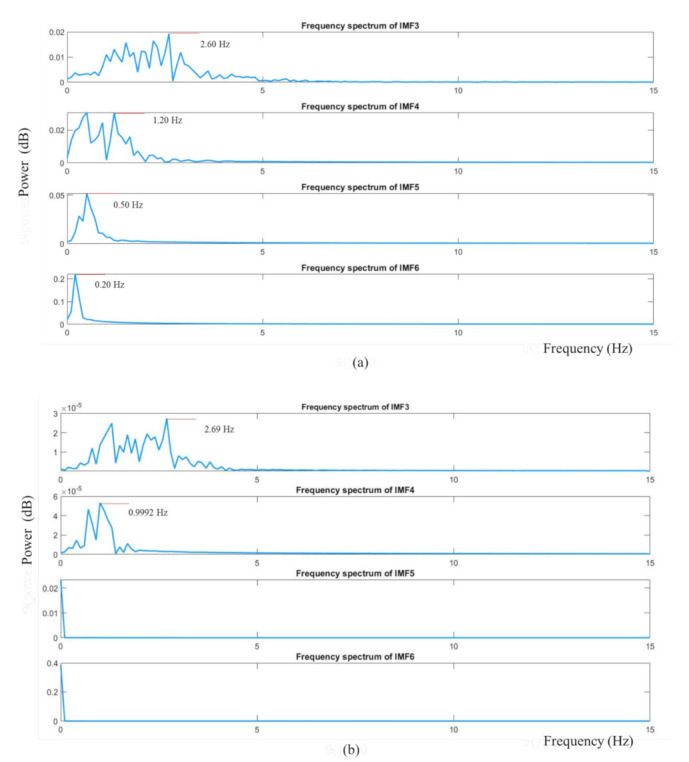
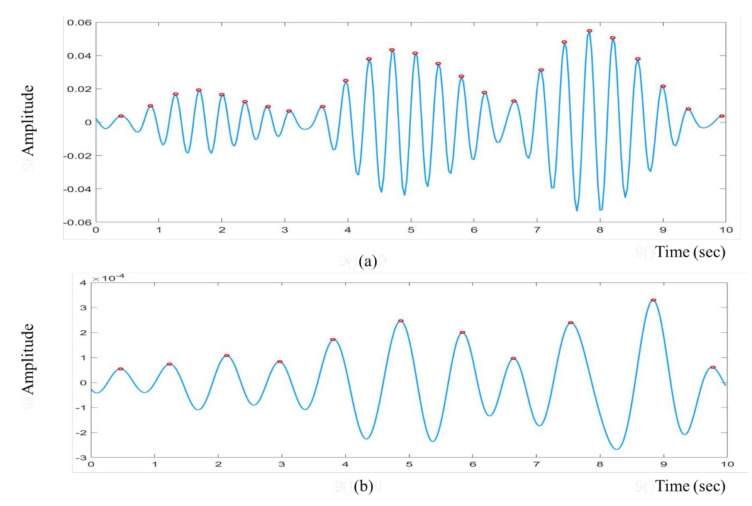
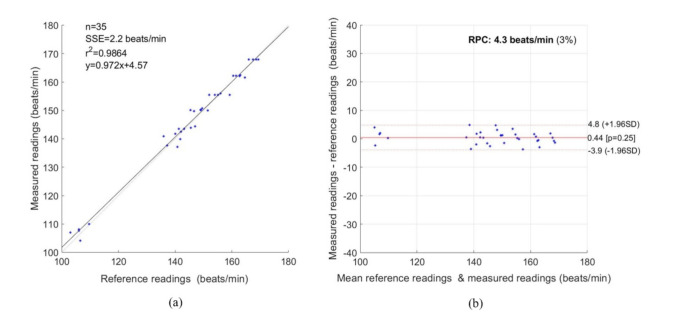
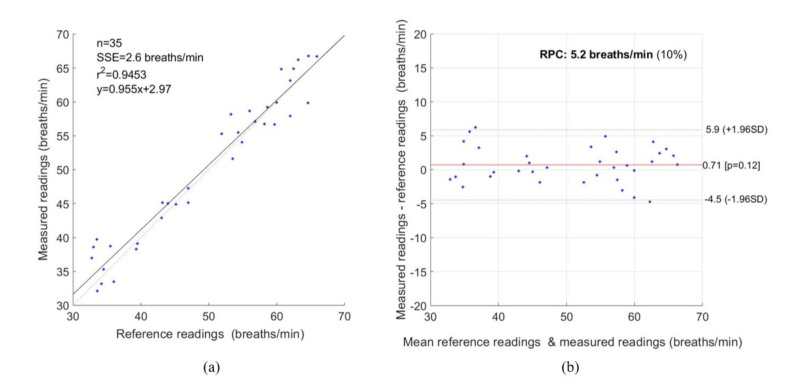
Infants with fragile skin are patients who would benefit from non-contact vital sign monitoring due to the avoidance of potentially harmful adhesive electrodes and cables. Non-contact vital signs monitoring has been studied in clinical settings in recent decades. However, studies on infants in the Neonatal Intensive Care Unit (NICU) are still limited. Therefore, we conducted a single-center study to remotely monitor the heart rate (HR) and respiratory rate (RR) of seven infants in NICU using a digital camera. The region of interest (ROI) was automatically selected using a convolutional neural network and signal decomposition was used to minimize the noise artefacts. The experimental results have been validated with the reference data obtained from an ECG monitor. They showed a strong correlation using the Pearson correlation coefficients (PCC) of 0.9864 and 0.9453 for HR and RR, respectively, and a lower error rate with RMSE 2.23 beats/min and 2.69 breaths/min between measured data and reference data. A Bland-Altman analysis of the data also presented a close correlation between measured data and reference data for both HR and RR. Therefore, this technique may be applicable in clinical environments as an economical, non-contact, and easily deployable monitoring system, and it also represents a potential application in home health monitoring.
Keywords: NICU; convolutional neural network; heart rate; respiratory rate; signal decomposition.
Conflict of interest statement
The authors declare no conflict of interest.
Figures
References
-
- WHO International Statistical Classification of Diseases and Related Health Problems. [(accessed on 1 March 2021)]; Available online: https://www.who.int/standards/classifications/classification-of-diseases.
-
- Blencowe H., Cousens S., Oestergaard M.Z., Chou D., Moller A.-B., Narwal R., Adler A., Garcia C.V., Rohde S., Say L. National, regional, and worldwide estimates of preterm birth rates in the year 2010 with time trends since 1990 for selected countries: A systematic analysis and implications. Lancet. 2012;379:2162–2172. doi: 10.1016/S0140-6736(12)60820-4. - DOI - PubMed
-
- Kenner C., Lott J.W. Comprehensive Neonatal Care: An Interdisciplinary Approach. Elsevier Health Sciences; London, UK: 2007.
-
- Behrman R.E., Butler A.S. Preterm Birth: Causes, Consequences, and Prevention. National Academies Press; Washington, DC, USA: 2007. Mortality and acute complications in preterm infants. - PubMed
-
- Khanam F.-T.-Z., Al-Naji A., Chahl J. Remote Monitoring of Vital Signs in Diverse Non-Clinical and Clinical Scenarios Using Computer Vision Systems: A Review. Appl. Sci. 2019;9:4474. doi: 10.3390/app9204474. - DOI
Grants and funding
LinkOut - more resources
Full Text Sources
Miscellaneous
