. 2021 Aug 30;17(8):e1009263.
doi: 10.1371/journal.pcbi.1009263. eCollection 2021 Aug.

A multi-objective genetic algorithm to find active modules in multiplex biological networks

Affiliations

A multi-objective genetic algorithm to find active modules in multiplex biological networks

Elva María Novoa-Del-Toro et al. PLoS Comput Biol. .

Abstract

The identification of subnetworks of interest-or active modules-by integrating biological networks with molecular profiles is a key resource to inform on the processes perturbed in different cellular conditions. We here propose MOGAMUN, a Multi-Objective Genetic Algorithm to identify active modules in MUltiplex biological Networks. MOGAMUN optimizes both the density of interactions and the scores of the nodes (e.g., their differential expression). We compare MOGAMUN with state-of-the-art methods, representative of different algorithms dedicated to the identification of active modules in single networks. MOGAMUN identifies dense and high-scoring modules that are also easier to interpret. In addition, to our knowledge, MOGAMUN is the first method able to use multiplex networks. Multiplex networks are composed of different layers of physical and functional relationships between genes and proteins. Each layer is associated to its own meaning, topology, and biases; the multiplex framework allows exploiting this diversity of biological networks. We applied MOGAMUN to identify cellular processes perturbed in Facio-Scapulo-Humeral muscular Dystrophy, by integrating RNA-seq expression data with a multiplex biological network. We identified different active modules of interest, thereby providing new angles for investigating the pathomechanisms of this disease. Availability: MOGAMUN is available at https://github.com/elvanov/MOGAMUN and as a Bioconductor package at https://bioconductor.org/packages/release/bioc/html/MOGAMUN.html. Contact: anais.baudot@univ-amu.fr.


Conflict of interest statement

The authors have declared that no competing interests exist.

Figures
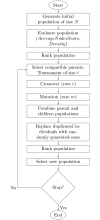
Fig 1
Fig 1. General flowchart of MOGAMUN.
Fig 2
Fig 2. F1-scores obtained by jActiveModules, COSINE, PinnacleZ, and MOGAMUN in the two benchmark experiments.
Experiment 1 corresponds to PPI_1 network and Sim_normal dataset; Experiment 2 corresponds to PPI_2 and Samp_TCGA dataset.
Fig 3
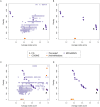
Fig 3. Density and average node score of the subnetworks identified by MOGAMUN, COSINE, PinnacleZ and jActiveModules.
(A) Results of 30 runs using the PPI_1 network and the Sim_normal dataset. (B) Filtered results from (A), keeping only the subnetworks with at least 15 nodes. (C) Results of 30 runs using the PPI_2 network and the Samp_TCGA dataset. (D) Filtered results from (C), keeping only the subnetworks with at least 15 nodes. The size distributions of all the modules can be retrieved in Supplementary Figs S1-S8 in S1 File.
Fig 4
Fig 4. Four active modules obtained by applying MOGAMUN on different FSHD1 expression datasets.
The color of the nodes represents the fold-change, where green and red nodes correspond to under- and over-expressed genes, respectively. Nodes with bold black border correspond to genes significantly differentially expressed (FDR <0.05 and absolute log2 fold-change >1). Blue nodes correspond to genes with no associated transcriptomics data. The color of the edges represents the layer of the multiplex network, where blue, orange, and yellow correspond to PPI, Pathways, and Co-expression, respectively. The active modules are extracted from the sets of active modules obtained from (A) Yao’s dataset, myotubes [34], (B) Yao’s dataset, biopsies [34], (C) Banerji’s 2017 dataset [35], and (D) Banerji’s 2019 dataset [36].

References

    1. Reimand J, Isserlin R, Voisin V, Kucera M, Tannus-Lopes C, Wadi L, et al.. Pathway enrichment analysis and visualization of omics data using g:Profiler, GSEA, Cytoscape and EnrichmentMap. Nat Protoc. 2019; 14: 482–517. doi: 10.1038/s41596-018-0103-9 - DOI - PMC - PubMed
    1. Mitra K, Carvunis AR, Ramesh SK, Ideker T. Integrative approaches for finding modular structure in biological networks. Nat Rev Genet. 2013; 14: 719–732. doi: 10.1038/nrg3552 - DOI - PMC - PubMed
    1. Ideker T, Ozier O, Schwikowski B, Siegel AF. Discovering regulatory and signalling circuits in molecular interaction networks. Bioinformatics. 2002; 18: S233–S240. doi: 10.1093/bioinformatics/18.suppl_1.S233 - DOI - PubMed
    1. Li D, Pan Z, Hu G, Zhu Z, He S. Active module identification in intracellular networks using a memetic algorithm with a new binary decoding scheme. BMC Genomics. 2017; 18: 1–9. - PMC - PubMed
    1. Chen W, Liu J, He S. Prior knowledge guided active modules identification: an integrated multi-objective approach. BMC Syst Biol. 2017; 11: 1–12. doi: 10.1186/s12918-017-0388-2 - DOI - PMC - PubMed

Publication types