. 2021 Aug 30;22(1):416.
doi: 10.1186/s12859-021-04338-7.

Conifer: clonal tree inference for tumor heterogeneity with single-cell and bulk sequencing data

Affiliations

Conifer: clonal tree inference for tumor heterogeneity with single-cell and bulk sequencing data

Leila Baghaarabani et al. BMC Bioinformatics. .

Abstract

Background: Genetic heterogeneity of a cancer tumor that develops during clonal evolution is one of the reasons for cancer treatment failure, by increasing the chance of drug resistance. Clones are cell populations with different genotypes, resulting from differences in somatic mutations that occur and accumulate during cancer development. An appropriate approach for identifying clones is determining the variant allele frequency of mutations that occurred in the tumor. Although bulk sequencing data can be used to provide that information, the frequencies are not informative enough for identifying different clones with the same prevalence and their evolutionary relationships. On the other hand, single-cell sequencing data provides valuable information about branching events in the evolution of a cancerous tumor. However, the temporal order of mutations may be determined with ambiguities using only single-cell data, while variant allele frequencies from bulk sequencing data can provide beneficial information for inferring the temporal order of mutations with fewer ambiguities.

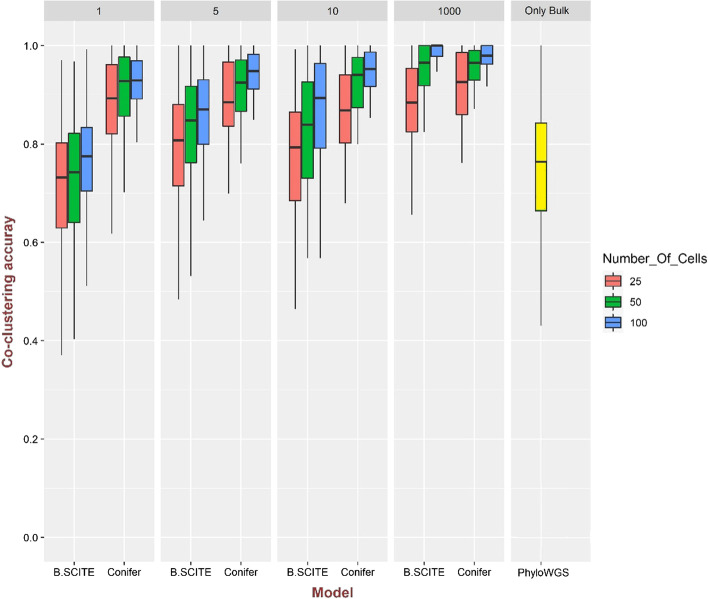
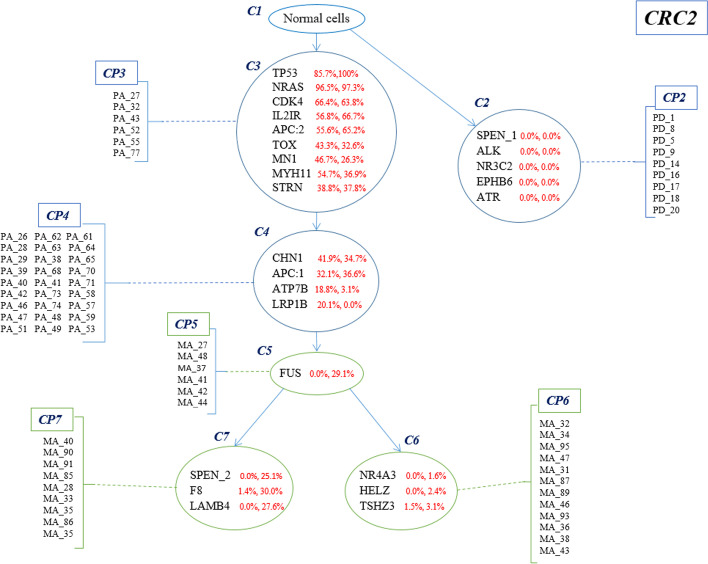
Result: In this study, a new method called Conifer (ClONal tree Inference For hEterogeneity of tumoR) is proposed which combines aggregated variant allele frequency from bulk sequencing data with branching event information from single-cell sequencing data to more accurately identify clones and their evolutionary relationships. It is proven that the accuracy of clone identification and clonal tree inference is increased by using Conifer compared to other existing methods on various sets of simulated data. In addition, it is discussed that the evolutionary tree provided by Conifer on real cancer data sets is highly consistent with information in both bulk and single-cell data.

Conclusions: In this study, we have provided an accurate and robust method to identify clones of tumor heterogeneity and their evolutionary history by combining single-cell and bulk sequencing data.

Keywords: Bayesian nonparametric model; Bulk sequencing; Clonal tree; Heterogeneity of tumor; Single-cell sequencing.


Conflict of interest statement

The authors declare that they have no competing interests.

Figures

Fig. 1
Fig. 1
Schematic representation of combining single-cell and bulk sequencing data for clonal tree inference in Conifer method, a n×m matrix in which each row and column represents SNVs and cell, respectively. White elements show no mutation and blue ones show mutation has occurred. 1 and 0 with the red font show false-positive and false-negative (drop-out events), respectively, b n×b matrix that its rows are SNVs and its columns are bulk samples and Bij is variant allele frequency in bulk samples, c co-occurred patterns of SNVs in single-cell profiles which are determined by dashed rectangles, d the inferred clonal tree and cell attachment
Fig. 2
Fig. 2
Comparison of co-clustering accuracy in B-SCITE, Conifer, and PhyloWGS models for 100 clonal trees simulated with 10 clones and 50 mutations and for λ = 1, 5, 10 and 1000. For single-cell data 25, 50, and 100 genotypes are extracted for each clonal tree. There are two bulk sequencing samples with a coverage of 10,000. The following errors are added to the single-cell data: the false-positive rate of 10–5, the false-negative rate of 0.2, the missing rate of 0.05, and the doublet rate of 0.1
Fig. 3
Fig. 3
Comparison of co-clustering accuracy in B-SCITE, Conifer, and PhyloWGS models for 100 clonal trees simulated with 10 clones and 50 mutations. For λ = 1, 5, 10 and 1000. For single-cell data 25, 50, and 100 genotypes are extracted for each clonal tree. The number of bulk sequencing samples is 2 with a coverage of 10,000. The following errors are added to the single-cell data: the false-positive rate of 10–5, the false-negative rate of 0.2, the missing rate of 0.05, and the doublet rate of 0.1
Fig. 4
Fig. 4
Comparison of co-clustering accuracy in OncoNEM and Conifer models for 100 clonal trees simulated with 20 clones and 100 mutations and for λ = 1, 5, 10 and 1000. For single-cell data 25, 50, and 100 genotypes are extracted for each clonal tree. There is one bulk sequencing sample with a coverage of 10,000. The following errors are added to the single-cell data: the false-positive rate of 10–5, the false-negative rate of 0.2, the missing rate of 0.05, and the doublet rate of 0.1
Fig. 5
Fig. 5
Clonal evolution tree inferred by Conifer for CRC2 patient tumor data. For each SNV, two numbers are reported: VAFs in colorectal tumor bulk sample and metastasis liver bulk sample
Fig. 6
Fig. 6
Clonal tree inference for a patient with triple-negative breast cancer, a Clonal tree Inferred in the original study [33] based on single-cell exome and copy number data, b Clonal tree Inferred by PhISCS based on single-cell data, c Clonal tree inferred by Conifer based on bulk and single-cell data
Fig. 7
Fig. 7
A schematic example showing sampling steps of tree inference by Conifer, a the variables w1,w2,w3 and w4 are defined for cells 1 to 4 which are sets of SNVs with the value of one in corresponding cells. Matrices A and B show the single-cell data and VAFs of SNVs in different bulk samples, respectively, b the generated path c1 corresponding to w1 with node labels of ϑ0,ϑ1,ϑ2,ϑ3, c the generated path c2 corresponding to w2 with node labels of ϑ0,ϑ1,ϑ4,ϑ5, d the generated paths c3 and c4 corresponding to w3 and w4 with node labels of ϑ0,ϑ6,ϑ7 and ϑ0,ϑ8,ϑ9, respectively, e initial tree with random mutation assignment for each wd to nodes of their corresponding paths, f result of sampling level for path c1, g result of sampling level for path c2, h result of sampling level for last two paths c3 and c4, i final tree after successive iterations of sampling path and sampling level
Fig. 8
Fig. 8
a A schematic example showing a clonal tree, b calculation of co-occurrence frequency of mutations tc1 for path c1 in the clonal tree, c calculation of connectivity matrix Vc1 for path c1 in the clonal tree

References

    1. Nowell PC. The clonal evolution of tumor cell populations. Science. 1976;194(4260):23–28. - PubMed
    1. Marte B. Tumour heterogeneity. Berlin: Nature Publishing Group; 2013. - PubMed
    1. Marusyk A, Almendro V, Polyak K. Intra-tumour heterogeneity: a looking glass for cancer? Nat Rev Cancer. 2012;12(5):323–334. - PubMed
    1. Merlo LM, Pepper JW, Reid BJ, Maley CC. Cancer as an evolutionary and ecological process. Nat Rev Cancer. 2006;6(12):924–935. - PubMed
    1. Burrell RA, Swanton C. Tumour heterogeneity and the evolution of polyclonal drug resistance. Mol Oncol. 2014;8(6):1095–1111. - PMC - PubMed

LinkOut - more resources