

The association between mechanical ventilator compatible bed occupancy and mortality risk in intensive care patients with COVID-19: a national retrospective cohort study
- PMID: 34461893
- PMCID: PMC8404408
- DOI: 10.1186/s12916-021-02096-0
The association between mechanical ventilator compatible bed occupancy and mortality risk in intensive care patients with COVID-19: a national retrospective cohort study
Abstract
Background: The literature paints a complex picture of the association between mortality risk and ICU strain. In this study, we sought to determine if there is an association between mortality risk in intensive care units (ICU) and occupancy of beds compatible with mechanical ventilation, as a proxy for strain.
Methods: A national retrospective observational cohort study of 89 English hospital trusts (i.e. groups of hospitals functioning as single operational units). Seven thousand one hundred thirty-three adults admitted to an ICU in England between 2 April and 1 December, 2020 (inclusive), with presumed or confirmed COVID-19, for whom data was submitted to the national surveillance programme and met study inclusion criteria. A Bayesian hierarchical approach was used to model the association between hospital trust level (mechanical ventilation compatible), bed occupancy, and in-hospital all-cause mortality. Results were adjusted for unit characteristics (pre-pandemic size), individual patient-level demographic characteristics (age, sex, ethnicity, deprivation index, time-to-ICU admission), and recorded chronic comorbidities (obesity, diabetes, respiratory disease, liver disease, heart disease, hypertension, immunosuppression, neurological disease, renal disease).
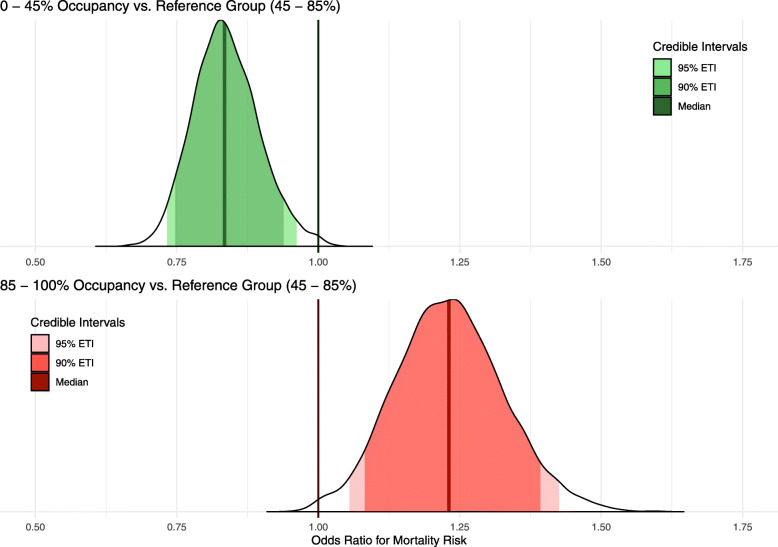
Results: One hundred thirty-five thousand six hundred patient days were observed, with a mortality rate of 19.4 per 1000 patient days. Adjusting for patient-level factors, mortality was higher for admissions during periods of high occupancy (> 85% occupancy versus the baseline of 45 to 85%) [OR 1.23 (95% posterior credible interval (PCI): 1.08 to 1.39)]. In contrast, mortality was decreased for admissions during periods of low occupancy (< 45% relative to the baseline) [OR 0.83 (95% PCI 0.75 to 0.94)].
Conclusion: Increasing occupancy of beds compatible with mechanical ventilation, a proxy for operational strain, is associated with a higher mortality risk for individuals admitted to ICU. Further research is required to establish if this is a causal relationship or whether it reflects strain on other operational factors such as staff. If causal, the result highlights the importance of strategies to keep ICU occupancy low to mitigate the impact of this type of resource saturation.
Keywords: Coronavirus infection; Critical care; Hospital mortality; Public health surveillance; Quality of healthcare.
© 2021. The Author(s).
Conflict of interest statement
SJV declares funding from IQVIA and Microsoft. BAM is an employee of the Wellcome Trust and holds a Wellcome funded honorary post at University College London for the purposes of carrying out independent research; the views expressed in this manuscript do not necessarily reflect the views or position of the Wellcome Trust. All other authors declare no competing interests.
Figures
References
-
- World Health Organisation. COVID-19 Weekly Epidemiological Update - 29 December 2020; 2020. https://www.who.int/publications/m/item/weekly-epidemiological-update%2D.... Accessed 1 Jan 2021.
-
- Ferguson N, Laydon D, Nedjati Gilani G, et al. Report 9: Impact of non-pharmaceutical interventions (NPIs) to reduce COVID19 mortality and healthcare demand. https://www.imperial.ac.uk/media/imperial-college/medicine/mrc-gida/2020... . Accessed 1 Jan 2021.
-
- Docherty AB, Harrison EM, Green CA, Hardwick HE, Pius R, Norman L, Holden KA, Read JM, Dondelinger F, Carson G, Merson L. Features of 20 133 UK patients in hospital with covid-19 using the ISARIC WHO Clinical Characterisation Protocol: prospective observational cohort study. BMJ. 2020;22:369. - PMC - PubMed
-
- Mateen BA, Wilde H, Dennis JM, Duncan A, Thomas N, McGovern A, Denaxas S, Keeling M, Vollmer S. Hospital bed capacity and usage across secondary healthcare providers in England during the first wave of the COVID-19 pandemic: a descriptive analysis. BMJ Open. 2021;11(1):e042945. doi: 10.1136/bmjopen-2020-042945. - DOI - PMC - PubMed
Publication types
MeSH terms
Grants and funding
LinkOut - more resources
Full Text Sources
Medical
Miscellaneous
