. 2021 Aug 30;19(1):374.
doi: 10.1186/s12967-021-03056-1.

UBE2T promotes autophagy via the p53/AMPK/mTOR signaling pathway in lung adenocarcinoma

Affiliations

UBE2T promotes autophagy via the p53/AMPK/mTOR signaling pathway in lung adenocarcinoma

Jinhong Zhu et al. J Transl Med. .

Abstract

Background: Ubiquitin-conjugating enzyme E2T (UBE2T) acts as an oncogene in various types of cancer. However, the mechanisms behind its oncogenic role remain unclear in lung cancer. This study aims to explore the function and clinical relevance of UBE2T in lung cancer.

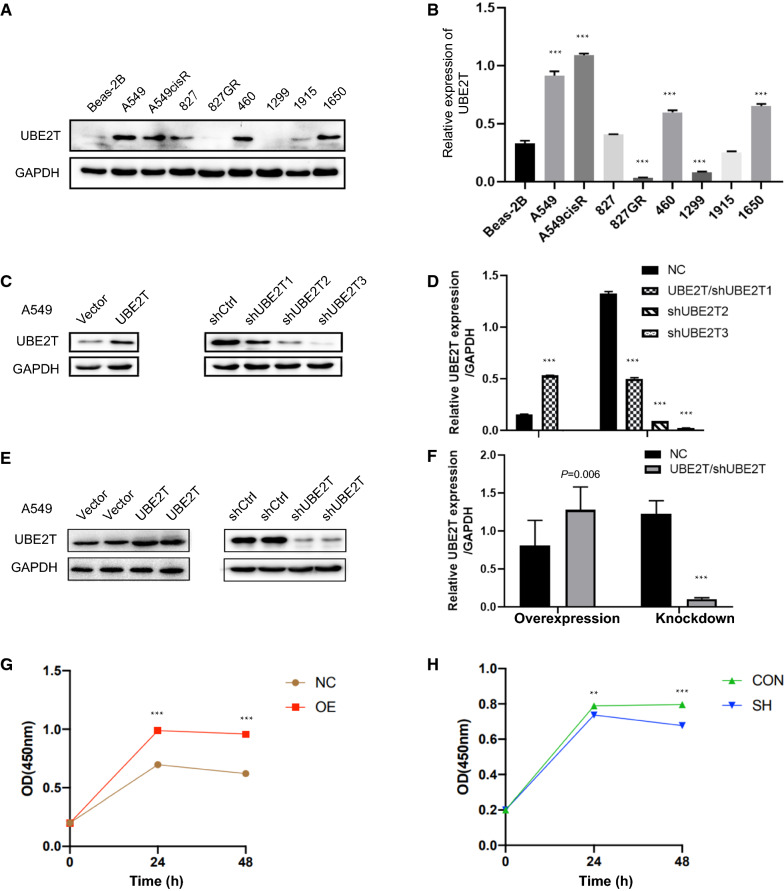
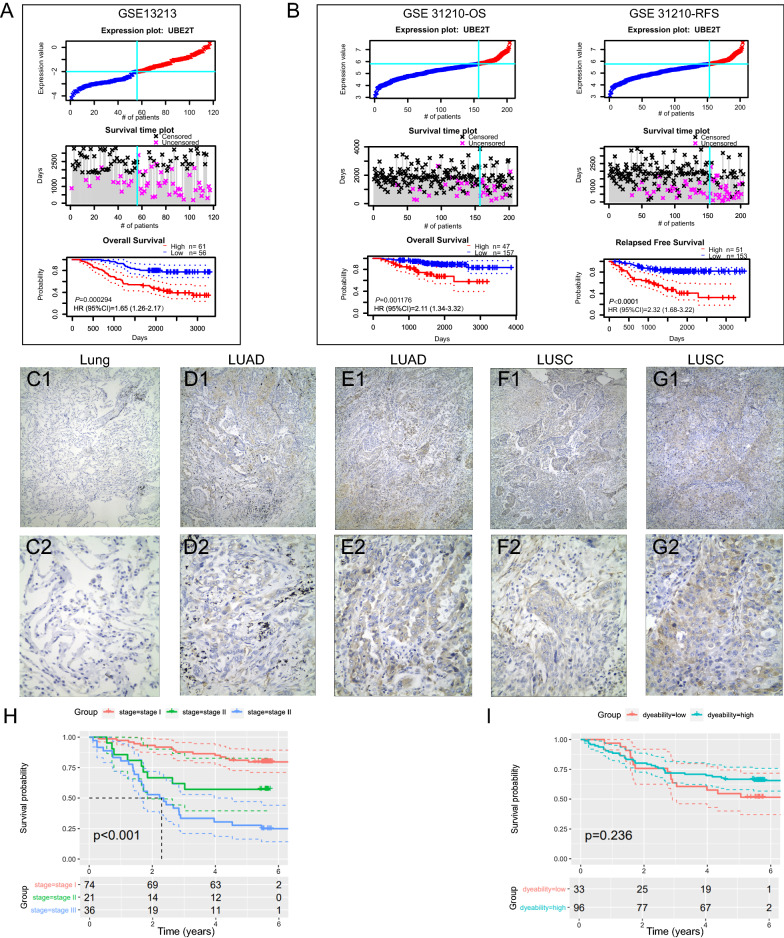
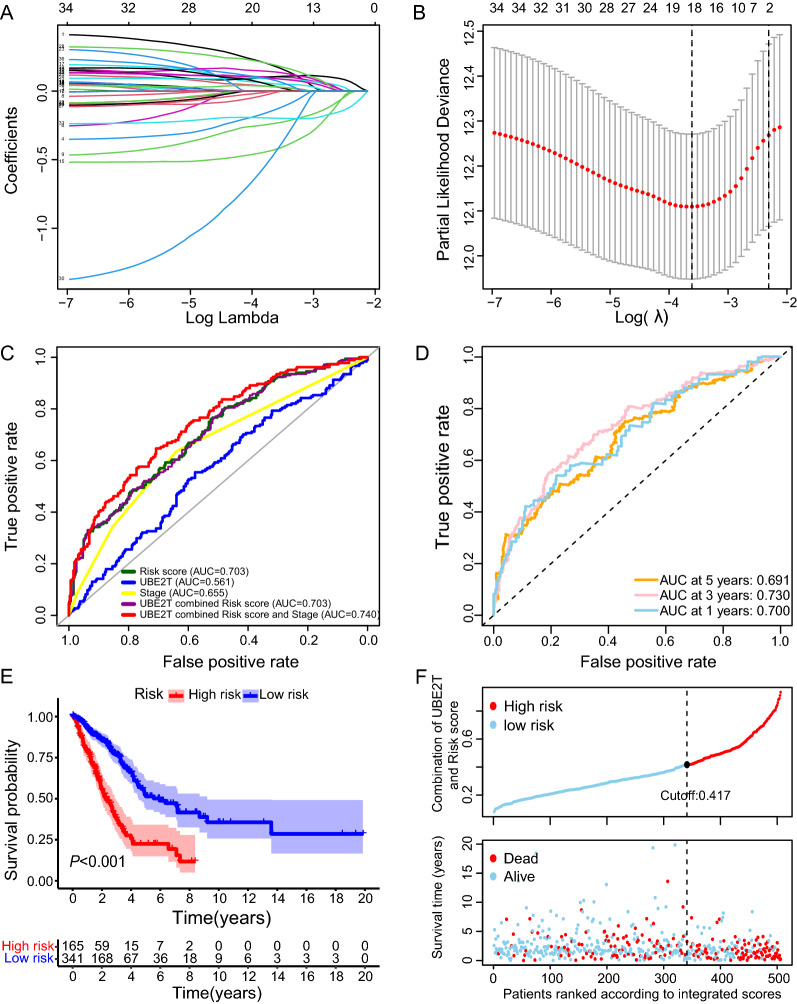
Methods: Lentiviral vectors were used to mediate UBE2T depletion or overexpress UBE2T in lung cancer cells. CCK8 analysis and western blotting were performed to investigate the effects of UBE2T on proliferation, autophagy, and relevant signaling pathways. To exploit the clinical significance of UBE2T, we performed immunohistochemistry staining with an anti-UBE2T antibody on 131 NSCLC samples. Moreover, we downloaded the human lung adenocarcinoma (LUAD) dataset from The Cancer Atlas Project (TCGA). Lasso Cox regression model was adopted to establish a prognostic model with UBE2T-correlated autophagy genes.

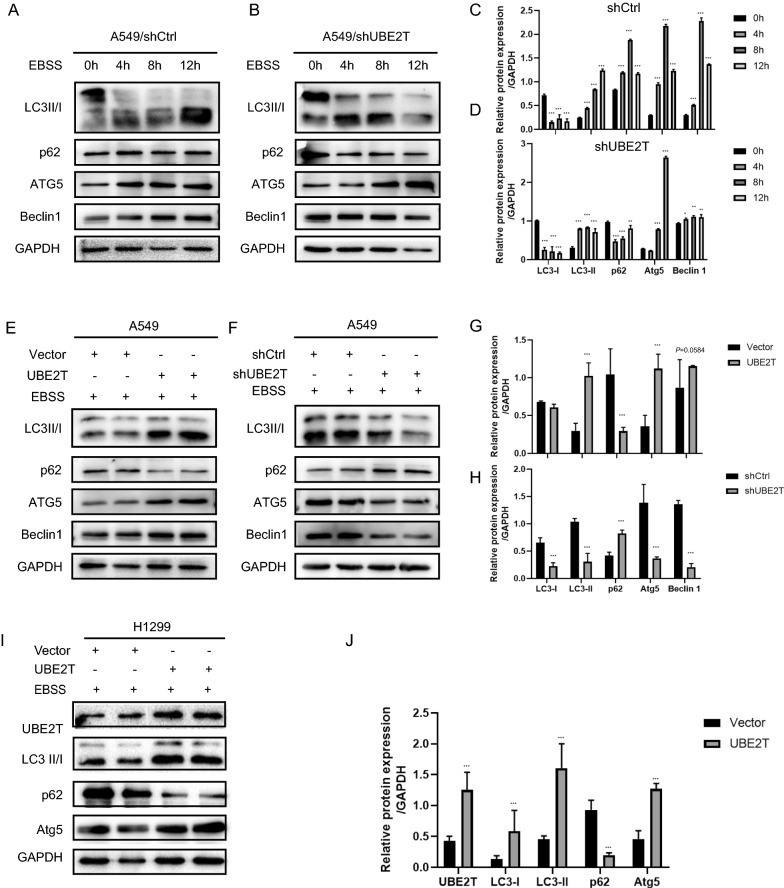
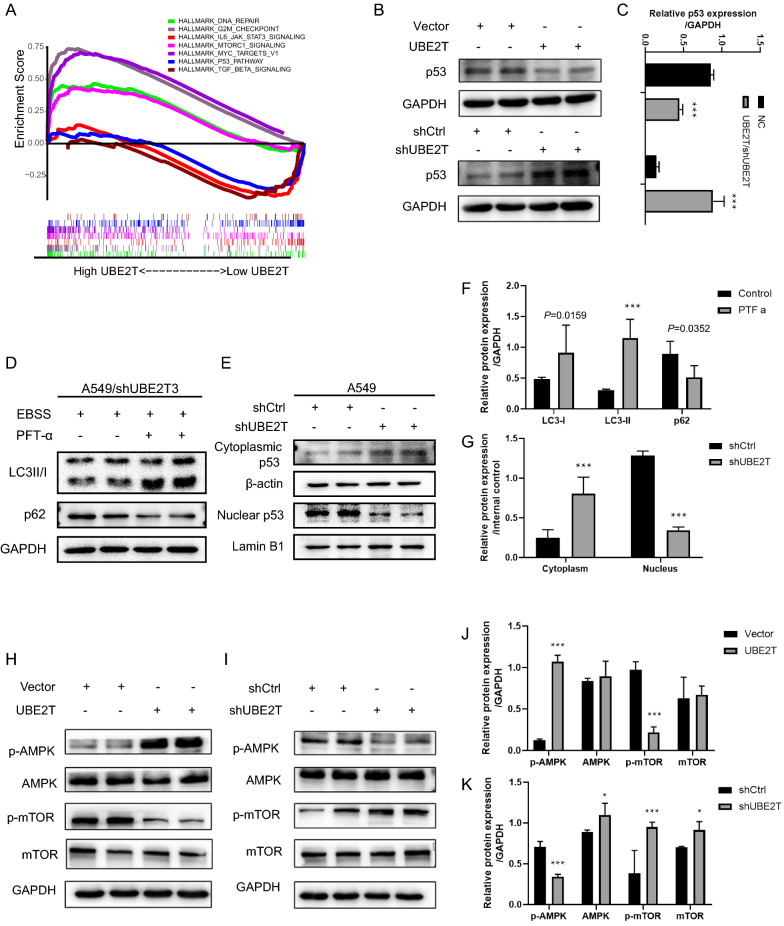
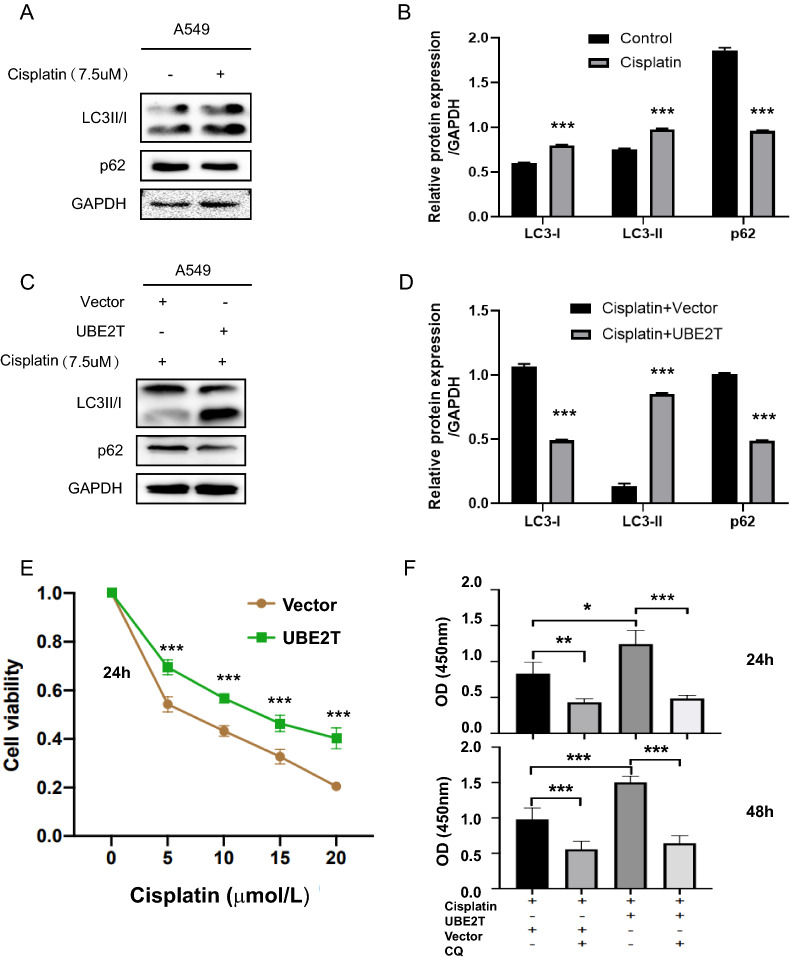
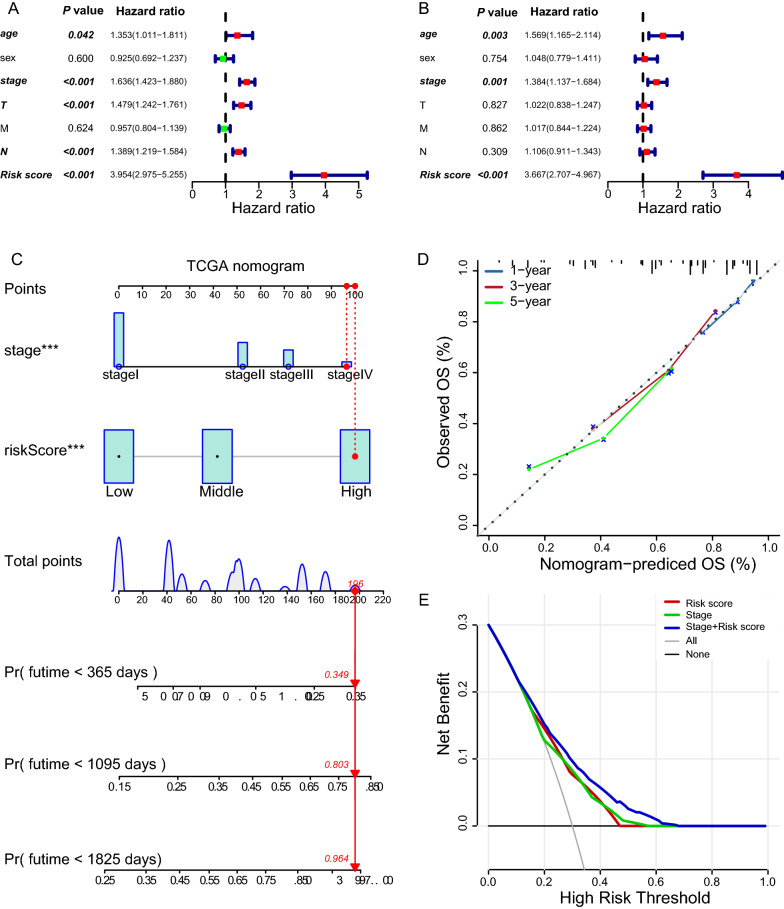
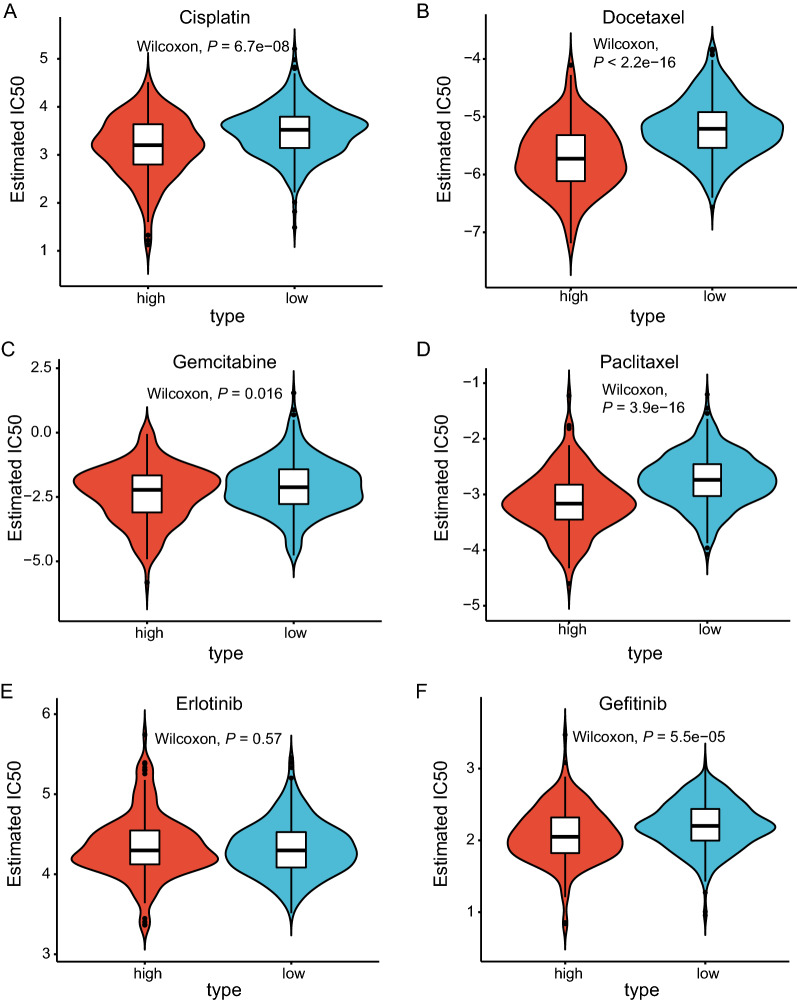
Results: We found that UBE2T stimulated proliferation and autophagy, and silencing this gene abolished autophagy in lung cancer cells. As suggested by Gene set enrichment analysis, we observed that UBE2T downregulated p53 levels in A549 cells and vice versa. Blockade of p53 counteracted the inhibitory effects of UBE2T depletion on autophagy. Meanwhile, the AMPK/mTOR signaling pathway was activated during UBE2T-mediated autophagy, suggesting that UBE2T promotes autophagy via the p53/AMPK/mTOR pathway. Interestingly, UBE2T overexpression increased cisplatin-trigged autophagy and led to cisplatin resistance of A549 cells, whereas inhibiting autophagy reversed drug resistance. However, no association was observed between UEB2T and overall survival in a population of 131 resectable NSCLC patients. Therefore, we developed and validated a multiple gene signature by considering UBE2T and its relevance in autophagy in lung cancer. The risk score derived from the prognostic signature significantly stratified LUAD patients into low- and high-risk groups with different overall survival. The risk score might independently predict prognosis. Interestingly, nomogram and decision curve analysis demonstrated that the signature's prognostic accuracy culminated while combined with clinical features. Finally, the risk score showed great potential in predicting clinical chemosensitivity.

Conclusions: We found that UBE2T upregulates autophagy in NSCLC cells by activating the p53/AMPK/mTOR signaling pathway. The clinical predicting ability of UBE2T in LUAD can be improved by considering the autophagy-regulatory role of UBE2T.

Keywords: Autophagy; Lung cancer; Prognostic signature; UBE2T; p53.


Conflict of interest statement

There was no competing interest to disclose.

Figures

Fig. 1
Fig. 1
Elevated expression of UBE2T in most lung cancer cells. Western blot was used to detect UBE2T. A, B Comparison of UBE2T expression in normal lung bronchial epithelial and lung cancer cells. C, D UBE2T was overexpressed in A549 cells infected with a lentiviral vector carrying UBE2T cDNA. Differential gene silencing efficiency in A549 cells by three lentivirus-mediated short-hairpin RNAs designed against UBE2T (shUBE2T). E, F Establishment and validation of stable A549 cells with knockdown of UBE2T or overexpressing UBE2T. Western blot was conducted at least three times to validate the stable cells. GAPDH was used as internal controls. G UBE2T overexpression promoted the proliferation of A549 cells. H Silencing of UBE2T showed inhibitory effects on cell proliferation. All experiments were repeated at least three times. Protein bands were quantified using Image J. *P < 0.05, **P < 0.01, ***P < 0.001
Fig. 2
Fig. 2
UBE2T upregulates autophagy in NSCLC cells. AD Detection of autophagy in the labeled cells under starvation at different time points. Cells were starved in EBSS for 8 h to induce autophagy prior to analysis. Cell lysis was collected, and western blot was used to detect markers of autophagy. E, G Overexpression of UBE2T stimulated autophagy. FH Silencing of UBE2T inhibited autophagy. I, J UBE2T overexpression increased autophagy in H1299 cells. GAPDH was used as internal controls. All experiments were repeated at least three times. Protein bands were quantified using Image J. *P < 0.05, **P < 0.01, ***P < 0.001
Fig. 3
Fig. 3
knockdown of UBE2T reduced autophagy by upregulating the expression of p53 and affecting its nuclear-cytoplasmic localization. A GSEA revealed the signaling pathways associated with UBE2T in NSCLC. B, C p53 expression levels were detected in UBE2T-deficient cells, UBE2T-overexpression cells, and the corresponding control cells via western blot analysis. D, F A549 cells infected with lentivirus-mediated shUBE2T were incubated in EBSS supplemented with or without pifithrin-a (PFT-a, 20 mM) for 8 h. After that, immunoblot analysis was performed with antibodies against LC3 and p62, separately. E, G The levels of nuclear p53 and cytoplasmic p53 in control cells and UBE2T deficient cells were examined after the separation of protein fractions using a cytoplasmic and nuclear extraction kit following the instruction. The effects of UBE2T on the AMPK/mTOR pathway were investigated. Cell lysis was subjected to western blot analysis with antibodies against p-AMPK, AMPK, p-mTOR, mTOR, and GAPDH. H, J UBE2T overexpression activated the AMPK/mTOR signaling pathway. I, K Silencing UBE2T inhibited the AMPK/mTOR signaling pathway. GAPDH was used as internal controls. All experiments were repeated at least three times. Protein bands were quantified using Image J. *P < 0.05, **P < 0.01, ***P < 0.001
Fig. 4
Fig. 4
UBE2T augment cisplatin-induced autophagy. A Western blotting analysis was used to examine the effects of cisplatin treatments on autophagy in the A549 cells, followed by quantification using Image J (B). C Cisplatin-induced autophagy was further enhanced in the UBE2T overexpressing A549 cells, followed by quantification using Image J D. GAPDH was used as internal controls. E UBE2T overexpression decreased the sensitivity of A549 cells to cisplatin. F Autophagy inhibitor increased A549 cell’s sensitivity to cisplatin. All experiments were repeated at least three times. *P < 0.05, **P < 0.01, ***P < 0.001
Fig. 5
Fig. 5
Prognostic value of UBE2T in NSCLC. A Kaplan–Meier survival curves presenting overall survival (OS) times for groups divided by the optimal cutoff value of UBE2T transcripts in GSE13213 (n = 117). B Recurrence-free survival (RFS) and OS for patients with UBE2Thigh and UBE2Tlow tumor in GSE31210 (n = 205). Immunohistochemical staining of UBE2T in NSCLC tissues (CG). UBE2T staining in normal lung tissues (C1 100×, C2 400×); Low (D1 100×, D2 400×) and high (E1 100×, E2 400×) expression of UBE2T in LUAD; Low (F1 100×, F2 400×) and high (G1 100×, G2 400×) expression of UBE2T in LUSC. H Kaplan–Meier survival plots for TNM stages. I Kaplan–Meier survival plots for immunostaining scores of UBE2T
Fig. 6
Fig. 6
The prognostic accuracy of the risk estimation model derived from UBE2T-related autophagy genes in the TCGA-LUAD cohort. To improve the prognostic accuracy of UBE2T, the LASSO regression model was used to establish the best risk signature from the UBE2T-correlated autophagy genes in the TCGA-LUAD cohort. A Lasso coefficients of UBE2T-related autophagy genes. B Determination of the optimal gene signature in the LASSO model. C 5-year ROC curves for indicated variables. The risk score has the highest AUC value of all individual risk factors. D Time-dependent ROC curves for the risk score. The cutoff value of the risk scores was evaluated by plotting ROC curves. E LUAD patients were divided into low- and high-risk groups by the cutoff value. The risk score is associated with patient OS. The Kaplan–Meier survival curves of OS time between low- and high-risk patients. F The distribution of the integrated score and survival status of the TCGA-LUAD patients
Fig. 7
Fig. 7
Discriminatory performance of the risk score, TNM stage, and in combination in the TCGA-LUAD cohort. A Forest plot of univariate Cox regression analyses. B Forest plot of multivariate Cox regression analyses. C The nomogram for predicting individual OS possibility. D The calibration plots for the prediction of 1-, 3- and 5-year survival. The x-axis and y-axis denote nomogram-predicted (solid line) and actual survival, respectively, with the vertical bars representing a 95% confidence interval. E Decision curve analysis of indicated variables across probability thresholds. The combined model of the risk score and TNM stage has the highest net benefit at any given threshold
Fig. 8
Fig. 8
Prediction of chemosensitivity in the TCGA-LUAD cohort using the prognostic signature. Comparison of IC50 of common chemotherapeutic drugs between high- and high-risk groups, including cisplatin (A), docetaxel (B), gemcitabine (C), paclitaxel (D), erlotinib (E), and gefitinib (F)

References

    1. Bray F, Ferlay J, Soerjomataram I, Siegel RL, Torre LA, Jemal A. Global cancer statistics 2018: GLOBOCAN estimates of incidence and mortality worldwide for 36 cancers in 185 countries. CA Cancer J Clin. 2018;68:394–424. doi: 10.3322/caac.21492. - DOI - PubMed
    1. Chen W, Zheng R, Baade PD, Zhang S, Zeng H, Bray F, Jemal A, Yu XQ, He J. Cancer statistics in China, 2015. CA Cancer J Clin. 2016;66:115–132. doi: 10.3322/caac.21338. - DOI - PubMed
    1. Herbst RS, Morgensztern D, Boshoff C. The biology and management of non-small cell lung cancer. Nature. 2018;553:446–454. doi: 10.1038/nature25183. - DOI - PubMed
    1. Hiley CT, Le Quesne J, Santis G, Sharpe R, de Castro DG, Middleton G, Swanton C. Challenges in molecular testing in non-small-cell lung cancer patients with advanced disease. Lancet. 2016;388:1002–1011. doi: 10.1016/S0140-6736(16)31340-X. - DOI - PubMed
    1. Rotow J, Bivona TG. Understanding and targeting resistance mechanisms in NSCLC. Nat Rev Cancer. 2017;17:637–658. doi: 10.1038/nrc.2017.84. - DOI - PubMed

Publication types

MeSH terms