

Review
doi: 10.1186/s13054-021-03671-w.
Pathophysiology and clinical implications of the veno-arterial PCO2 gap
Affiliations
- PMID: 34461974
- PMCID: PMC8407023
- DOI: 10.1186/s13054-021-03671-w
Item in Clipboard
Review
Pathophysiology and clinical implications of the veno-arterial PCO2 gap
Crit Care.
.
Erratum in
-
Correction: Selected articles from the annual update in Intensive Care and Emergency Medicine 2021.Crit Care. 2024 Apr 5;28(1):110. doi: 10.1186/s13054-024-04857-8. Crit Care. 2024. PMID: 38581042 Free PMC article. No abstract available.
Abstract
This article is one of ten reviews selected from the Annual Update in Intensive Care and Emergency Medicine 2021. Other selected articles can be found online at https://www.biomedcentral.com/collections/annualupdate2021 . Further information about the Annual Update in Intensive Care and Emergency Medicine is available from https://link.springer.com/bookseries/8901 .
© 2021. Ltaief et al.
Conflict of interest statement
All authors stated they have no conflicts of interest to declare.
Figures
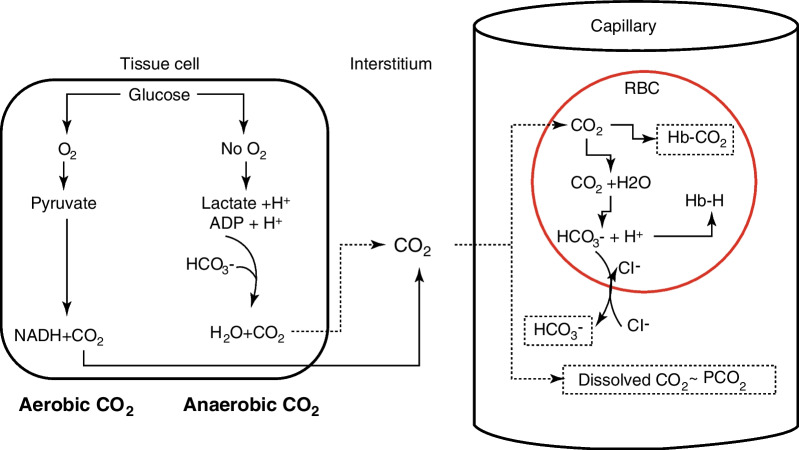
Physiology of CO2 production and transport. In cells, CO2 is produced (in mitochondria) as a byproduct of substrate oxidation. Under anaerobic conditions, CO2 is generated in small amounts, as the results of HCO3− buffering of protons released by lactic acid and the hydrolysis of ATP. CO2 diffuses into the interstitial tissues and then into capillaries, where it is transported as dissolved CO2 in plasma (in equilibrium with the PCO2), bound to hemoglobin as carbamino-hemoglobin (HbCO2) in red blood cells (RBC), and as HCO3−, following the reaction of CO2 with H2O within RBC, a reaction catalyzed by carbonic anhydrase to form HCO3− and H+. HCO3− exits the RBC in exchange with chloride anions (Cl−), whereas protons are buffered by hemoglobin, forming HbH
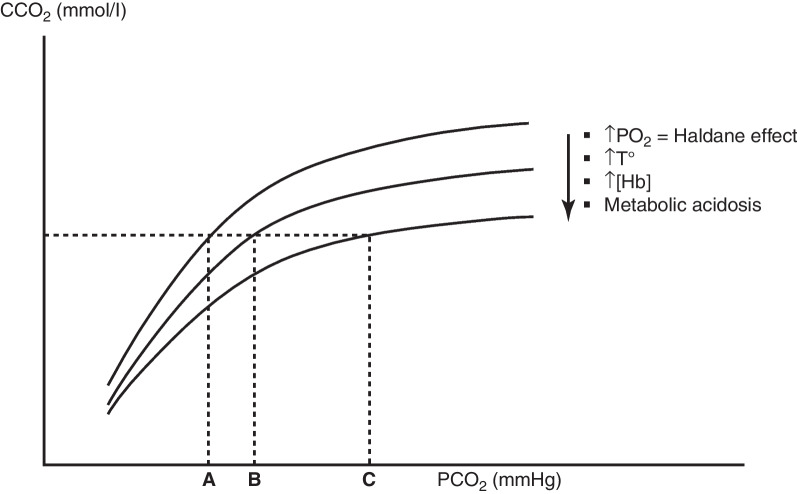
The CO2 dissociation curve. A curvilinear relationship exists between CO2 partial pressure (PCO2) and CO2 content (CCO2), so that PCO2 = k × CCO2. At low values of PCO2, the slope of the relationship is steeper, implying a smaller increase of PCO2 at any CCO2 than at high values of PCO2, where the slope of the relationship flattens. The position of the relationship is modified by various factors. A rightward and downward shift of the curve, corresponding to an increase of the k coefficient is produced by high PaO2 (Haldane effect), elevated temperatures, high hemoglobin concentrations and metabolic acidosis. A rightward shift of the curves implies that, for a same CCO2, the PCO2 increases, as indicated by the points A, B and C
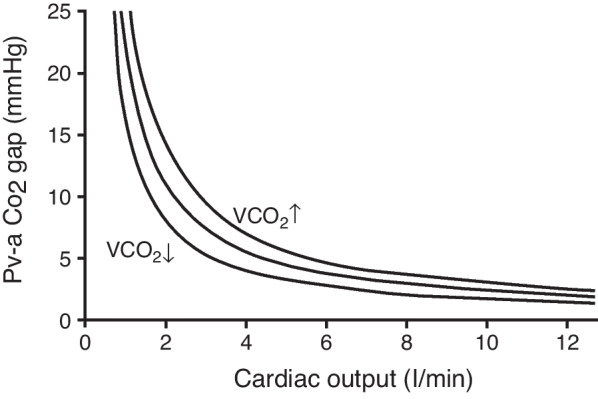
The inverse relationship between cardiac output and the Pva-CO2 gap. A reduction in cardiac output is associated with a progressive increase in the Pva-CO2 gap, which becomes exponential at very low cardiac output values, because of the flat slope of the CO2 dissociation curve in conditions of tissue hypercarbia. The relationship is displaced to the right at higher CO2 production (VCO2)
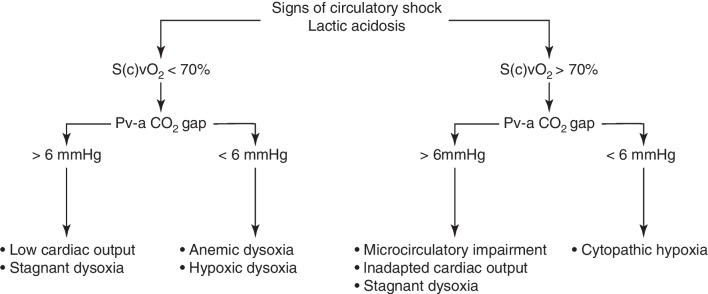
Usefulness of the Pva-CO2 gradient under conditions of circulatory shock. Proposed diagnostic algorithm integrating lactate, mixed (central) venous oxygen saturation (S(c)vO2) and the Pva-CO2 gap in patients with circulatory shock
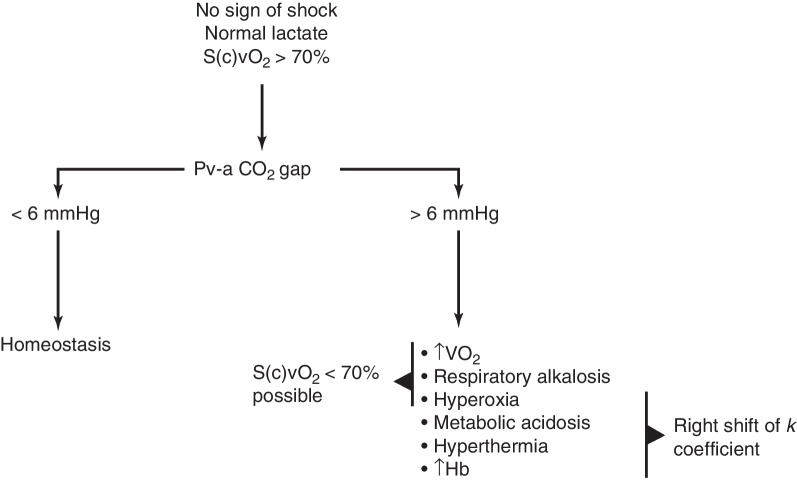
The Pva-CO2 gradient in the absence of circulatory shock. Proposed diagnostic algorithm to interpret an elevation in the Pva-CO2 gap in the absence of circulatory shock and with normal blood lactate. S(c)vO2 mixed (central) venous oxygen saturation
References
Publication types
MeSH terms
Substances
LinkOut - more resources
Full Text Sources
Miscellaneous
