. 2021 Nov 1;81(21):5451-5463.
doi: 10.1158/0008-5472.CAN-20-4191. Epub 2021 Aug 30.

SNAI2-Mediated Repression of BIM Protects Rhabdomyosarcoma from Ionizing Radiation

Affiliations

SNAI2-Mediated Repression of BIM Protects Rhabdomyosarcoma from Ionizing Radiation

Long Wang et al. Cancer Res. .

Abstract

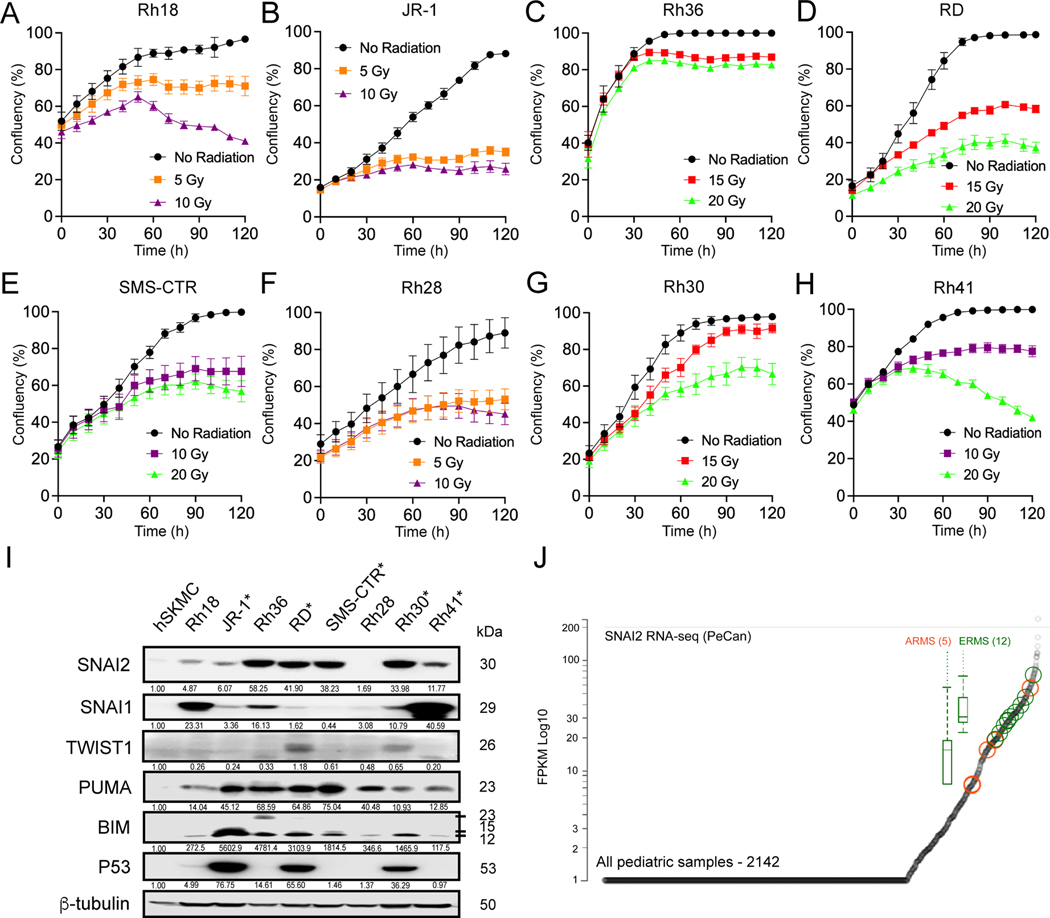
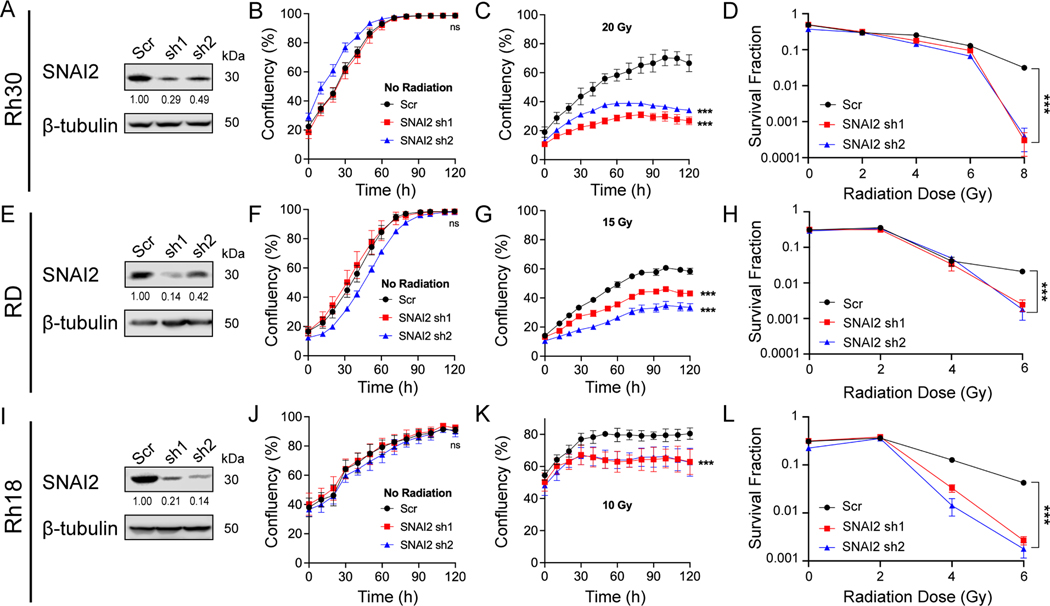
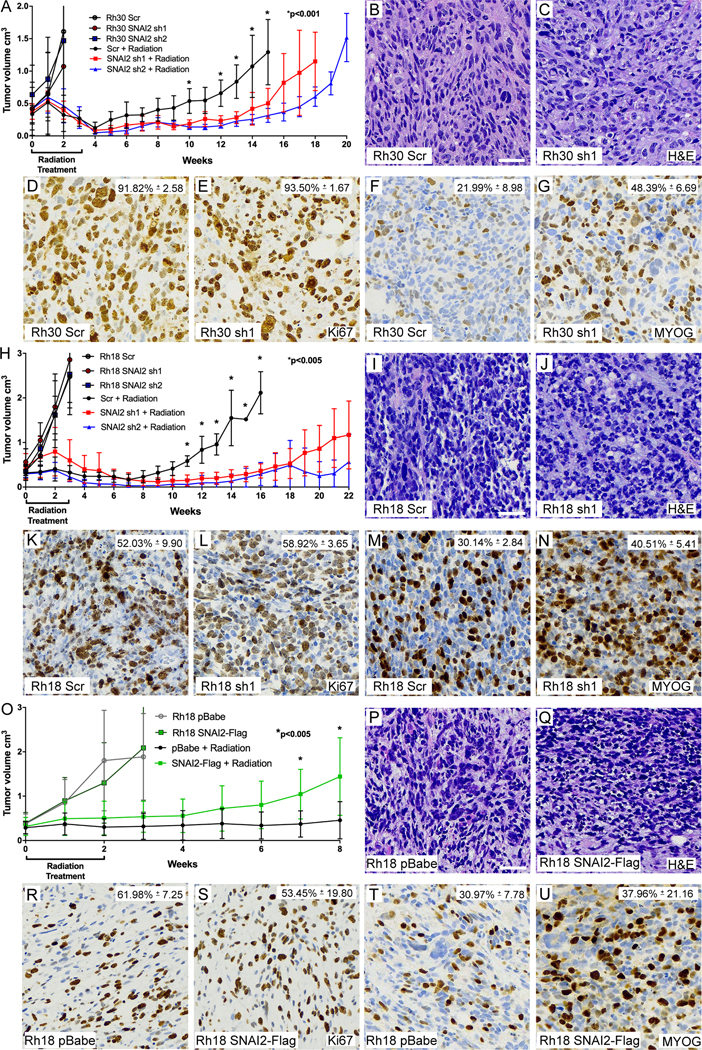
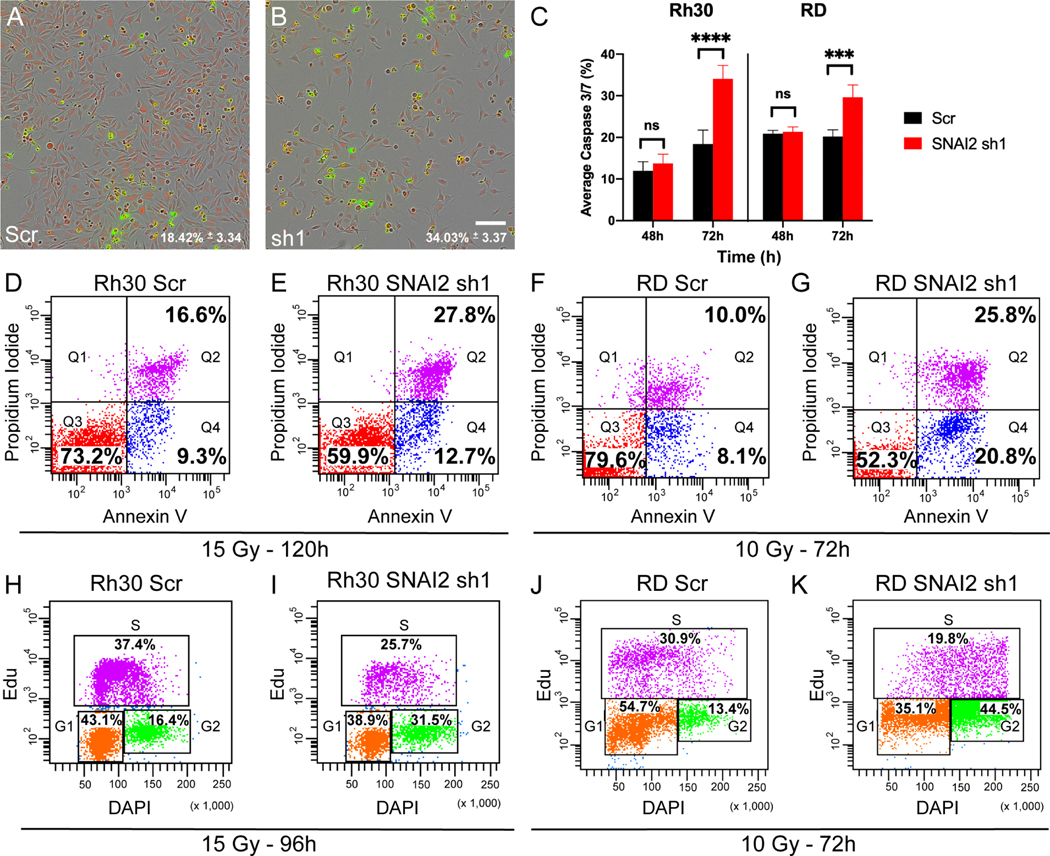
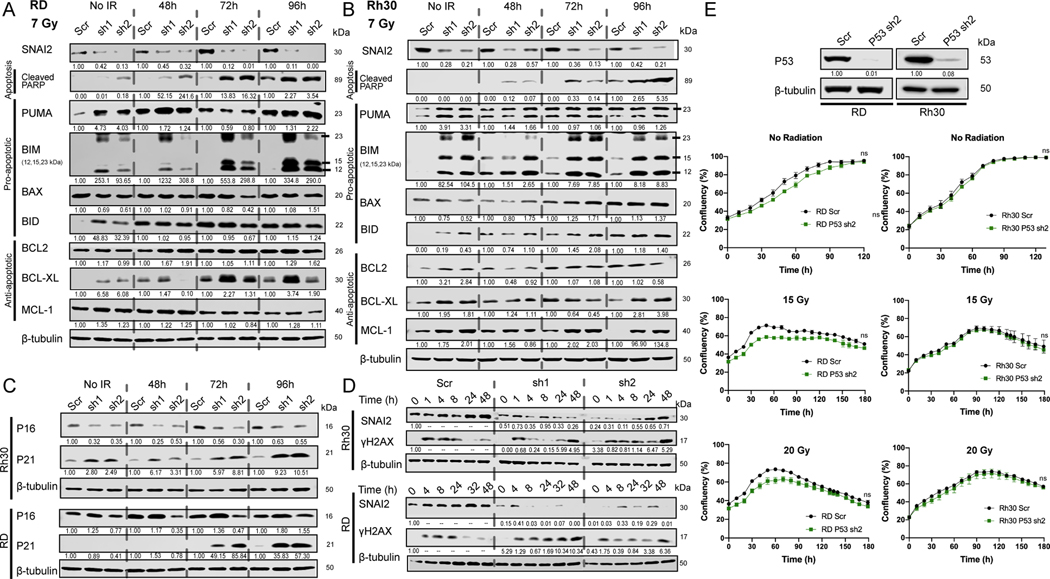
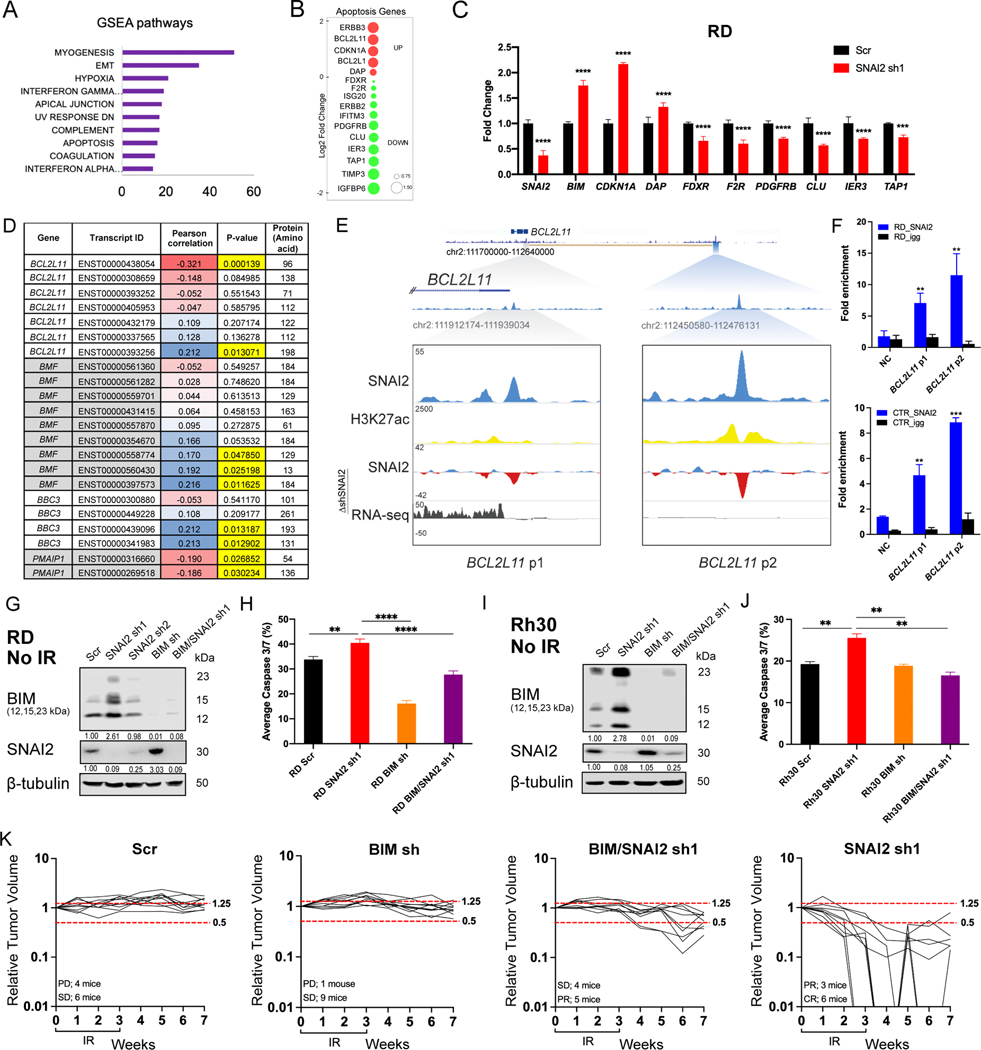
Ionizing radiation (IR) and chemotherapy are mainstays of treatment for patients with rhabdomyosarcoma, yet the molecular mechanisms that underlie the success or failure of radiotherapy remain unclear. The transcriptional repressor SNAI2 was previously identified as a key regulator of IR sensitivity in normal and malignant stem cells through its repression of the proapoptotic BH3-only gene PUMA/BBC3. Here, we demonstrate a clear correlation between SNAI2 expression levels and radiosensitivity across multiple rhabdomyosarcoma cell lines. Modulating SNAI2 levels in rhabdomyosarcoma cells through its overexpression or knockdown altered radiosensitivity in vitro and in vivo. SNAI2 expression reliably promoted overall cell growth and inhibited mitochondrial apoptosis following exposure to IR, with either variable or minimal effects on differentiation and senescence, respectively. Importantly, SNAI2 knockdown increased expression of the proapoptotic BH3-only gene BIM, and chromatin immunoprecipitation sequencing experiments established that SNAI2 is a direct repressor of BIM/BCL2L11. Because the p53 pathway is nonfunctional in the rhabdomyosarcoma cells used in this study, we have identified a new, p53-independent SNAI2/BIM signaling axis that could potentially predict clinical responses to IR treatment and be exploited to improve rhabdomyosarcoma therapy. SIGNIFICANCE: SNAI2 is identified as a major regulator of radiation-induced apoptosis in rhabdomyosarcoma through previously unknown mechanisms independent of p53.


Conflict of interest statement

Conflicts of Interest: The authors declare no potential conflicts of interest.

Figures

Figure 1.
Figure 1.. SNAI2 expression directly correlates with radiosensitivity in RMS cells.
A-H. Rh18, JR-1, Rh36, RD, SMS-CTR, Rh28, Rh30, and Rh41 cells were radiated at 24h post imaging with varying levels of radiation and cell confluency (%) was assessed using Incucyte Zoom software based on phase-contrast images acquired from 0 h to 120 h. Error bars represent ±1 SD. I. Western blot showing protein levels of SNAI2, SNAI1, TWIST1, PUMA, BIM, and P53 in parental RMS cell lines with skeletal human myoblast cells (hSKMCs) as a control. Asterisks (*) note RMS cell lines with known P53 mutations. J. PeCan SNAI2 RNA-seq data for ARMS (orange) and ERMS (green) tumors.
Figure 2.
Figure 2.. SNAI2 protects RMS cells from IR in vitro.
A. Western blot showing protein expression for SNAI2 of control (Scr shRNA) or SNAI2 knockdown (sh1 or sh2) in Rh30 cells. B, C. Cell Confluency measured as a % of the total of Rh30 cells with no IR or IR at 20 Grays (Gy) with either control or SNAI2 knockdown was assessed using phase-contrast images acquired from 0 h to 120 h. Error bars represent ±1 SD. Ns = not significant, ***p<0.001 by two-way ANOVA with Sidak’s multiple comparisons test. D. Survival fractions of Rh30 Scr and SNAI2 knockdown colony formation assays were assessed at increasing IR dose exposures. Error bars represent ±1 SD. Statistical differences were observed at 8 Gy. ***p<0.0001 by one-way ANOVA with Dunnett’s multiple comparisons test. E. Western blots showing protein expression for SNAI2 after control (Scr) or SNAI2 knockdown (sh1 or sh2) in RD cells. F, G. Cell Confluency measured as a % of the total of RD cells with no IR or IR at 15 Gy with either control or SNAI2 knockdown was assessed using phase-contrast images acquired from 0 to 120 h. Error bars represent ±1 SD. Ns = not significant, ***p<0.001by two-way ANOVA with Sidak’s multiple comparisons test. H. Survival fractions of RD Scr and SNAI2 knockdown colony formation assays were assessed at increasing IR dose exposures. Error bars represent ±1 SD. Statistical differences were observed at 6 Gy. ***p<0.0001 by one-way ANOVA with Dunnett’s multiple comparisons test. I. Western blot showing protein expression of SNAI2 in control (Scr) or SNAI2 knockdown (sh1 or sh2) Rh18 cells. J, K. Cell Confluency measured as a % of the total of Rh18 cells with no IR or IR at 10 Gy in either control or SNAI2 knockdown cells was assessed using phase-contrast images acquired from 0 to 120 h. Error bars represent ±1 SD. Ns = not significant, ***p<0.001 by two-way ANOVA with Sidak’s multiple comparisons test. L. Survival fractions of Rh18 Scr and SNAI2 knockdown colony formation assays were assessed at increasing IR dose exposures. Error bars represent ±1 SD. Statistical differences were observed at 6 Gy. ***p<0.0001 by one-way ANOVA with Dunnett’s multiple comparisons test.
Figure 3.
Figure 3.. SNAI2 protects RMS tumors from IR in vivo.
A. Growth curves of Rh30 xenografts including Scr shRNA and SNAI2 shRNA 1 and 2 (sh1, sh2) engrafted in mice. Xenograft growth was assessed under no IR and 30 Gy IR treatments. IR was given for 3 weeks at 2 Gy/day, 5 days a week. Error bars represent ±1 SD. *p<0.001 by Student’s t test. B, C. H&E staining showing histology of Rh30 Scr and SNAI2 knockdown tumor sections. Scale bar = 100 μm. D-G. Immunohistochemistry analysis of Ki67 (D, E) staining to assess proliferation and Myogenin (MYOG) staining (F, G) in Rh30 xenografts with either Scr shRNA or SNAI2 sh1. Ki67 –Scr vs. sh1 p. MYOG – Rh30 Scr vs. Rh30 sh1 p<0.05 by Welch’s t test. Magnification same as B, C. H. Growth curves of Rh18 xenografts including Rh18 Scr shRNA and SNAI2 shRNA 1 and 2 (sh1, sh2) engrafted in mice. Xenograft growth was assessed under no IR and 30 Gy IR treatments. IR was given for 3 weeks at 2 Gy/day for 5 days a week. Error bars represent ±1 SD. *p<0.005 by Student’s t test. I, J. H&E staining showing histology of Rh18 Scr and SNAI2 knockdown tumor sections. Scale bar = 100 μm. K-N. Immunohistochemistry analysis of Ki67 (K, L) staining to assess proliferation and Myogenin (MYOG) staining (M, N) in Rh18 xenografts with either Scr shRNA or SNAI2 sh1. MYOG – Scr vs. sh1 p=0.0519 by Welch’s t test. Magnification same as I, J. O. Growth curves of Rh18 xenografts expressing control vector (pBabe) and SNAI2-Flag engrafted in mice. Xenograft growth was assessed under no IR and 20 Gy IR treatments. IR was given for 2 weeks at 2 Gy/day for 5 days a week. Error bars represent ±1 SD. *p<0.005 by Student’s t test. P, Q. H&E staining showing histology of Rh18 pBabe and SNAI2-Flag tumor sections. Scale bar = 100 μm. R-U. Immunohistochemistry analysis of Ki67 (R, S) staining to assess proliferation and Myogenin (MYOG) staining (T, U) in Rh18 xenografts with either pBabe or SNAI2-Flag expression. Ki67 – pBabe vs. SNAI2-Flag not significantly different. MYOG – pBabe vs. SNAI2-Flag p=0.0519 by Welch’s t test. Magnification same as P, Q.
Figure 4.
Figure 4.. Loss of SNAI2 promotes IR-mediated apoptosis and blocks irradiated RMS cells from exiting the cell cycle.
A, B. Representative images of Caspase-Glo assay in Rh30 cells (either control or SNAI2 knockdown) at 72h post IR exposure (15 Gy) with red labeling cells/nuclei and green labeling caspase 3/7; average caspase 3/7 levels (%) were quantified in C. Scale bar = 150 μm. C. Average Caspase 3/7 percentage (mean ± 1 SD) in Rh30 and RD Scr and SNAI2 sh1 cells 48h and 72h after IR exposure of 15 or 10 Gy respectively. ***p<0.001, ****p<0.0001 by two-way ANOVA with Sidak’s multiple comparison. D-G. Flowcytometry plots showing Propidium iodide vs. Annexin V staining of Rh30 and RD Scr or SNAI2 sh1 cells and treated with indicated IR doses. Q4 represents cells undergoing early apoptosis, whereas Q2 represents cells undergoing late apoptosis. Q3 represents live cells not undergoing apoptosis. Rh30 early apoptosis (Q4): Scr 9.3% vs. sh1 12.7%, p<0.0001, late apoptosis (Q2): Scr 16.6% vs. sh1 27.8%, p<0.0001; RD early apoptosis (Q4): Scr 8.1% vs. sh1 20.8%, p<0.0001, late apoptosis (Q2): Scr 10.0% vs. sh1 25.8%, p<0.0001 by Two Proportions Z-test. H-K. Flowcytometry plots of EdU vs. DAPI staining in Rh30 and RD cells with either Scr shRNA or SNAI2 sh1 after exposure to indicated IR doses. Rh30 Scr vs. sh1 G2 phase p<0.0001; RD Scr vs. sh1 G2 phase p<0.0001 by Two Proportions Z-test.
Figure 5.
Figure 5.. SNAI2 represses the expression of BH3-only BIM in RMS cells.
A, B. Western blot analyses to determine protein expression of SNAI2, Cleaved PARP, PUMA, BIM, BAX, BID, BCL2, BCL-XL, and MCL-1 in RD and Rh30 cells under no IR or at 48-, 72-, or 96-hpIR after 7 Gy treatment. C. Western blot analysis to determine protein expression of P16 and P21 in Rh30 and RD cells under no IR or at 48-, 72-, or 96-hpIR with 7 Gy. Protein used for RD cell line western blots was from the same analyses for experiments in Figure 5A (see above), therefore the β-tubulin blot is the same as in Figure 5A. D. Western blot analysis of γH2AX over time after exposure to 7 Gy IR in Rh30 and RD control (Scr) and SNAI2 knockdown (sh1 and sh2) cells. E. Western blot analysis to determine protein levels of P53 in RD and Rh30 cells (either Scr control or P53 sh2 knockdown). Confluency (%) of non-IR or IR-treated (15 or 20 Gy) RD and Rh30 cells (with either Scr control or P53 shRNA knockdown) was assessed on phase-contrast images acquired from 0 to 180 h. No statistical differences were observed. Error bars represent ±1 SD. ns = not significant by Unpaired t test.
Figure 6.
Figure 6.. Direct repression of BIM by SNAI2 blocks apoptosis in irradiated RMS cells.
A. GSEA pathway analysis comparing mRNA expression (RNA-seq) in control/Scr and SNAI2 shRNA treated RD cells 24 h post IR (5 Gy). Enriched pathways in shSNAI2 cells (GSEA Hallmark pathways) with number of up-regulated genes in each pathway class (x-axis). B. RNA-seq data showing genes highly upregulated or downregulated when comparing control/ Scr- and SNAI2-shRNA knockdown RD cells 24 h post IR (5 Gy). Red circles denote up-regulated genes and Green denotes down-regulated genes; size of circles represent Log2 fold change compared to shScr. C. Real time qPCR analysis (mean ± 1 SD) of various cell cycle and apoptosis genes in RD cells 48h after irradiation with 5 Gy. ***p<0.001, ****p<0.0001 by two-way ANOVA with a Sidak’s multiple comparisons test. D. Pearson correlation between the expression of SNAI2 and pro-apoptotic regulators BIM/BCL2L11, BMF, BBC3, and PMAIP1 in primary human RMS assessed by RNA-sequencing analysis. Blue cells indicate positive correlation, while red cells indicate negative correlation. E. ChIP-seq tracks of SNAI2 (Blue), H3K27ac (Yellow) binding at the BIM/BCL2L11 locus in SMS-CTR cells in shScr cells and delta (Δ) enrichment value (shSNAI2 sh1 minus shScr, Blue and Red) for SNAI2 and gene expression (RNA-seq, Black). Boxed area corresponds to SNAI2 binding region and shaded areas represent relative position of the peaks to the TAD containing BCL2L11. Values on Y-axis represent fold enrichment. F. ChIP-qPCR of SNAI2 enriched regions down stream of BIM/BCL2L11 gene in RD and SMS-CTR cells. Fold enrichment value of SNAI2 at the BCL2L11-peak1 & peak2, is plotted along with Negative Control region (NC) and IgG controls, **p<0.01, ***p<0.0001 by Unpaired t test compared to NC. G. Western blot analyses of BIM and SNAI2 expression in non-IR treated RD cells under either Scr control, SNAI2 shRNA, BIM shRNA, or double BIM/SNAI2 shRNA conditions. H. Average Caspase 3/7 (%) (mean ± 1 SD) in RD Scr, SNAI2 sh1, BIM sh, and BIM/SNAI2 sh1 cells 72h after IR exposure (15 Gy). **p<0.01, ****p<0.0001 by one-way ANOVA with Tukey’s multiple comparisons test. I. Western blot analyses of BIM and SNAI2 expression in non-IR treated Rh30 cells under either Scr control, SNAI2 shRNA, BIM shRNA, or double BIM/SNAI2 shRNA conditions. J. Average Caspase 3/7 (%) (mean ± 1 SD) in Rh30 Scr, SNAI2 sh1, BIM sh, and BIM/SNAI2 sh1 cells 72h after IR exposure (15 Gy). **p<0.01 by one-way ANOVA with Tukey’s multiple comparisons test. K. Individual relative tumor volumes of RD Scr, SNAI2 sh1, BIM sh, and BIM/SNAI2 sh1 xenografts after 30 Gy (2 Gy/day, 5x a week, for 3 weeks). Change in volume 2 weeks post-IR: shScr = 0.0295 cm3/week, shBIM = 0.01125 cm3/week; no significant difference by one-way ANOVA with Tukey’s multiple comparisons test. Change in volume 2 weeks post-IR: shSNAI2 = −0.067 cm3/week, shSNAI2/BIM = −0.0105 cm3/week; p<0.0001 by one-way ANOVA with Tukey’s multiple comparisons test.

References

    1. Arndt CA, Crist WM. Common musculoskeletal tumors of childhood and adolescence. N Engl J Med 1999;341:342–52 - PubMed
    1. Hawkins DS, Gupta AA, Rudzinski ER. What is new in the biology and treatment of pediatric rhabdomyosarcoma? Curr Opin Pediatr 2014;26:50–6 - PMC - PubMed
    1. Hawkins DS, Spunt SL, Skapek SX, Committee COGSTS. Children’s Oncology Group’s 2013 blueprint for research: Soft tissue sarcomas. Pediatr Blood Cancer 2013;60:1001–8 - PMC - PubMed
    1. Weigel BJ, Lyden E, Anderson JR, Meyer WH, Parham DM, Rodeberg DA, et al. Intensive Multiagent Therapy, Including Dose-Compressed Cycles of Ifosfamide/Etoposide and Vincristine/Doxorubicin/Cyclophosphamide, Irinotecan, and Radiation, in Patients With High-Risk Rhabdomyosarcoma: A Report From the Children’s Oncology Group. J Clin Oncol 2016;34:117–22 - PMC - PubMed
    1. Borinstein SC, Steppan D, Hayashi M, Loeb DM, Isakoff MS, Binitie O, et al. Consensus and controversies regarding the treatment of rhabdomyosarcoma. Pediatr Blood Cancer 2018;65 - PubMed

Publication types

MeSH terms