. 2021 Oct 27;41(43):9008-9030.
doi: 10.1523/JNEUROSCI.2534-20.2021. Epub 2021 Aug 30.

Addiction-Associated Genetic Variants Implicate Brain Cell Type- and Region-Specific Cis-Regulatory Elements in Addiction Neurobiology

Affiliations

Addiction-Associated Genetic Variants Implicate Brain Cell Type- and Region-Specific Cis-Regulatory Elements in Addiction Neurobiology

Chaitanya Srinivasan et al. J Neurosci. .

Abstract

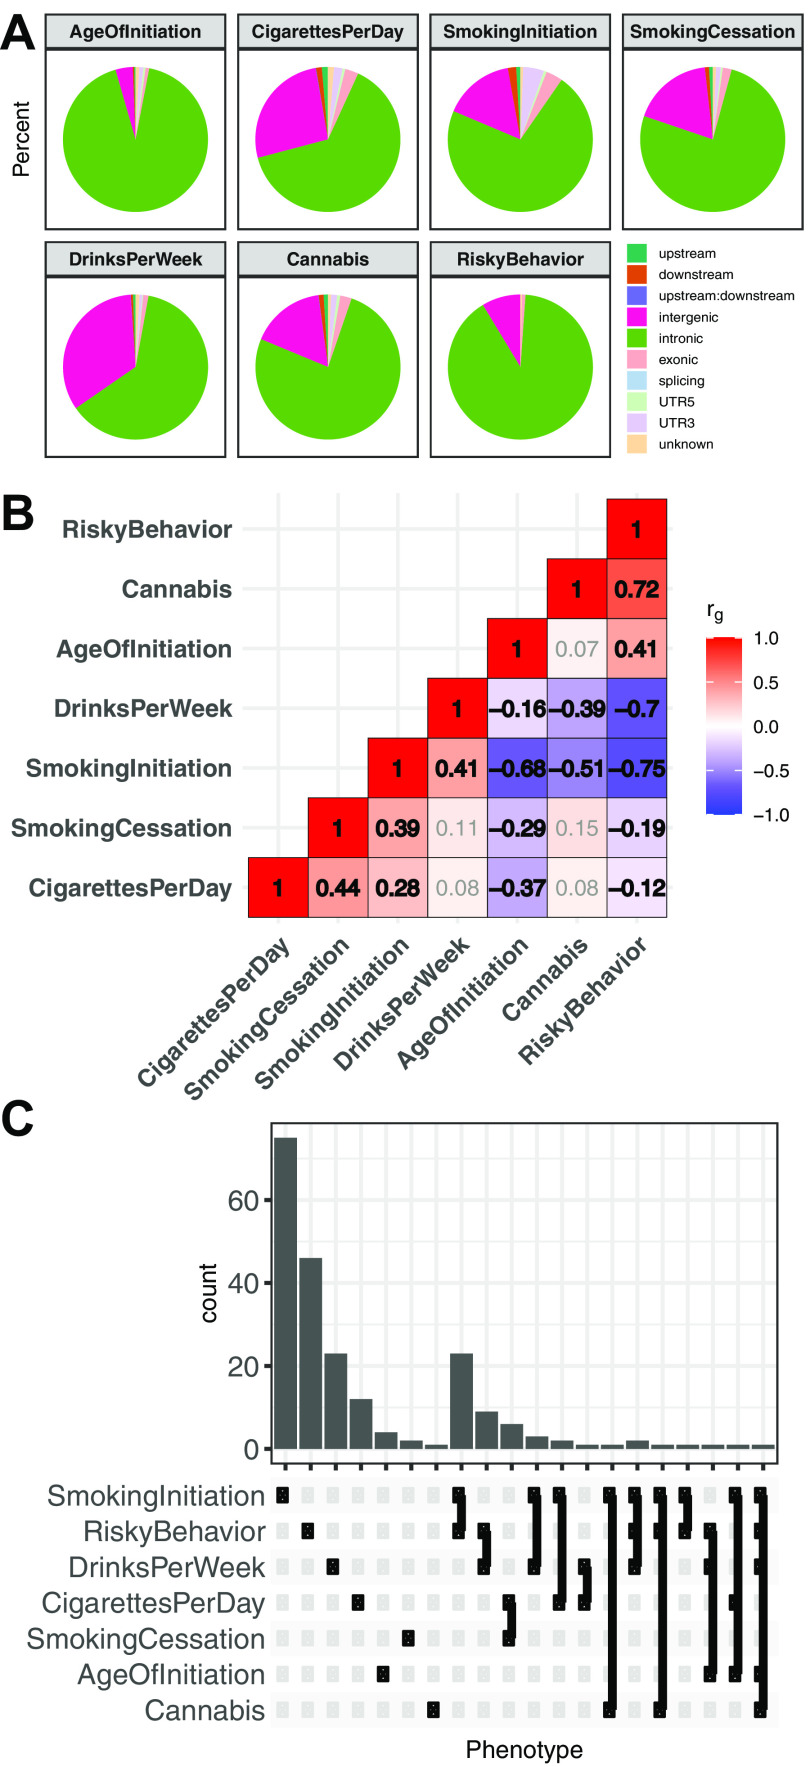
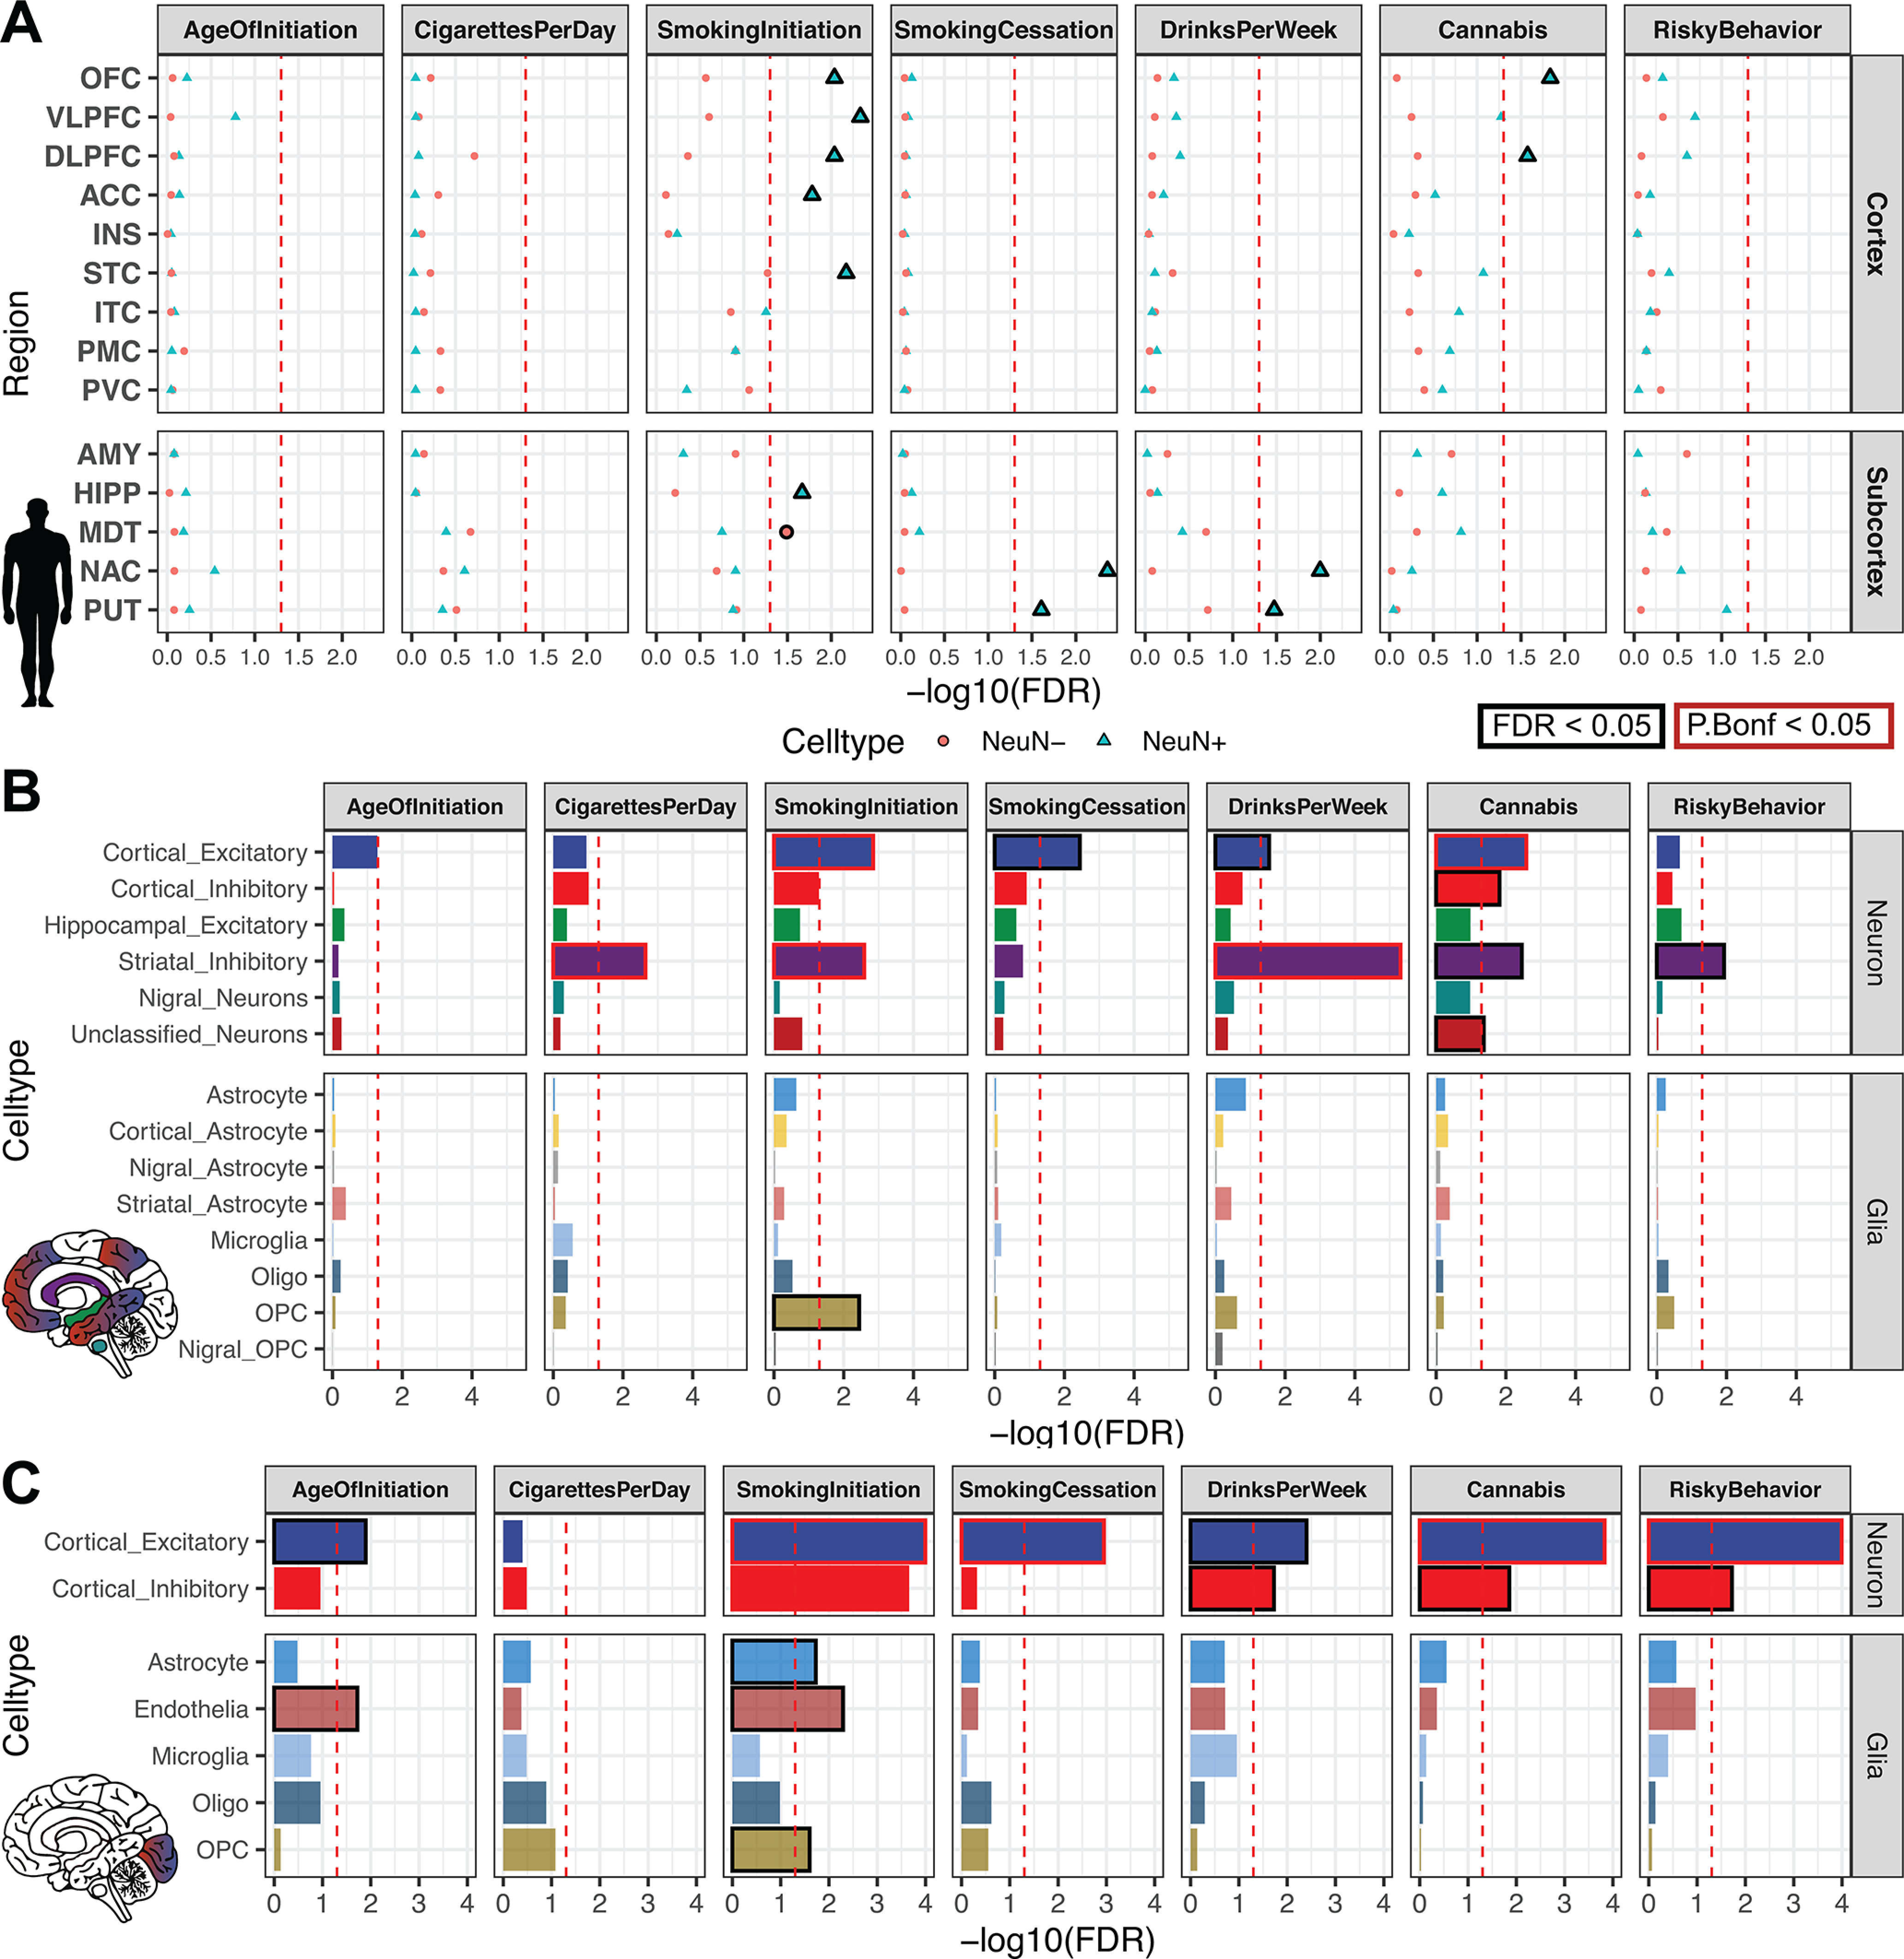
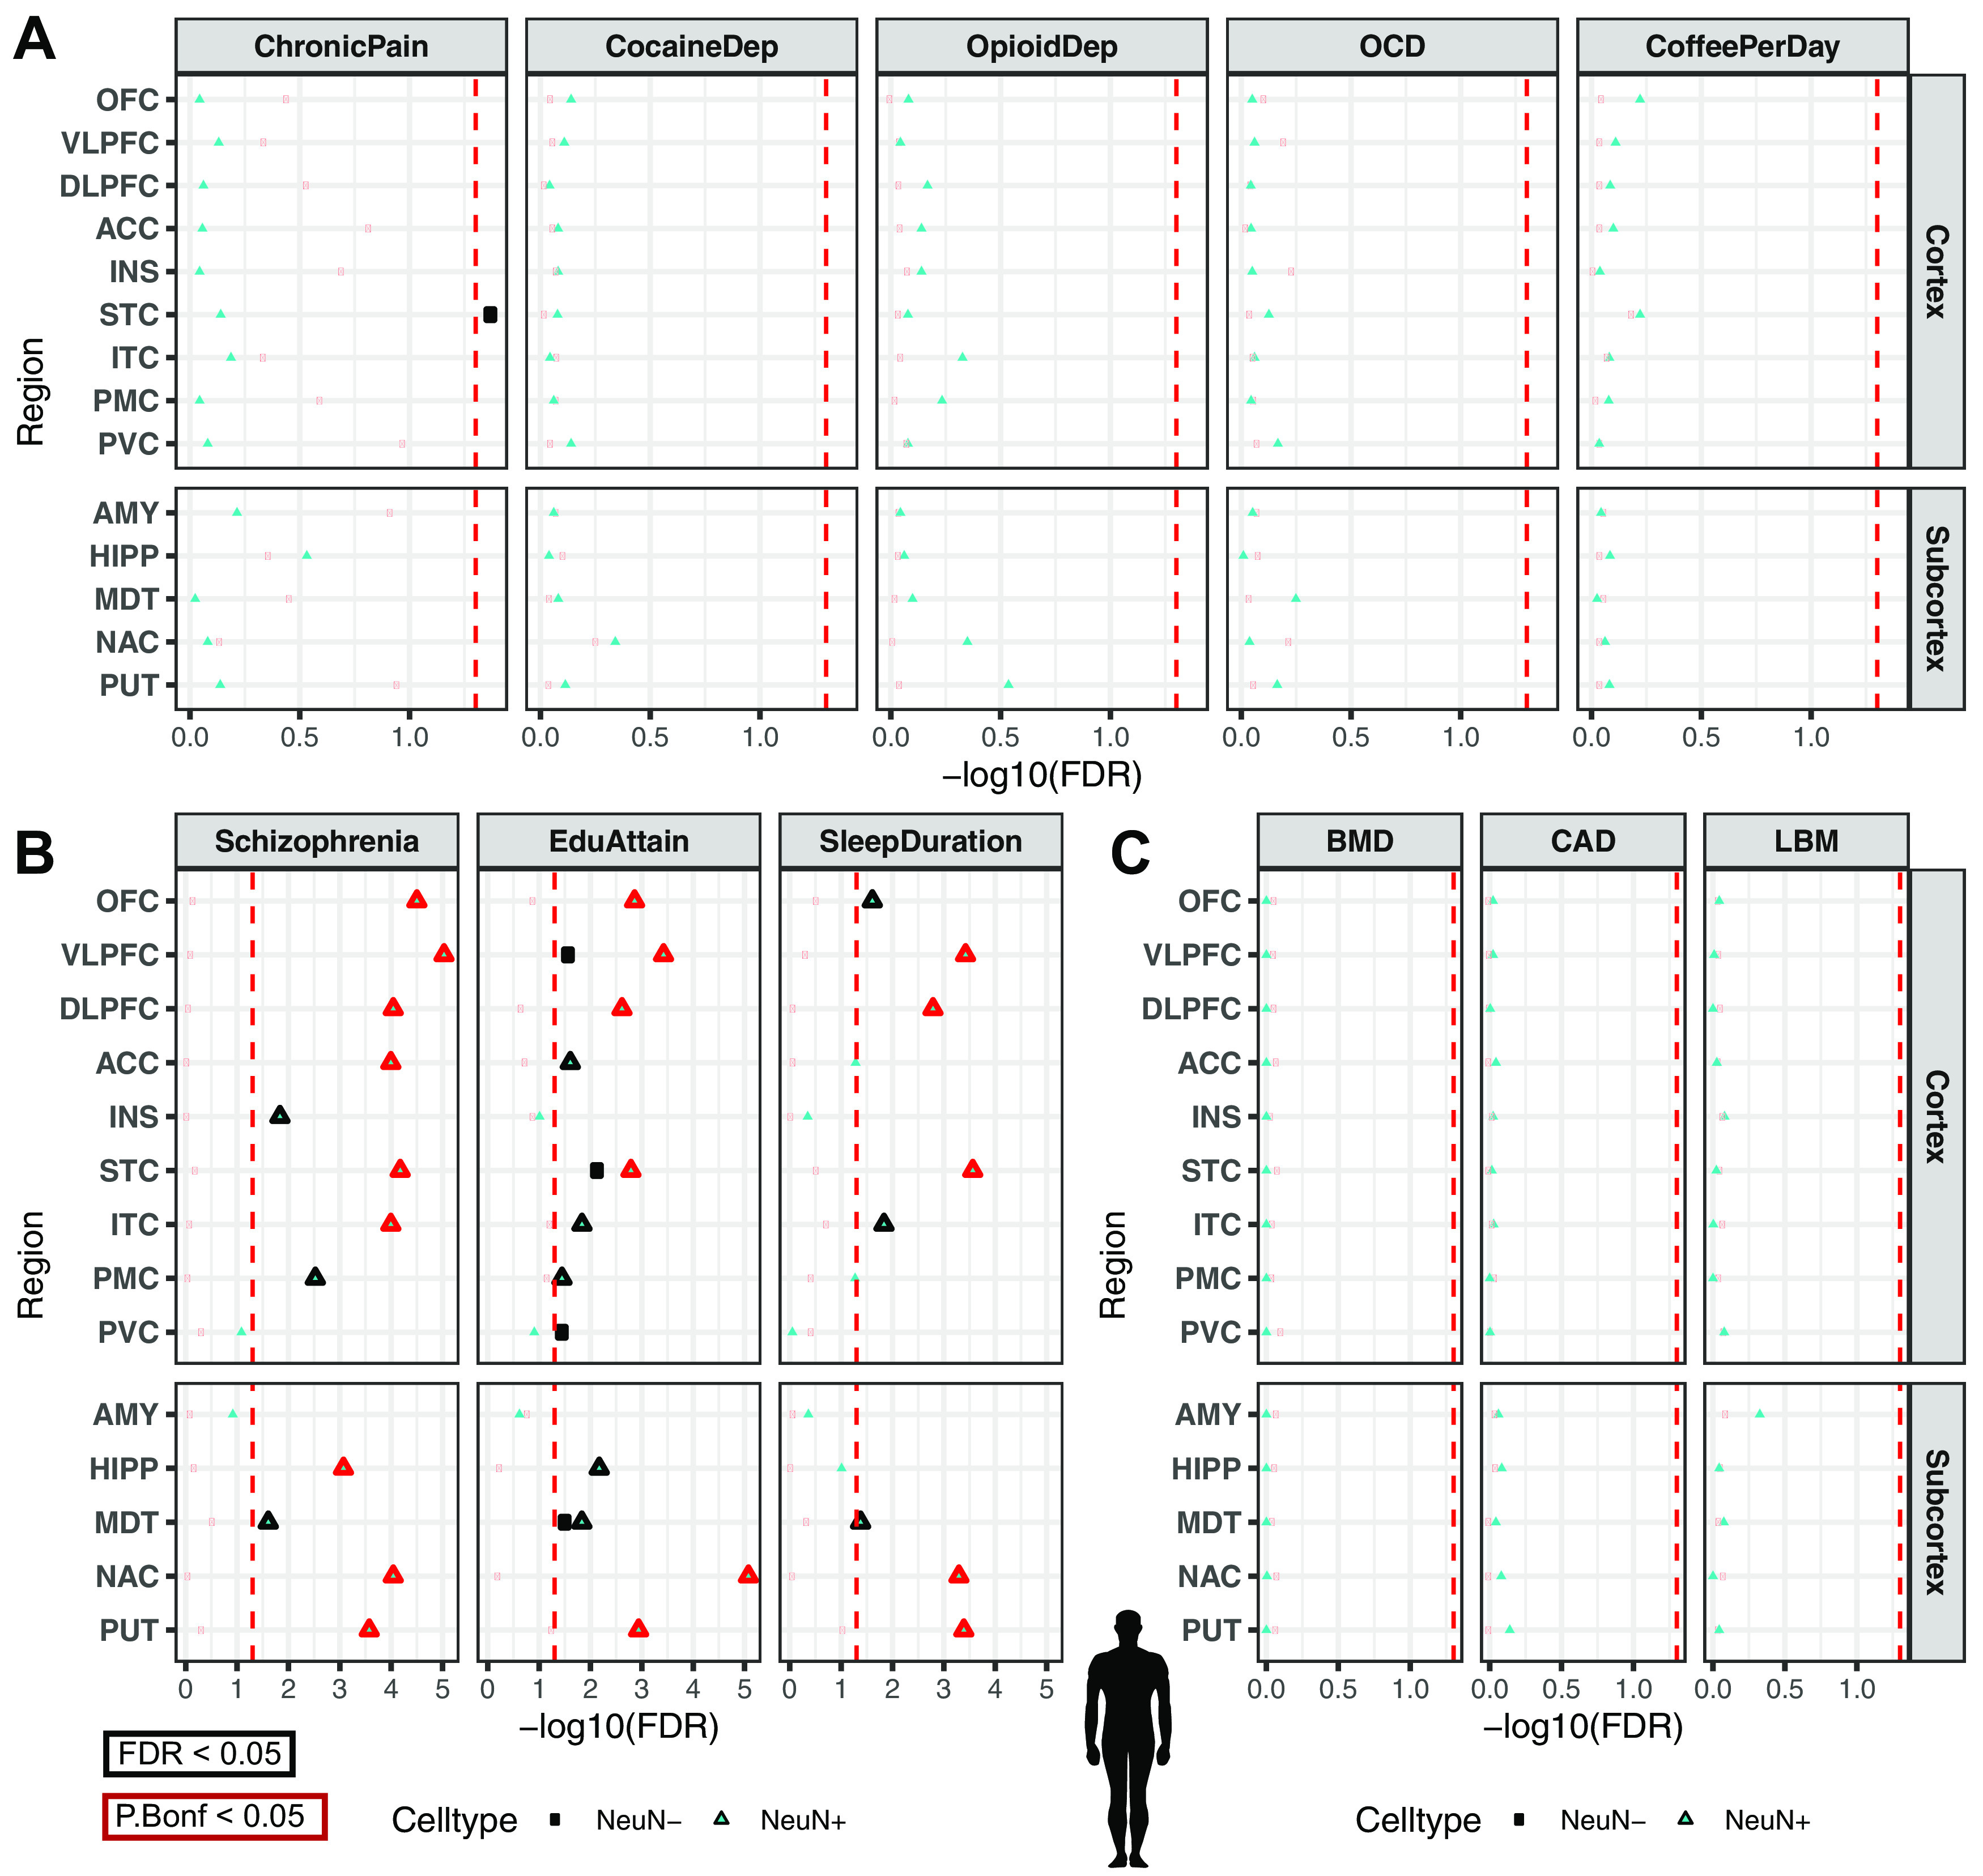
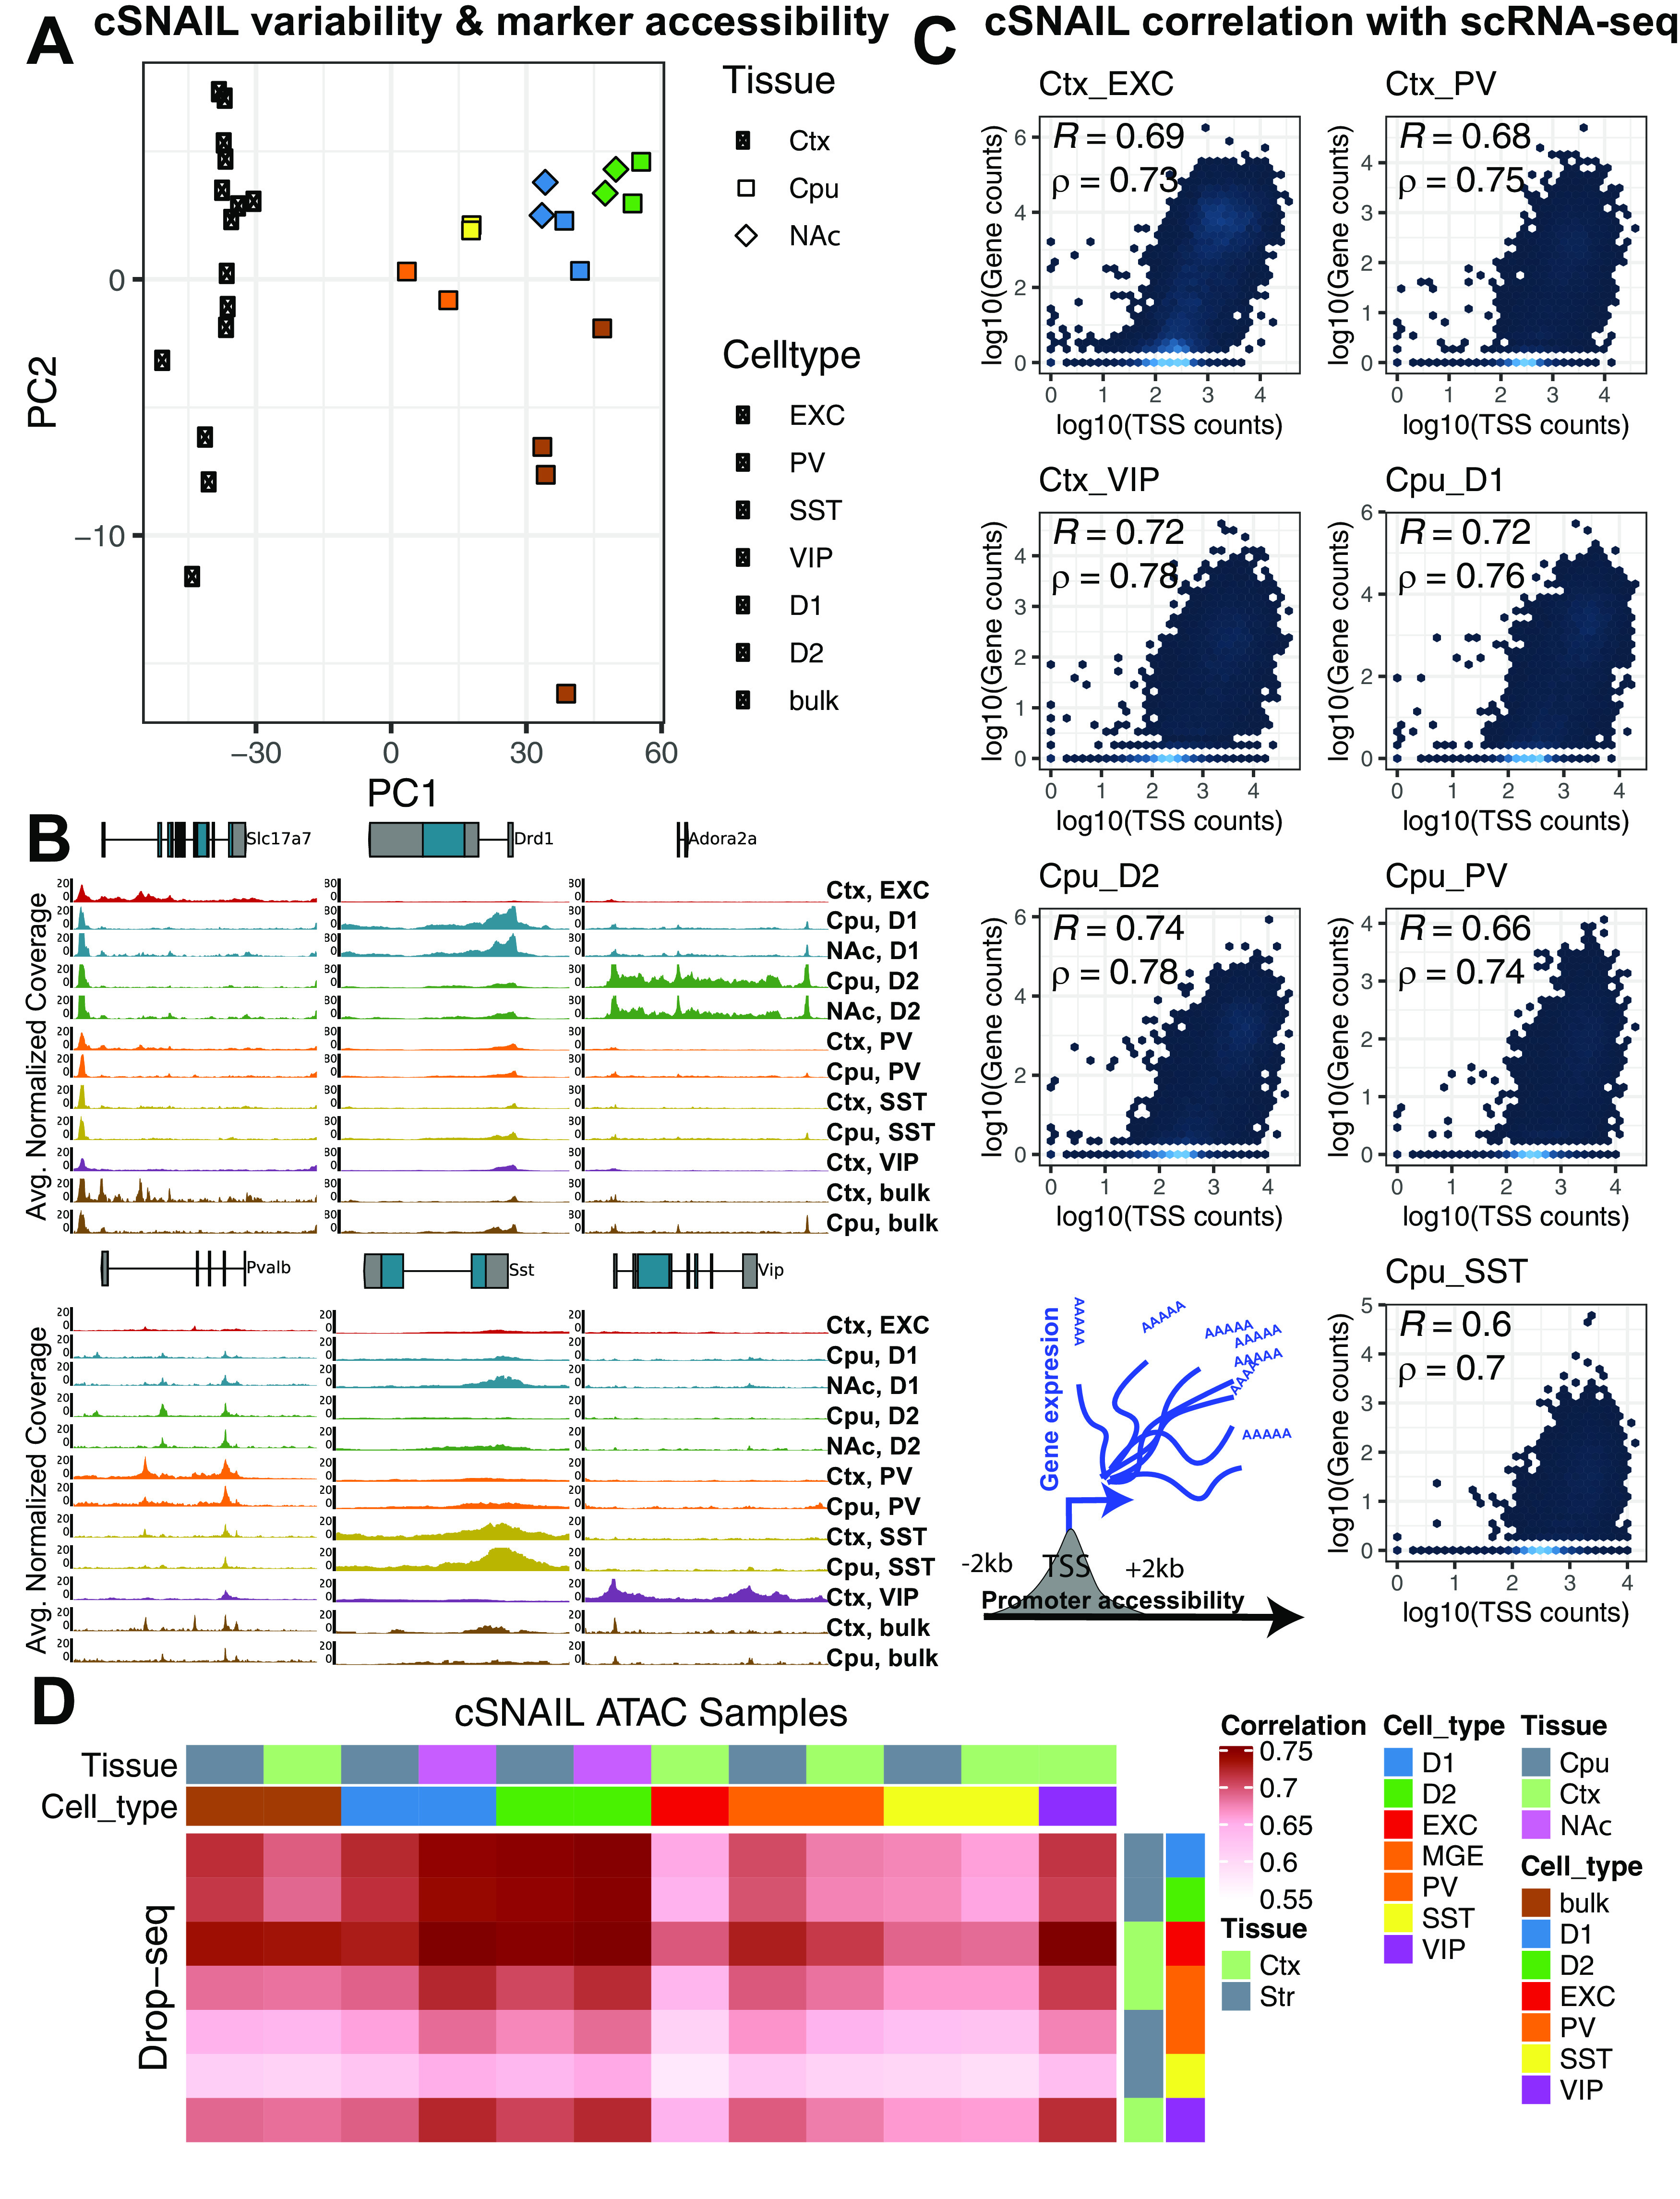
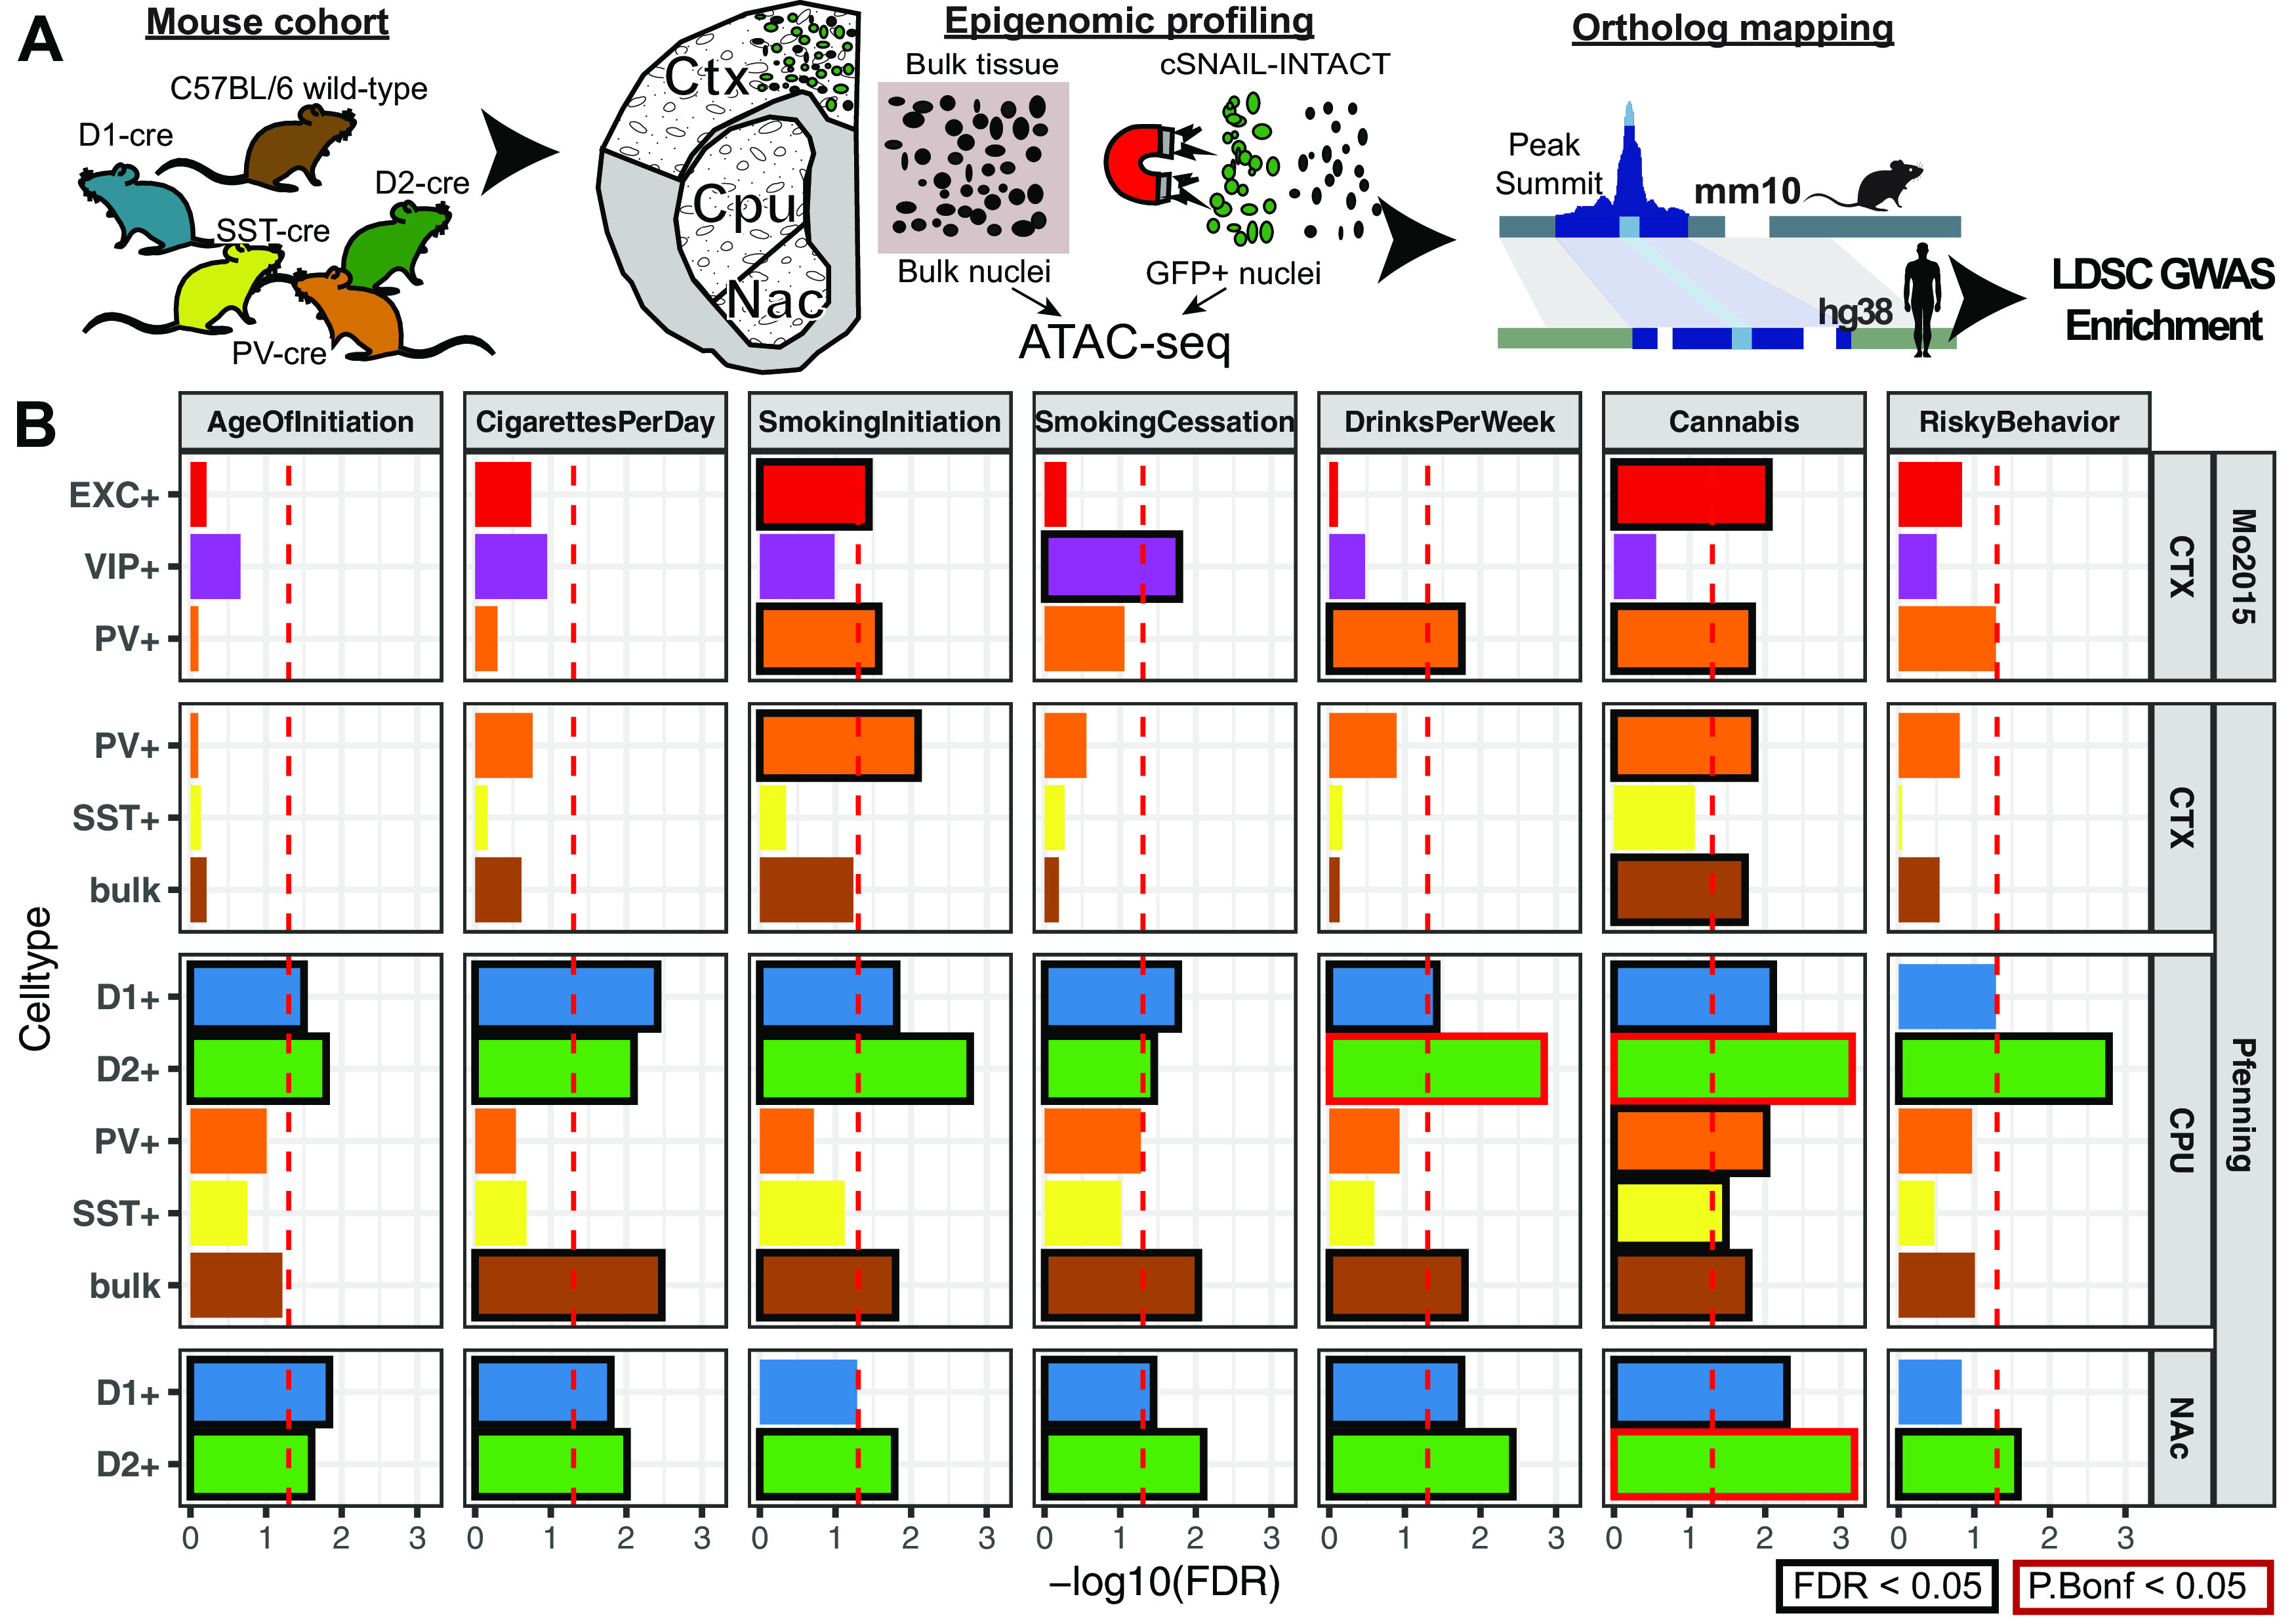
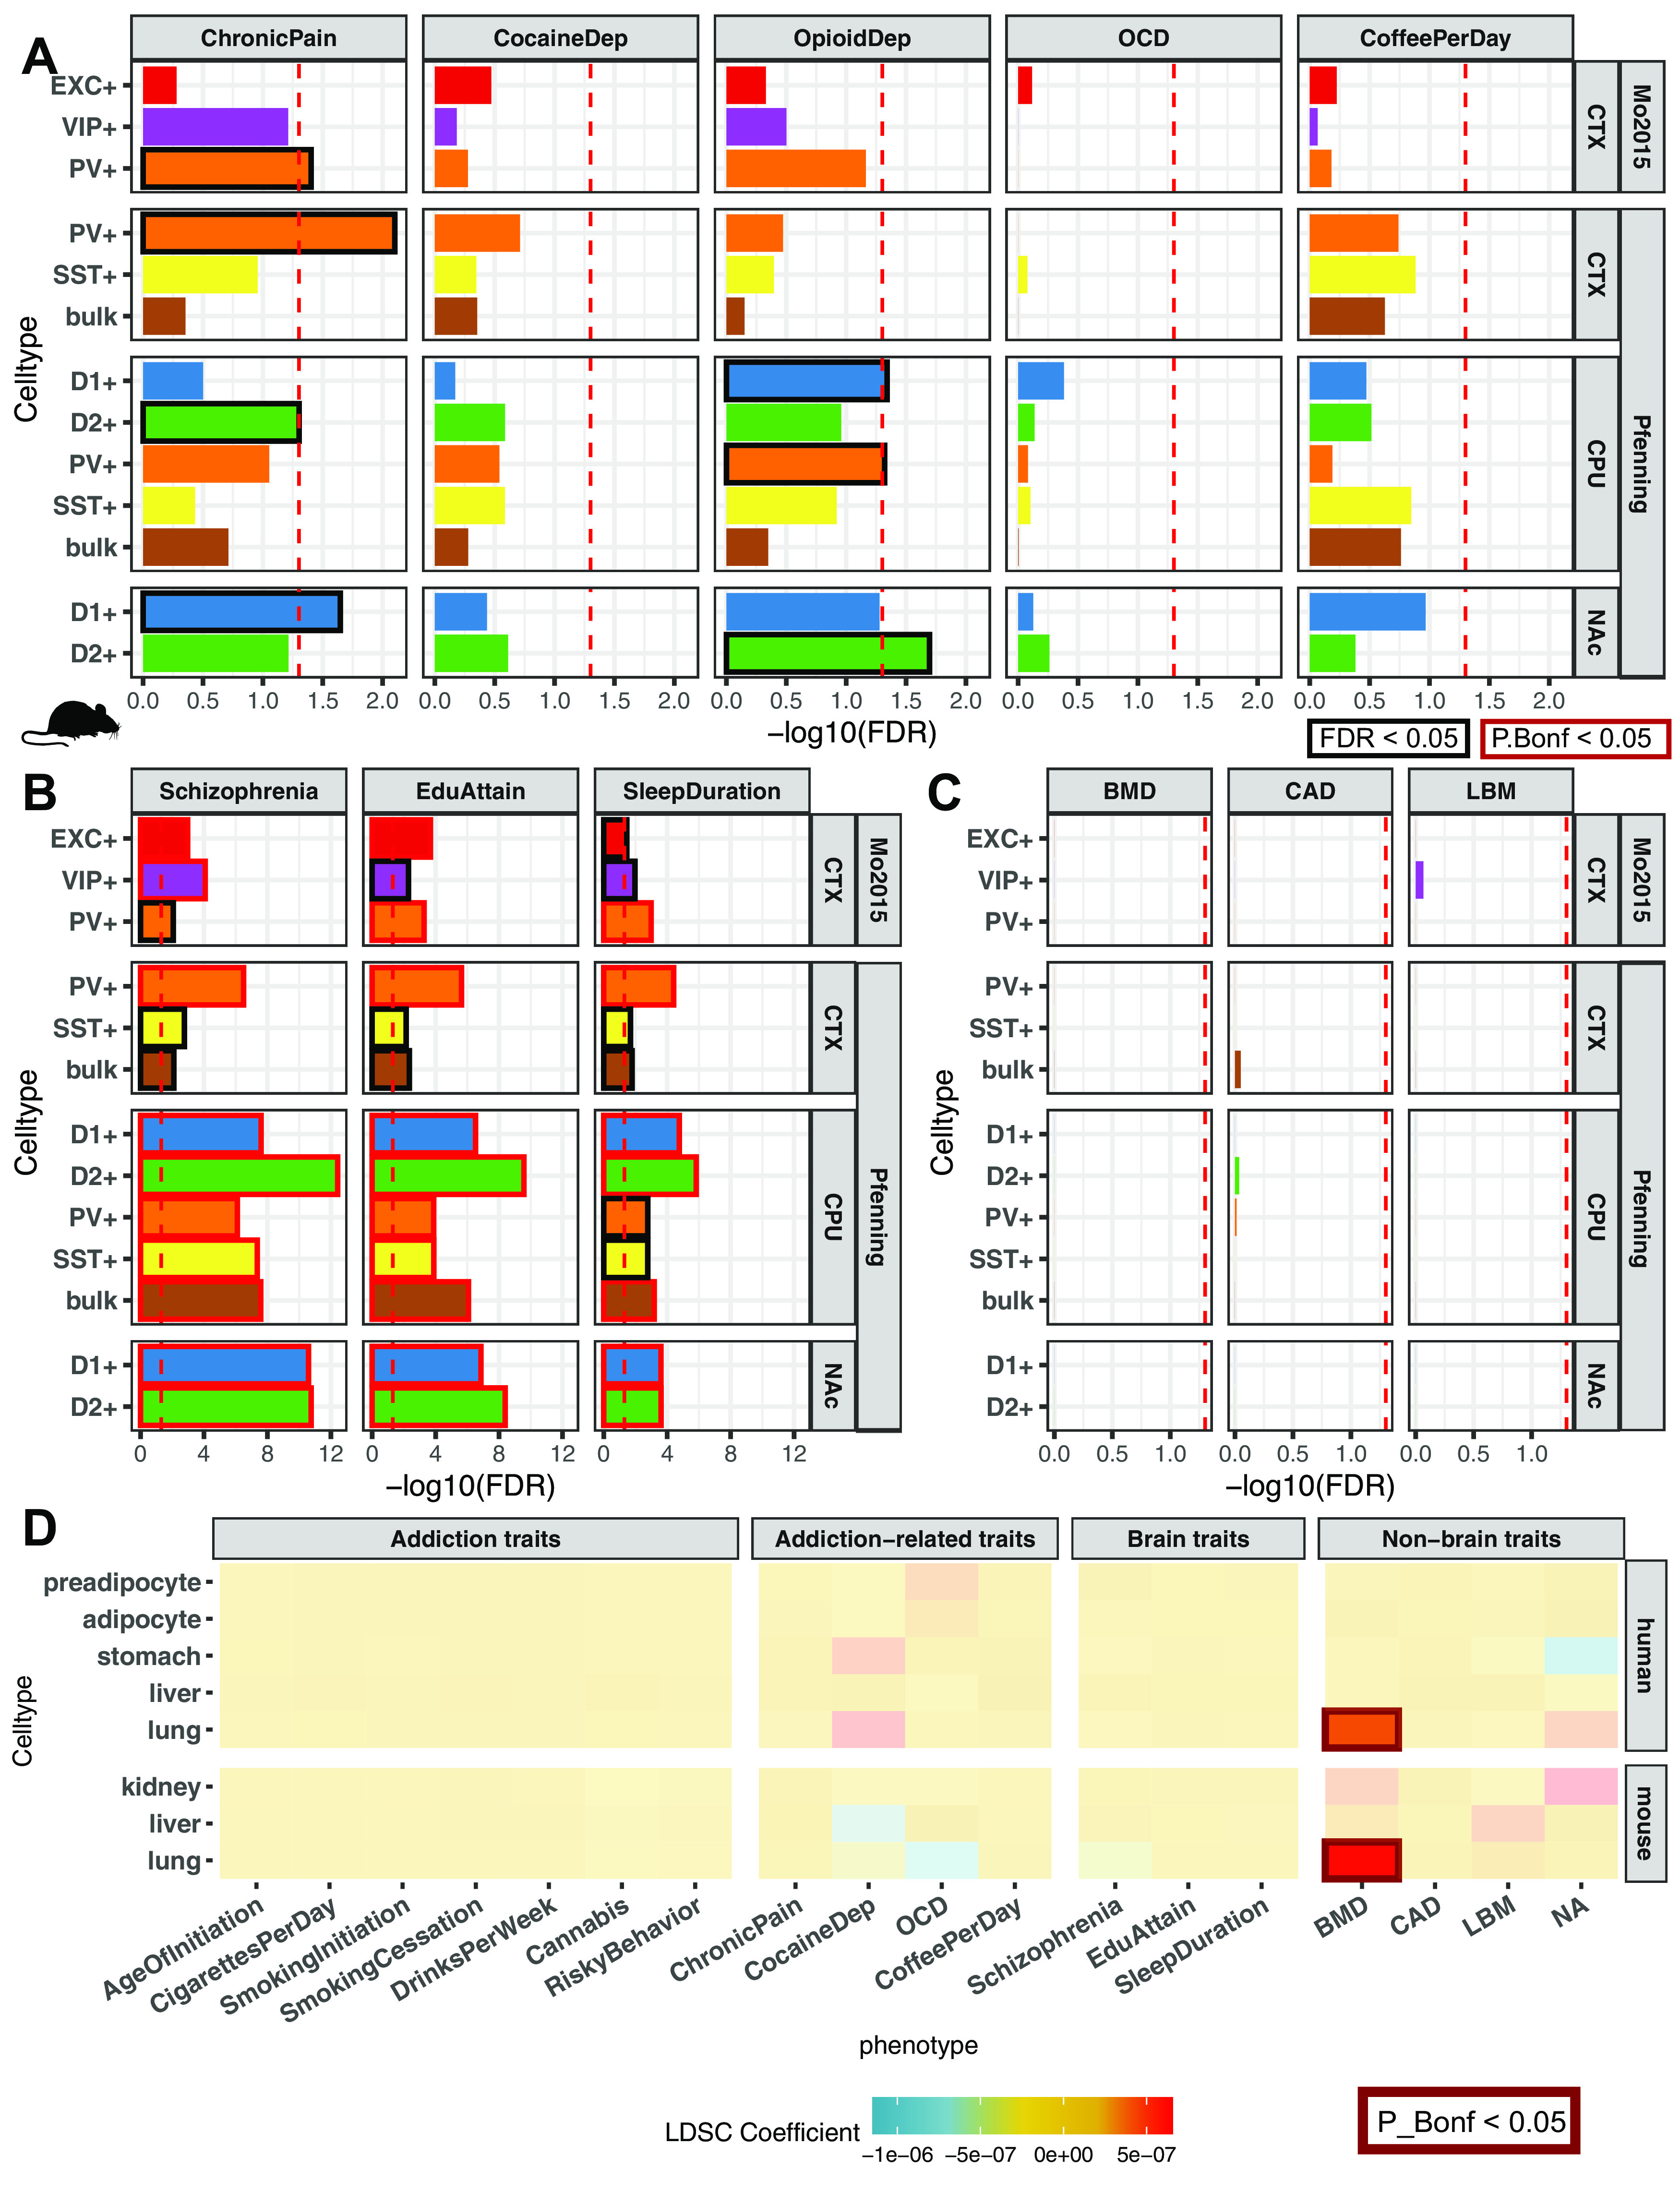
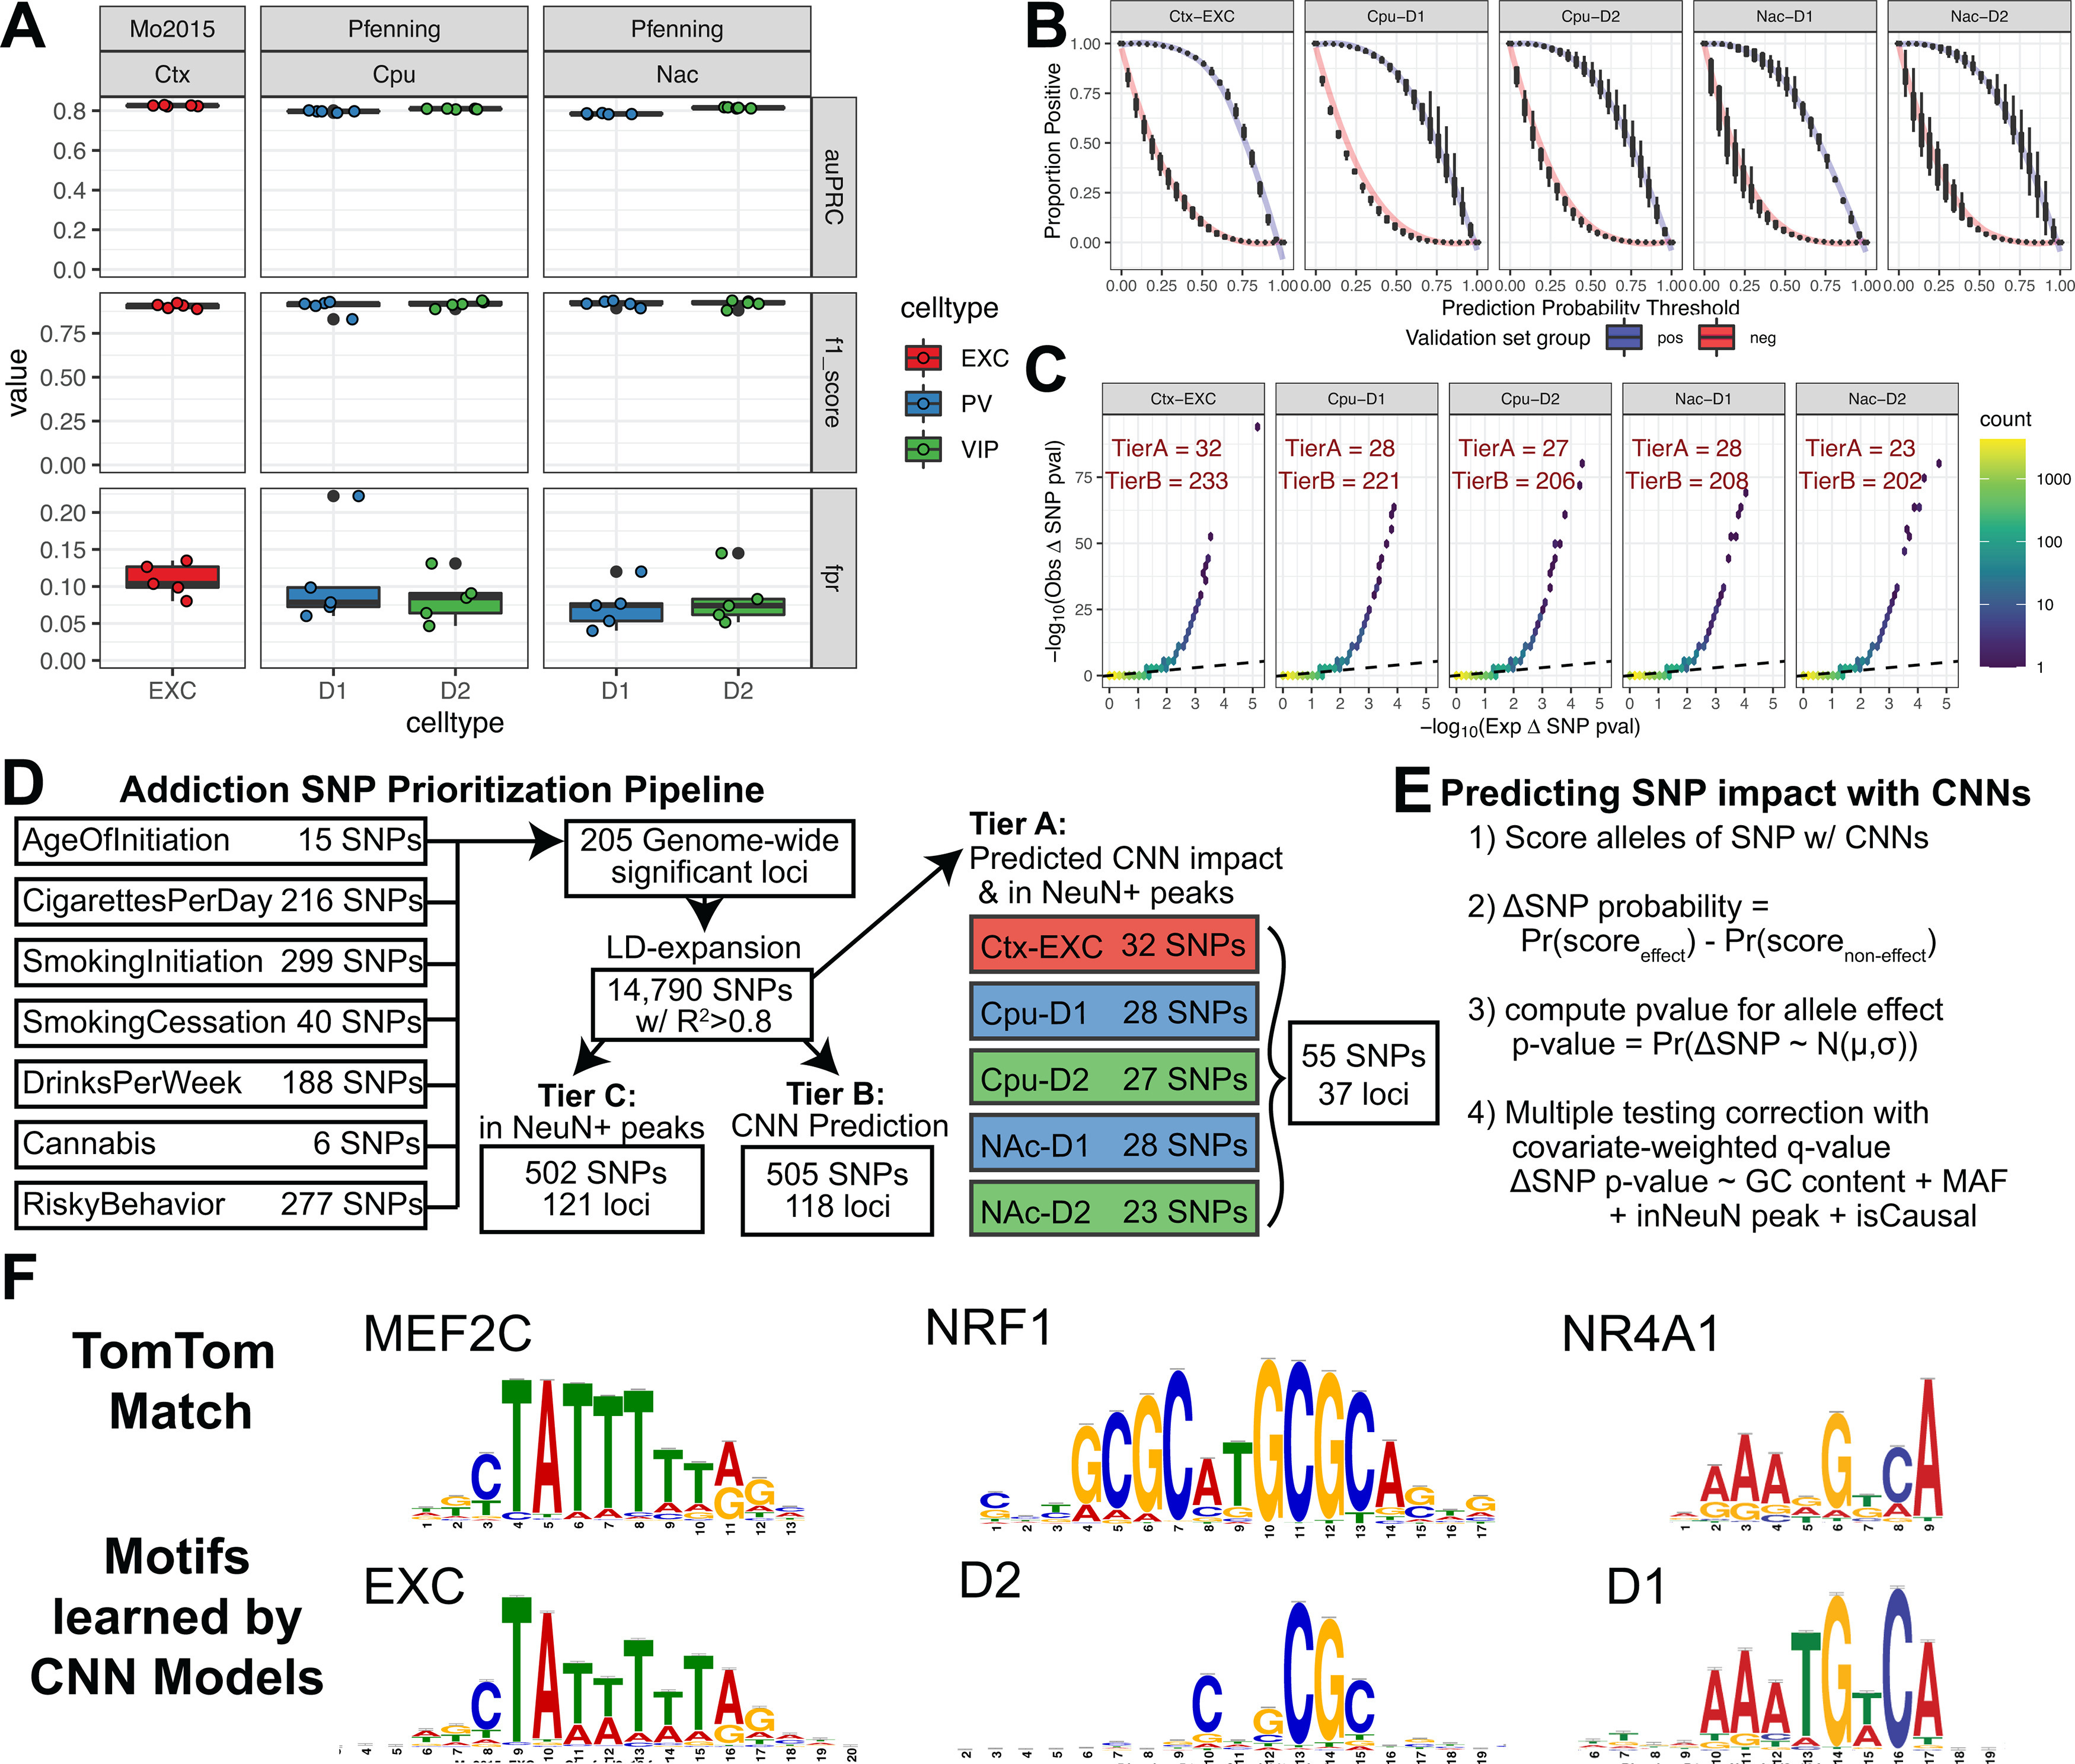
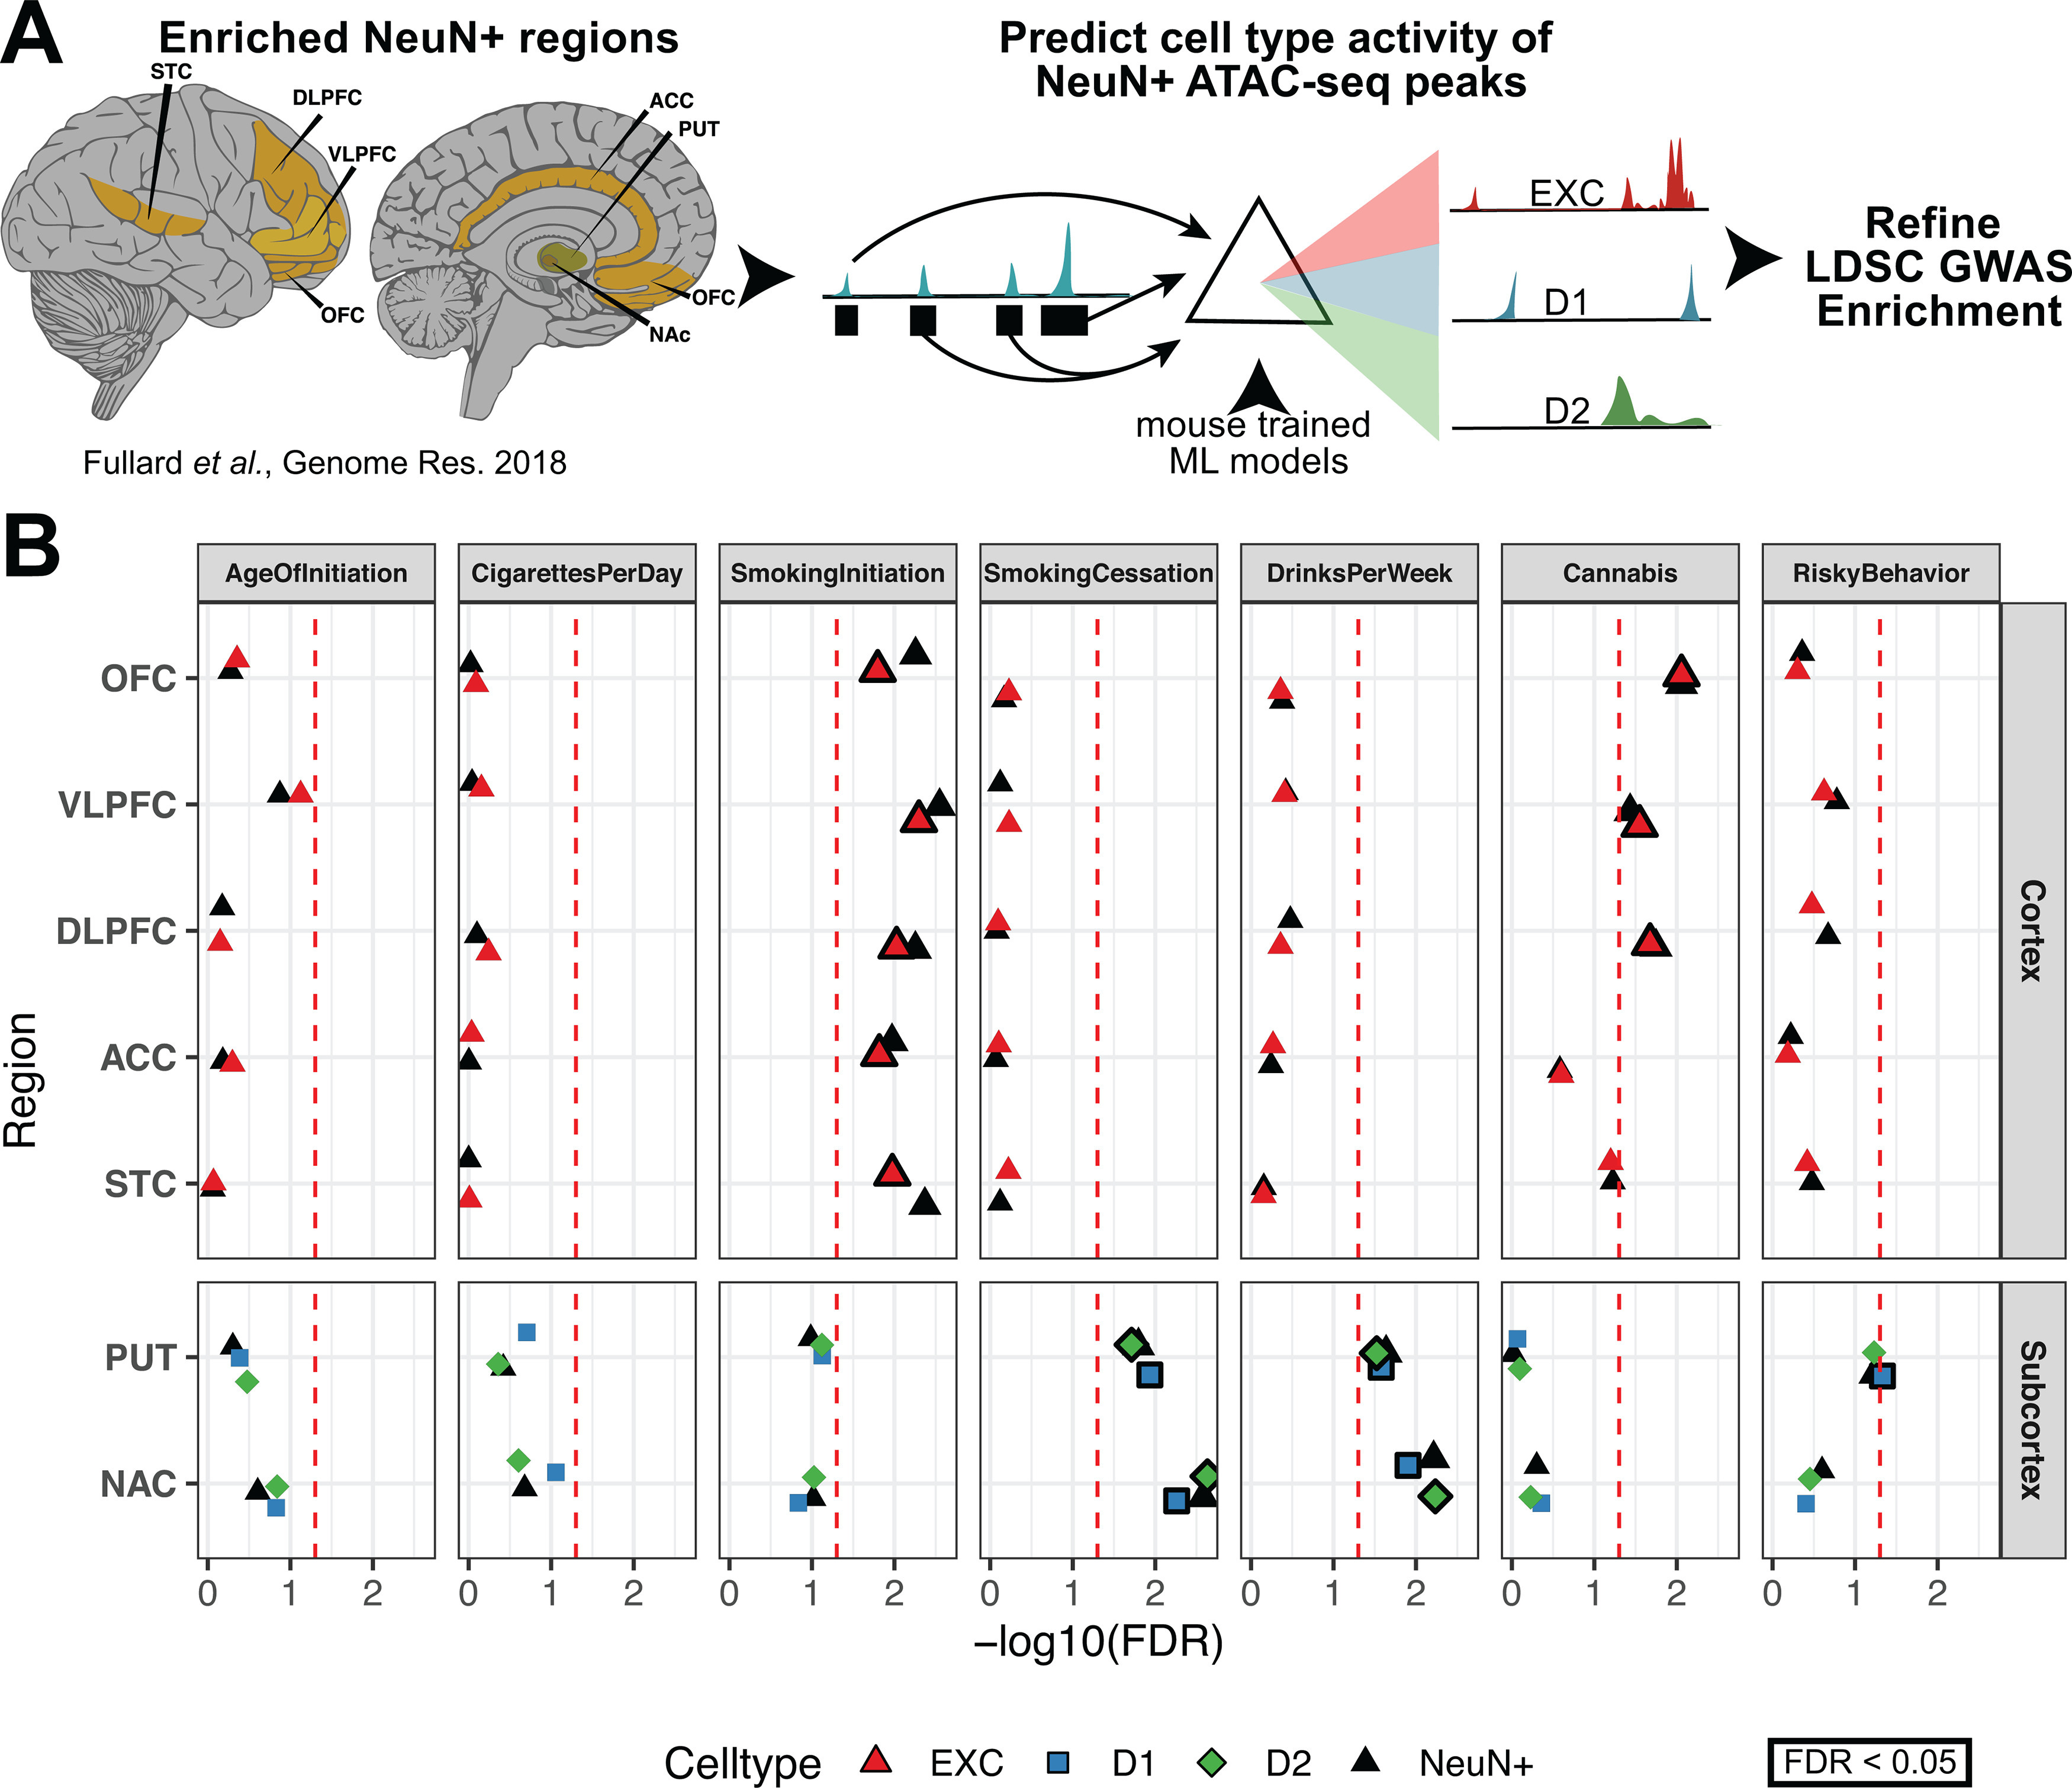
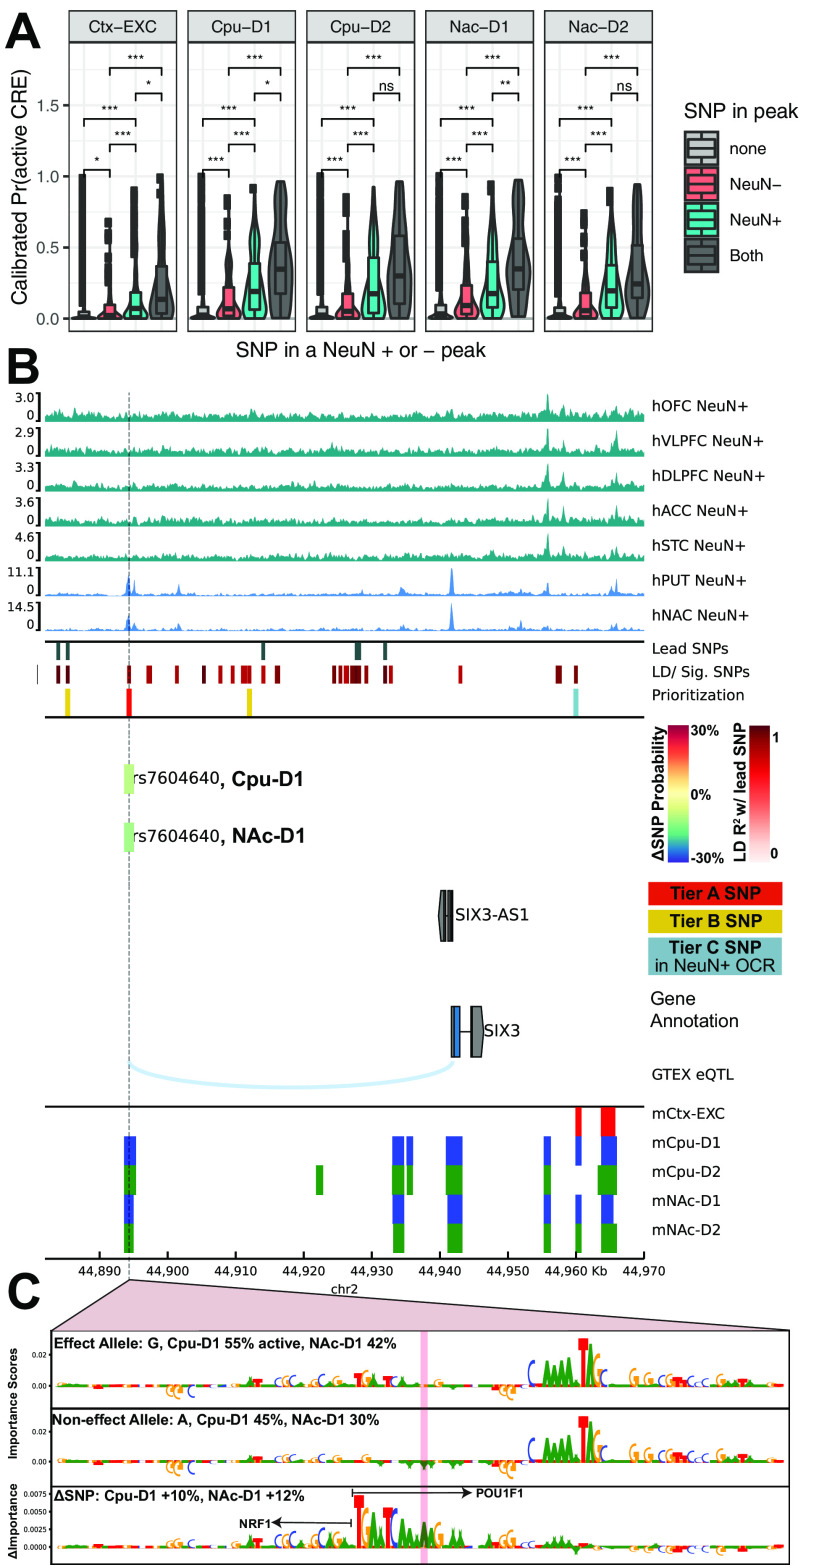
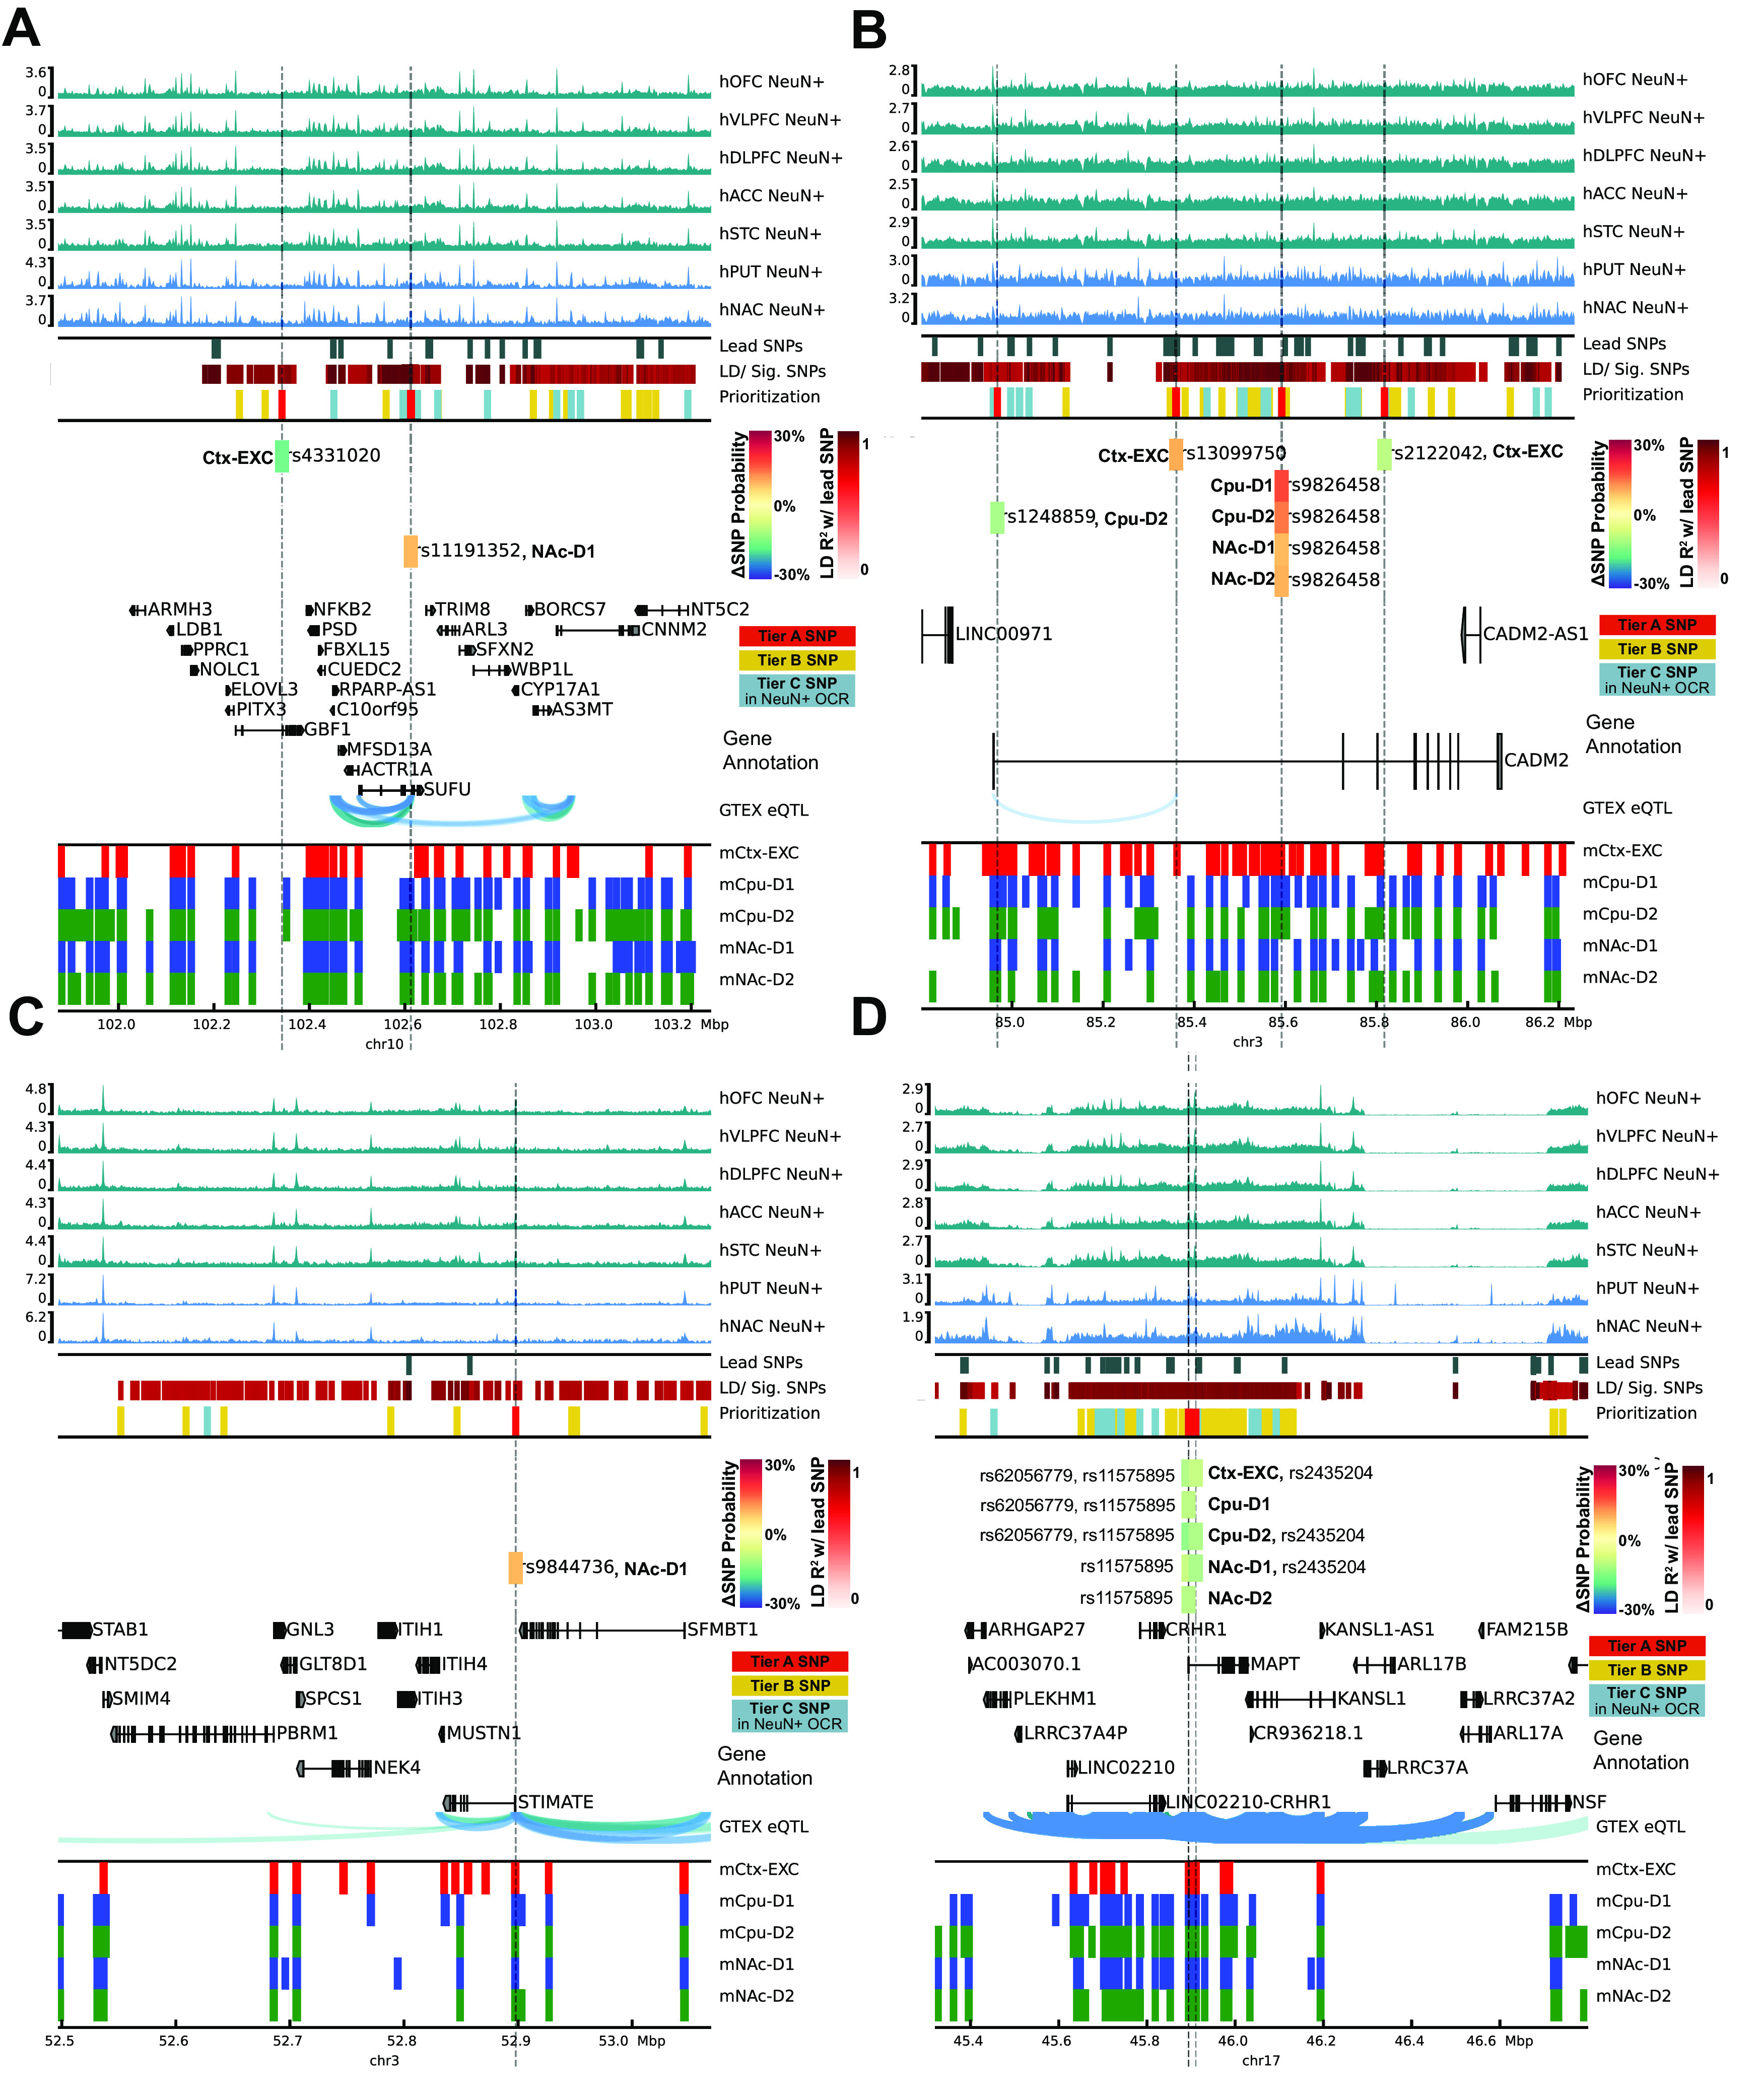
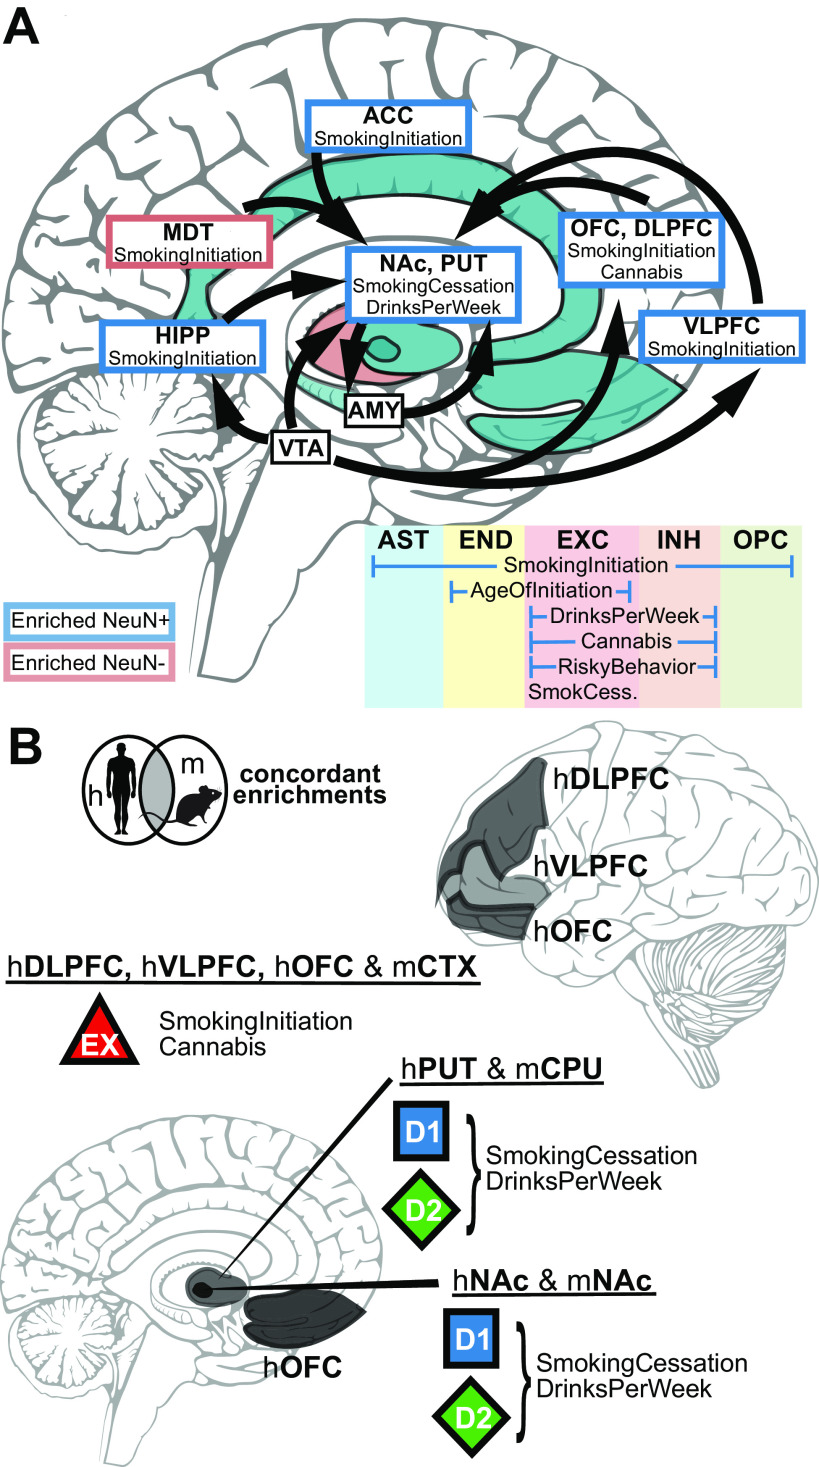
Recent large genome-wide association studies have identified multiple confident risk loci linked to addiction-associated behavioral traits. Most genetic variants linked to addiction-associated traits lie in noncoding regions of the genome, likely disrupting cis-regulatory element (CRE) function. CREs tend to be highly cell type-specific and may contribute to the functional development of the neural circuits underlying addiction. Yet, a systematic approach for predicting the impact of risk variants on the CREs of specific cell populations is lacking. To dissect the cell types and brain regions underlying addiction-associated traits, we applied stratified linkage disequilibrium score regression to compare genome-wide association studies to genomic regions collected from human and mouse assays for open chromatin, which is associated with CRE activity. We found enrichment of addiction-associated variants in putative CREs marked by open chromatin in neuronal (NeuN+) nuclei collected from multiple prefrontal cortical areas and striatal regions known to play major roles in reward and addiction. To further dissect the cell type-specific basis of addiction-associated traits, we also identified enrichments in human orthologs of open chromatin regions of female and male mouse neuronal subtypes: cortical excitatory, D1, D2, and PV. Last, we developed machine learning models to predict mouse cell type-specific open chromatin, enabling us to further categorize human NeuN+ open chromatin regions into cortical excitatory or striatal D1 and D2 neurons and predict the functional impact of addiction-associated genetic variants. Our results suggest that different neuronal subtypes within the reward system play distinct roles in the variety of traits that contribute to addiction.SIGNIFICANCE STATEMENT We combine statistical genetic and machine learning techniques to find that the predisposition to for nicotine, alcohol, and cannabis use behaviors can be partially explained by genetic variants in conserved regulatory elements within specific brain regions and neuronal subtypes of the reward system. Our computational framework can flexibly integrate open chromatin data across species to screen for putative causal variants in a cell type- and tissue-specific manner for numerous complex traits.

Keywords: addiction; deep learning; epigenetics; genomics; machine learning; neural circuits.


Figures

Figure 1.
Figure 1.
Shared and unique genetic architecture of genetic risk variants of addiction-associated traits. A, Pie chart of ANNOVAR-annotated (K. Wang et al., 2010) SNP function of addiction-associated trait lead and off-lead SNPs in LD R2 > 0.8. Dark colors represent untranscribed/noncoding annotations; light colors represent transcribed/exonic annotations. SNP annotation labels are according to ANNOVAR using ENSEMBL build 85 gene annotations (see Materials and Methods). B, Pairwise LDSC genetic correlation (rg) matrix of seven addiction-associated traits. Bold represents FDR-significant correlations. Gray represents nonsignificant correlations (FDR < 0.05). C, UpSet plot of nonoverlapping genomic loci shared or unique to each addiction-associated trait. Genomic loci are clustered and identified by shared GWAS-significant SNPs and genomic region overlap.
Figure 2.
Figure 2.
Substance use and risky behavior GWAS risk variants enrich within reward region- and cell type-specific epigenomic profiles. Stratified LDSC regression (GWAS enrichment) finds enrichment of substance use and risky behavior traits in region-specific and cell type-specific open chromatin profiles of human postmortem brain. A, GWAS enrichment FDRs in ATAC-seq of 14 postmortem human brain regions coupled with NeuN-labeled fluorescence-activated nuclei sorting (Fullard et al., 2018). Brain regions are stratified by cortical and subcortical regions, with cortical regions ordered frontal to caudal. Sorted cell types within each brain region are denoted as follows: blue triangle represents NeuN+/neuronal; red circle represents NeuN/glial. FDR adjustment was performed across all enrichments on the Fullard et al. (2018), dataset for Figure 2. Brain regions reported to be significantly enriched (FDR ≤ 0.05, black; Bonferroni p value ≤ 0.05, red) are plotted with bolded points. Dashed red line indicates the significance threshold. B, Barplot of GWAS enrichment FDRs in single-cell open chromatin profiles of cell clusters in isocortex, HIPP, and striatum (Corces et al., 2020). Cell types in brain regions that are significantly enriched (FDR ≤ 0.05) are plotted with bolded bars. Dashed red line indicates the significance threshold. C, Barplot of GWAS enrichment FDRs in single-cell THS-seq OCRs of major cell clusters in occipital cortex (Lake et al., 2018). Cell types in brain regions that are significantly enriched (FDR ≤ 0.05) are plotted with bolded bars. Dashed red line indicates the significance threshold. Traits assessed are age of smoking initiation (AgeofInitiation), average number of cigarettes per day for ever smokers (CigarettesPerDay), having ever regularly smoked (SmokingInitiation), current versus former smokers (SmokingCessation), number of alcoholic drinks per week (DrinksPerWeek) (C. Liu et al., 2019), lifetime cannabis use (Cannabis) (Pasman et al., 2018), and risky behavior (RiskyBehavior) (Karlsson Linnér et al., 2019). AMY, Amygdala; Ast, AST; End, endothelial; Ex, EXC; In, IN; Mic, microglia; Oli, oligodendrocyte; Opc, oligodendrocyte precursor.
Figure 3.
Figure 3.
Sensitivity of stratified LDSC regression for cell type- and region-specific in the GWAS trait enrichment requires well-powered GWAS in relevant cell types. GWAS enrichment plots with FDRs in ATAC-seq of 14 postmortem human brain regions coupled with NeuN-labeled fluorescence-activated nuclei sorting (Fullard et al., 2018). Regions are stratified by cortical and subcortical regions, with cortical regions ordered frontal to caudal. Sorted cell types within each brain region are denoted by shape as follows: blue triangle represents NeuN+/neuronal; red circle represents NeuN/glial. Cell types in brain regions that are enriched at FDR ≤ 0.05 are plotted with bigger shapes and with black outlines and enriched at Bonferroni p value ≤ 0.05 with red outlines. A, GWAS enrichment of addiction- or substance use-associated traits: multisite chronic pain (ChronicPain) (Johnston et al., 2019), cocaine dependence (CocaineDep) (Cabana-Domínguez et al., 2019), opioid dependence (OpioidDep) (Cheng et al., 2018), diagnosis of OCD (International Obsessive Compulsive Disorder Foundation Genetics Collaborative and OCD Collaborative Genetics Association Studies, 2018), and cups of coffee drank per day (CoffeePerDay) (Coffee and Caffeine Genetics Consortium et al., 2015). The GWASs for OCD, opioid dependence, and cocaine dependence are reportedly underpowered to detect genetic liability for these traits (Ncase < 5000). B, GWAS enrichment in well-powered brain-related traits showss cell type- and region-specific enrichment: educational attainment (EduAttain) (J. J. Lee et al., 2018), schizophrenia risk (Schizophrenia) (Schizophrenia Working Group of the Psychiatric Genomics Consortium, 2014), and habitual sleep duration (SleepDuration) (Dashti et al., 2019). C, GWAS enrichment in non–brain-associated traits does not show cell type- or region-specific enrichment: heel BMD (Kemp et al., 2017), CAD (Howson et al., 2017), and LBM (Zillikens et al., 2017).
Figure 4.
Figure 4.
Cell type specificity of cSNAIL ATAC-seq in mouse cortex and striatum. A, Principal component plots of chromatin accessibility counts from cSNAIL ATAC-seq from cre-driver lines (see Materials and Methods; sample sizes in Extended Data Table 4-1). Major axes of variation separate cell types by tissue source (PC1) and cell type versus bulk ATAC-seq (PC2). B, Normalized coverage track plots around marker genes demarcating cell type specificity of cSNAIL ATAC-seq samples. C, Density correlation plot of normalized chromatin accessibility log counts around the TSSs correlated with matched pseudo-bulk cell type log gene counts from Drop-seq of mouse cortex and striatum (Saunders et al., 2018). Drop-seq cell types meta-gene profiles report sum gene counts for cell clusters from frontal cortex and striatum. R and ρ indicate Pearson's and Spearman's correlation, respectively. D, Pairwise correlation matrix of TSS chromatin accessibility log counts with Drop-seq pseudo-bulk log gene counts from cortical and striatal cell clusters.
Figure 5.
Figure 5.
Cell type-specific enrichment of substance use traits are conserved in mouse-human orthologous OCRs. A, Experimental design to map human orthologous regions from mouse ATAC-seq of bulk cortex (CTX), dorsal striatum (CPU), and NAc of cSNAIL nuclei of D1-cre, A2a-cre, PValb-2a-cre, and SST-cre mice. cSNAIL ATAC-seq experiments report enriched (+) nuclei populations. B, Stratified LD score regression finds enrichment of substance use and risky behavior traits for brain region- and cell type-specific ATAC-seq open chromatin profiles of mouse brain. Replication of enrichment is shown using INTACT-enriched OCRs from Mo et al. (2015) of cortical excitatory (EXC+), VIP interneuron (VIP+), and PV interneuron (PV+). Enrichments that are enriched at FDR ≤ 0.05 are plotted with black outlines and Bonferroni p value ≤ 0.05 with red outlines. FDR-adjusted p value was performed across all mouse-human ortholog GWAS enrichment across Figure 5.
Figure 6.
Figure 6.
GWAS enrichment in addiction- and non–addiction-related traits using mapped mouse orthologs of tissue- and cell type-specific OCRs. GWAS enrichment plots with FDRs in human orthologous regions mapped from mouse ATAC-seq of bulk cortex (CTX), dorsal striatum (CPU), and NAc or cSNAIL nuclei of D1-cre, D2-cre, and PV-cre mice. cSNAIL ATAC-seq experiments report both enriched (+) and de-enriched (–) nuclei populations. Enrichments that are enriched at FDR < 0.05 are plotted with black outlines. Replication of enrichment is shown using INTACT-enriched OCRs from Mo et al. (2015) of cortical excitatory (EXC+), VIP interneuron (VIP+), and PV interneuron (PV+). A, GWAS enrichment of addiction- or substance use-associated traits: multisite chronic pain (ChronicPain), cocaine dependence (CocaineDep), opioid dependence (OpioidDep), diagnosis of OCD, and cups of coffee drank per day (CoffeePerDay). The GWASs for OCD, opioid dependence, and cocaine dependence are reportedly underpowered to detect genetic liability for these traits (Ncase< 5000). B, GWAS enrichment in well-powered brain-related traits shows cell type- and region-specific enrichment: educational attainment (EduAttain), schizophrenia risk (Schizophrenia), and habitual sleep duration (SleepDuration). C, GWAS enrichment in non–brain-associated traits does not show cell type- or region-specific enrichment: heel BMD, CAD, and LBM. D, Heatmap of LDSC regression coefficients of GWAS enrichment for all measured GWASs in nonbrain OCRs from human or mouse-human mapped orthologs. Tissues for which OCRs are significantly enriched (FDR < 0.05, black; Bonferroni p value ≤ 0.05, red) with GWAS variants are outlined with a bolded box.
Figure 7.
Figure 7.
CNN model performance and selection of candidate functional SNPs. A, Performance metrics for CNN models show high specificity on the test sets of positive peaks or 10× nucleotide content-matched negatives. Test set performance metrics are reported for auPRC, F1 score (using threshold = 0.5), and false positive rates across all possible thresholds (see Materials and Methods). Models were trained on IDR peaks of mouse cortical EXCs (Ctx-EXC) and D1 and D2 MSNs from CPU and NAc. B, The models best discriminate the proportion of positives and negative sequences at a threshold of 0.5. Plots represent the proportion of positives (blue) or negatives (red) that are called “positive” across CNN output thresholds from 0 to 1 averaged across folds for each set of CNN models. C, Quantile-quantile plots of p values of calibrated ΔSNP probabilities (see Materials and Methods) from a normal distribution after centering by the mean and scaling by the SD of δ SNP probabilities across all SNPs (n = 14,790 SNPs) for each set of CNN models. A hexbin plot was used to visualize overplotting, where every hexagon is colored by the number of SNPs in that bin. Black dotted line indicates the equality line y = x. The number of significant SNPs at FDR q value < 0.05 at Tier A or B are reported for each cell type and tissue (see Materials and Methods). D, Schematic to select for predicted causal impact addiction-associated GWAS SNPs. The pipeline begins with SNPs across addiction-associated GWASs aggregated to 205 nonoverlapping GWAS loci across 14,790 SNPs after LD expansion to include those in LD R2 > 0.8 (Extended Data Fig. 7-2). SNPs are further prioritized into three tiers. Tier C includes SNPs that only overlap Fullard et al. (2018), NeuN+ ATAC-seq peaks. Tier B includes SNPs with only predicted significant differential allelic impact on CNN-predicted CRE activity at q value < 0.05. Tier A includes SNPs satisfying both criteria (see Materials and Methods). E, Outline of predicting differential CRE activity between alleles using calibrated CNN probabilities of CRE activity while controlling for FDR with informative covariates (see Materials and Methods). F, Example motif matches from Extended Data Figure 7-1 of TomTom known transcription factor consensus motifs and the learned important features in CNN models for cortical excitatory and striatal D1 and D2 MSNs.
Figure 8.
Figure 8.
Cell type-specific CNN models refine human NeuN+ enrichments for substance use genetic risk GWASs. A, Schematic to predict cell type-specific activity of NeuN+ ATAC-seq peaks enriched from brain regions assayed in Fullard et al. (2018) using CNN models trained on mouse cell type-specific ATAC-seq peaks. CNN-predicted OCRs are used as input for computing GWAS enrichment. B, Stratified LD score regression of addiction-associated traits in Fullard et al. (2018). NeuN+ OCRs are predicted to be cell type-specific by machine learning models of open chromatin. Cell types are colored by the source mouse cell type-specific OCRs from A. Original enrichments from Figure 5A are reproduced in black. Larger, bolded points are significant for FDR < 0.05 (red dotted line).
Figure 9.
Figure 9.
CNN models for predicting cell type-specific open chromatin predict activity of addiction GWAS SNPs. A, Cell type activity predicted probability active by each set of CNN models of cell type activity for genome-wide significant SNPs and off-lead SNPs in LD R2 > 0.8 with the lead SNPs. Activity scores for SNPs are stratified by overlap with Fullard et al. (2018) cortical or striatal NeuN+ (teal), NeuN peaks (salmon), both (dark gray), or neither (light gray). Significance symbols indicate Bonferroni-adjusted p values from two-tailed t tests for N = 18 possible pairwise comparisons: *p < 0.05/N; **p < 0.01/N; ***p < 0.001/N. B, Locus plot for candidate SNPs with predicted function SNP impact in cortical excitatory and striatal D1, and D2 MSN cell types. Genome tracks from top to bottom: human (h) NeuN+ MACS2 ATAC-seq fold change signal of cortical and striatal brain regions enriched in Figure 5A. SNP tracks show lead SNPs from seven addiction-associated GWASs and the SNPs either in LD with the lead SNPs (Lead SNPs) or independently significant SNPs (LD/Sig. SNPs). Each SNP is colored by increasing red intensity that indicates the degree of LD with a lead SNP. Prioritized candidate causal SNPs by predicted differential cell type activity and overlap with Fullard et al. (2018). NeuN+ OCRs are plotted as follows: red represents Tier A; yellow represents Tier B; teal represents Tier C (see Materials and Methods). Tier A SNP rs7604640 is predicted to have a strong ΔSNP effect by CPU-D1 and NAc-D1 CNN models, and the bars are colored by the % change in probability active. Gene annotation tracks plot GENCODE genes from the GRCh38 build. eQTL link tracks of FDR-significant GTEX cis-eQTL from cortical or striatal brain regions, and orthologs of mouse (m) putative CREs mapped from excitatory or striatal neuronal subtypes measured by cSNAIL ATAC-seq. Cell type colors label cortical EXCs (EXC; red), D1 MSNs (D1; blue), or D2 MSNs (D2; green). C, Representative importance scores of 50 bp flanking either side of the SNP rs7604640 that measure relative contribution of that sequence being active in D1 MSNs. CNN importance score interpretations are shown for effect and non-effect alleles, and the difference in importance scores reveals the relatively more important DNA motif in the effect allele that matches consensus POU1F1 motif overlapping the rs7604640 SNP. The model interprets this POU1F1 motif and a nearby NRF1 motif as contributing to the effect allele having more activity in D1 MSNs.
Figure 10.
Figure 10.
Locus plots of addiction-associated SNPs predicted to act in striatal and cortical cell types. Locus plots are located on human (A) chr10, (B and C) chr3, and (D) chr17. Locus plot across four additional loci with Tier A SNPs with predicted function SNP impact in cortical excitatory and striatal D1 and D2 MSN cell types. Genome tracks from top to bottom: human (h) NeuN+ MACS2 ATAC-seq fold change signal of cortical and striatal brain regions enriched in Figure 5A. SNP tracks plot lead SNPs aggregated across seven addiction-associated GWASs, the SNPs in LD with the lead SNPs (Lead SNPs), or independently significant SNPs (LD/Sig. SNPs). Each SNP is colored red, increasing in intensity by the degree of LD with a lead SNP. Prioritized candidate causal SNPs by predicted differential cell type activity and overlap with Fullard et al. (2018). NeuN+ OCRs are plotted as follows: red represents Tier A; yellow represents Tier B; teal represents Tier C (see Materials and Methods). Tier A SNP rs7604640 is predicted to have strong ΔSNP effect by CPU-D1 and NAc-D1 CNN models, and the bars are colored by the % change in probability active. Gene annotation tracks plot GENCODE genes from the GRCh38 build. eQTL link tracks of FDR-significant GTEX cis-eQTL from cortical and striatal brain regions, and orthologs of mouse (m) putative CREs mapped from excitatory or striatal neuronal subtypes measured by cSNAIL ATAC-seq. NeuN+ ATAC-seq tracks and eQTL links are colored by source brain region as cortical (teal) or striatal (blue). Cell type colors label cortical EXCs (EXC; red), D1 MSNs (D1; blue), or D2 MSNs (D2; green).
Figure 11.
Figure 11.
Summary of LDSC GWAS enrichments in human and mouse-human orthologous bulk tissue and cell type open chromatin. A, Schematic of human NeuN-labeled bulk tissue and occipital cortex cell types from Figure 2C, for which addiction-associated genetic variants were significantly enriched (FDR < 0.05) in OCRs. Brain regions are labeled by the cell type that enriched (blue box/shading represents NeuN+; red box/shading represents NeuN) spatially along with the trait(s) for which OCRs were found significantly enriched with risk variants. Occipital cortex cell types from Figure 5C are listed along with the trait(s) for which OCRs were found significantly enriched with risk variants. B, Schematic of addiction-associated genetic variants that share enrichments from human brain regions and neuronal subtypes in both human and mouse-human orthologous open chromatin. Brain graphic adapted from Fullard et al. (2018).

References

    1. Alipanahi B, Delong A, Weirauch MT, Frey BJ (2015) Predicting the sequence specificities of DNA- and RNA-binding proteins by deep learning. Nat Biotechnol 33:831–838. 10.1038/nbt.3300 - DOI - PubMed
    1. Barman P, Reddy D, Bhaumik SR (2019) Mechanisms of antisense transcription initiation with implications in gene expression, genomic integrity and disease pathogenesis. Noncoding RNA 5:11. 10.3390/ncrna5010011 - DOI - PMC - PubMed
    1. Beaulieu C (1993) Numerical data on neocortical neurons in adult rat, with special reference to the GABA population. Brain Res 609:284–292. 10.1016/0006-8993(93)90884-p - DOI - PubMed
    1. Benner C, Spencer CC, Havulinna AS, Salomaa V, Ripatti S, Pirinen M (2016) FINEMAP: efficient variable selection using summary data from genome-wide association studies. Bioinformatics 32:1493–1501. 10.1093/bioinformatics/btw018 - DOI - PMC - PubMed
    1. Berke JD, Hyman SE (2000) Addiction, dopamine, and the molecular mechanisms of memory. Neuron 25:515–532. 10.1016/s0896-6273(00)81056-9 - DOI - PubMed

Publication types