. 2021 Sep 7;118(36):e2105510118.
doi: 10.1073/pnas.2105510118.

SNX27-FERM-SNX1 complex structure rationalizes divergent trafficking pathways by SNX17 and SNX27

Affiliations

SNX27-FERM-SNX1 complex structure rationalizes divergent trafficking pathways by SNX17 and SNX27

Xin Yong et al. Proc Natl Acad Sci U S A. .

Abstract

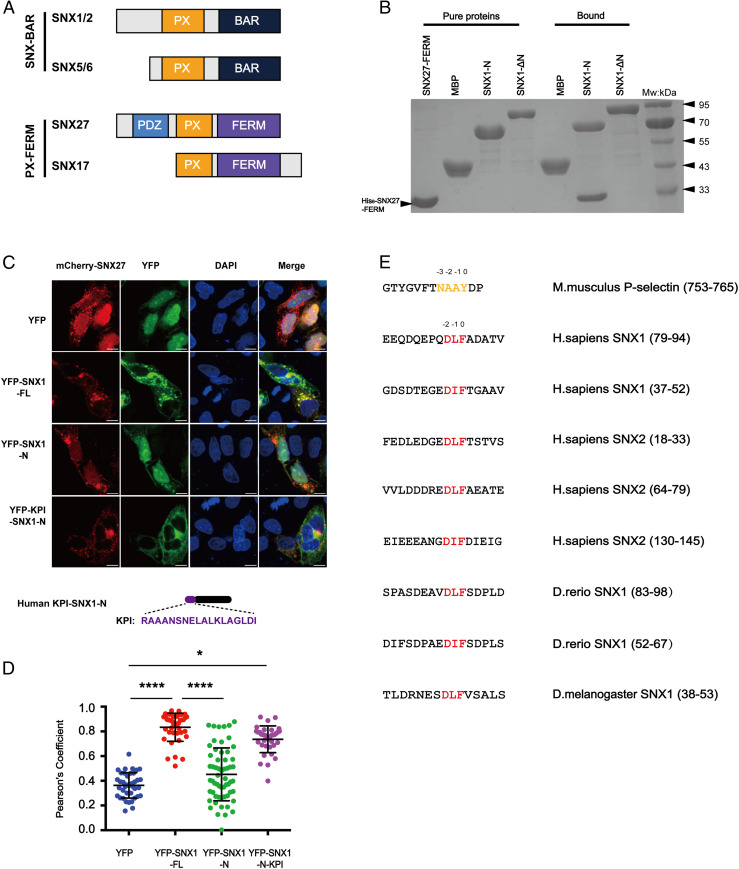
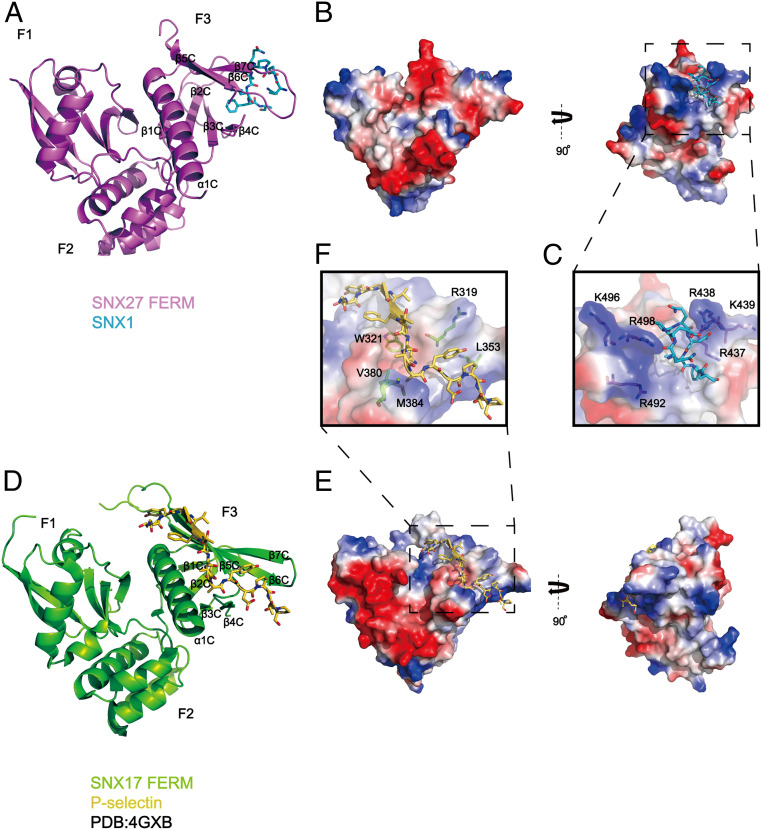
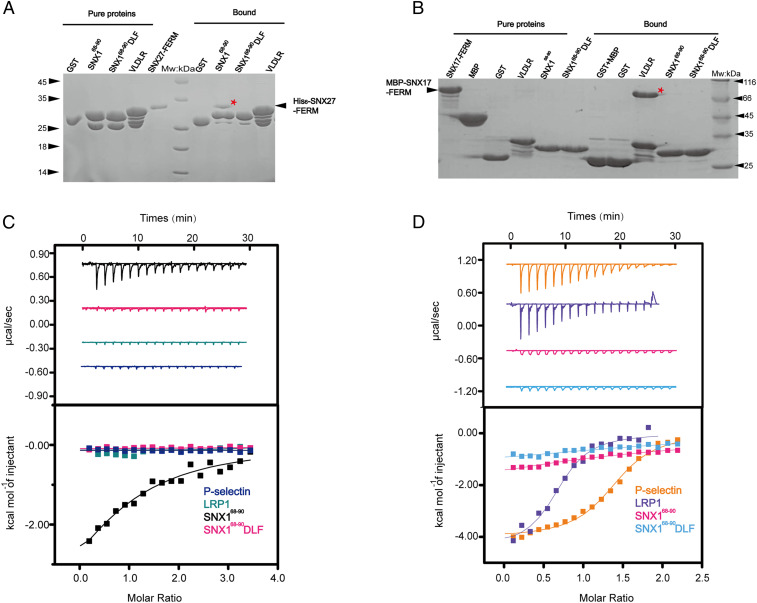
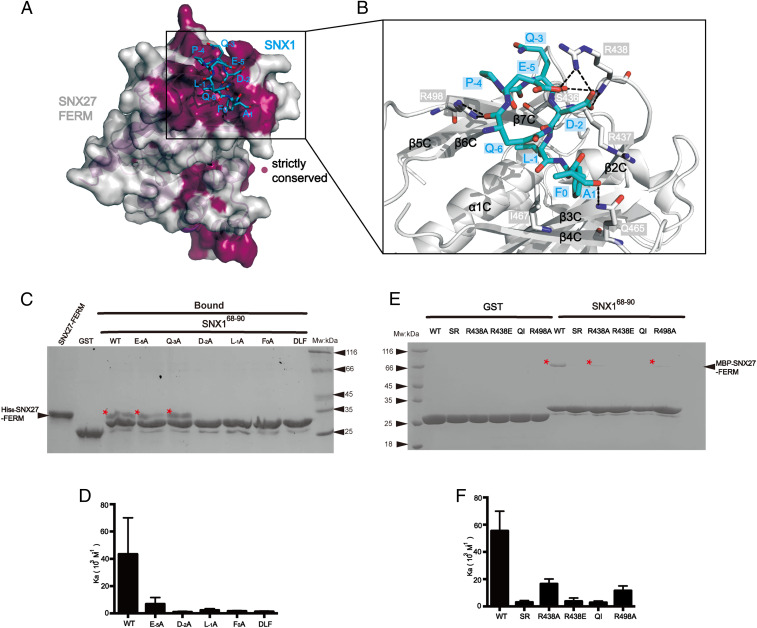
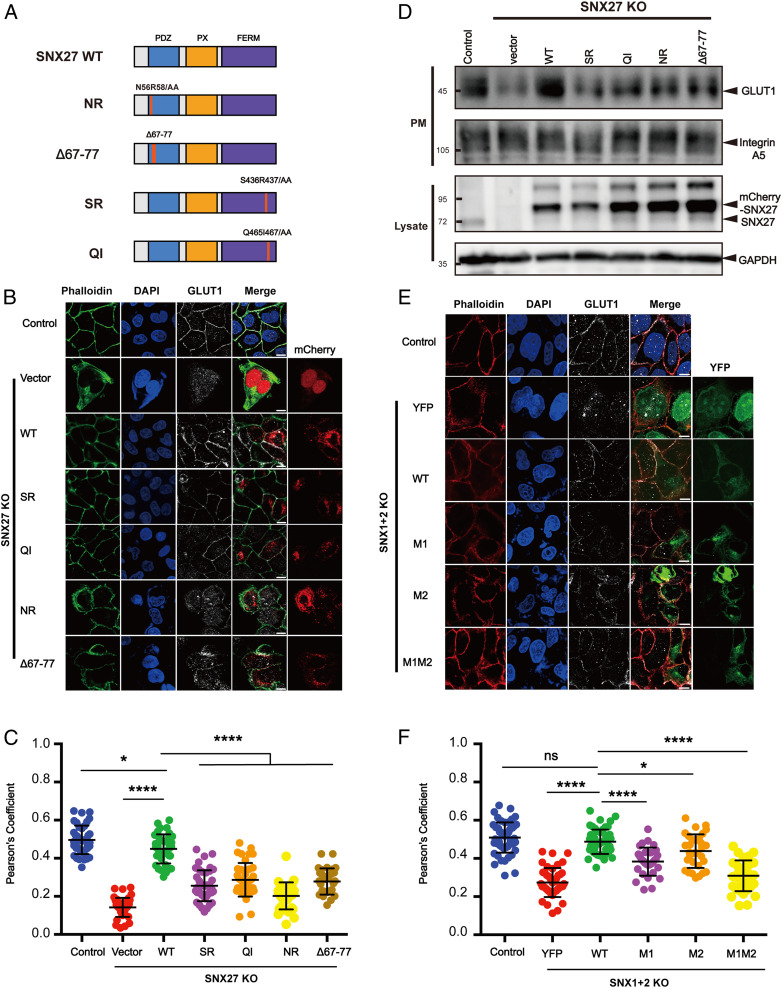
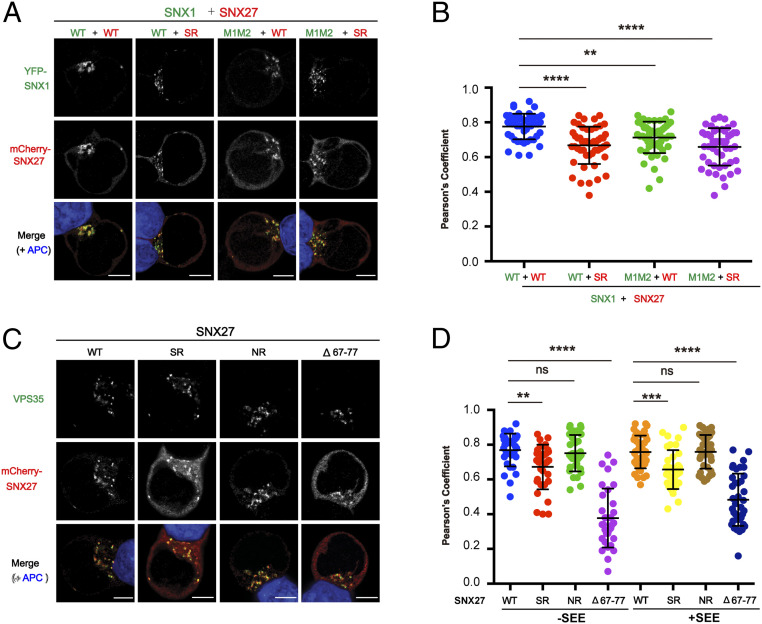
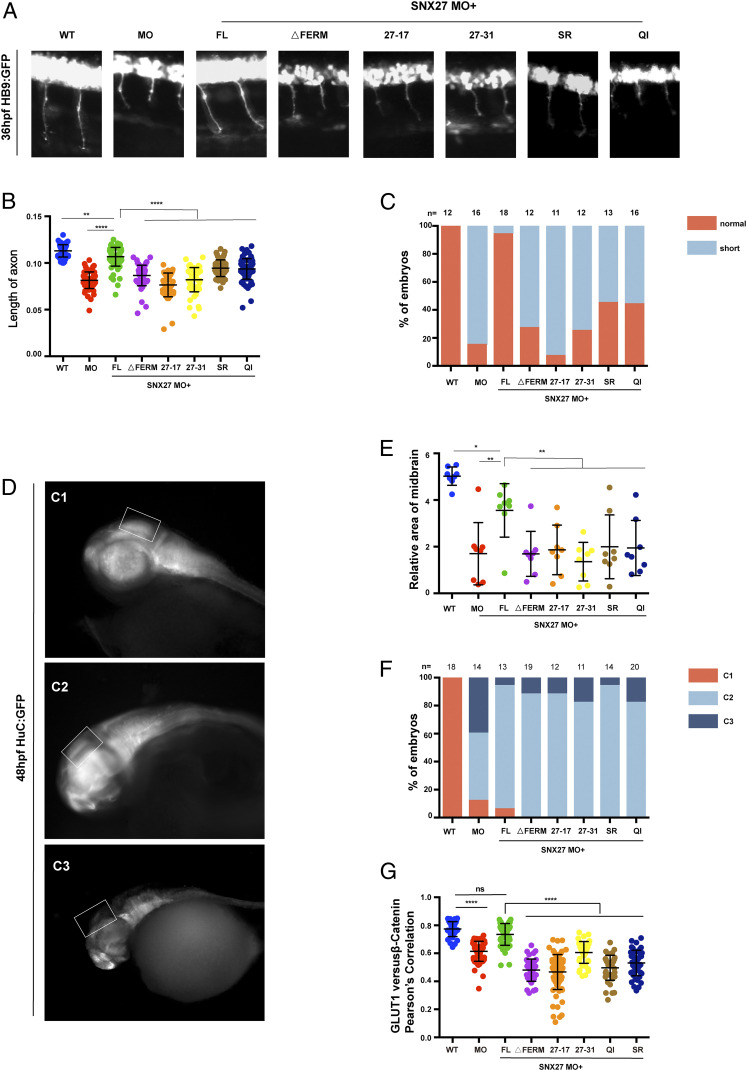
The molecular events that determine the recycling versus degradation fates of internalized membrane proteins remain poorly understood. Two of the three members of the SNX-FERM family, SNX17 and SNX31, utilize their FERM domain to mediate endocytic trafficking of cargo proteins harboring the NPxY/NxxY motif. In contrast, SNX27 does not recycle NPxY/NxxY-containing cargo but instead recycles cargo containing PDZ-binding motifs via its PDZ domain. The underlying mechanism governing this divergence in FERM domain binding is poorly understood. Here, we report that the FERM domain of SNX27 is functionally distinct from SNX17 and interacts with a novel DLF motif localized within the N terminus of SNX1/2 instead of the NPxY/NxxY motif in cargo proteins. The SNX27-FERM-SNX1 complex structure reveals that the DLF motif of SNX1 binds to a hydrophobic cave surrounded by positively charged residues on the surface of SNX27. The interaction between SNX27 and SNX1/2 is critical for efficient SNX27 recruitment to endosomes and endocytic recycling of multiple cargoes. Finally, we show that the interaction between SNX27 and SNX1/2 is critical for brain development in zebrafish. Altogether, our study solves a long-standing puzzle in the field and suggests that SNX27 and SNX17 mediate endocytic recycling through fundamentally distinct mechanisms.

Keywords: SNX27; endosomal sorting; endosome; membrane trafficking; sorting nexin.


Conflict of interest statement

The authors declare no competing interest.

Figures

Fig. 1.
Fig. 1.
SNX27 specifically binds to multiple motifs centered on DLF within the N termini of SNX1/2. (A) Domain architecture of SNX-BAR and SNX-FERM proteins used in this study. PX, BAR, FERM (band4.1-ezrin-radixin-moesin), and PDZ (postsynaptic density 95-discs large-zonula occludens). (B) MBP-SNX1-N, SNX1-ΔN, and MBP pull-down of purified His-tagged SNX27 FERM. Shown is a Coomassie Blue–stained sodium dodecyl sulphate–polyacrylamide gel electrophoresis (SDS/PAGE) gel with purified proteins (Left) and bound samples (Right). (C) Steady-state localization of different YFP-SNX1 constructs. HeLa cells were transiently transfected with mCherry-SNX27 (red) and YFP or YFP-SNX1 (green). A schematic diagram of KPI-SNX1-N is present on the bottom. (Scale bar: 10 μm.) (D) Colocalization of mCherry-SNX27 and YFP in cells in C. Each dot represents Pearson’s correlation coefficients from one cell. Data were presented as mean ± SD, and P values were calculated using one-way ANOVA and Tukey’s multiple comparisons test. *P < 0.05; ****P < 0.0001. (E) Sequence alignment of multiple fragments from the N termini of SNX1 and SNX2 highlights a DLF motif. Red color indicates the conserved DLF or DIF residues. The NPxY/NxxY motif in P-selectin is colored in orange and used for comparison.
Fig. 2.
Fig. 2.
Crystal structure of SNX27-FERM-SNX1 and its comparison with the SNX17-FERM-P-selectin structure. (A) Ribbon diagram of SNX27 FERM domain (violet) in complex with the SNX1 peptide, which is represented as cyan sticks. The three submodules of SNX27 FERM, F1, F2, and F3, are marked, and the secondary structure of F3 is labeled. (B) The overall structure is shown in two perpendicular views depicted by SNX27 surface colored for electrostatic potential, with SNX183-90 peptide colored in cyan. Red and dark blue colors indicate negatively or positively charged surfaces of SNX27 FERM, separately. White colors highlight the hydrophobic region on SNX27 FERM surface. (C) A close-up inset image of the interface in the dashed line box shown in B. SNX27 is represented as a partially transparent surface with specific positively charged side chains around the hydrophobic binding pocket in accommodation for SNX1. (D) SNX17 in complex with cargo P-selectin (Protein Data Bank: 4GXB) is depicted with analogous representations to those shown for SNX27 in A. (E) SNX17 in complex with cargo P-selectin is represented similarly to SNX27 shown in B. (F) A zoomed-in picture of the interface between SNX17 and P-selectin in the dashed line box shown in E. A partially transparent electrostatic surface potential map of SNX17 is presented. Critical residues involved in interacting with P-selectin are shown in stick mode.
Fig. 3.
Fig. 3.
The FERM domains SNX27 and SNX17 recognize the DLF and NPxY/NxxY motifs, respectively. (A) GST-SNX168-90, GST-SNX168-90DLF, GST-VLDLR, and GST pull-down of purified His6-SNX27-FERM. Shown is a Coomassie Blue–stained SDS/PAGE gel of purified protein (Left) and bound samples (Right). * indicates the retained His6-SNX27-FERM (Left) or MBP-SNX17-FERM (Right). (B) The GST-fusion proteins used in A were incubated with purified MBP-SNX17-FERM. Shown is a Coomassie Blue–stained SDS/PAGE gel of purified protein (Left) and bound samples (Right). (C and D) ITC of P-selectin, LRP1, SNX168-90, and SNX168-90 DLF titrated into MBP-SNX27-FERM (C) or SNX17 FL (D) in a buffer containing 50 mM Tris-Base pH 8.0 or 100 mM NaCl at 16 °C, respectively. Raw data are listed at the top, and integrated normalized data are listed at the bottom. Colors indicate the peptides used in the assay. Experiments were performed in triplicate, and one representative experiment is presented.
Fig. 4.
Fig. 4.
Structural mechanism of recognition of the DLF motif from SNX1 by SNX27 FERM. (A) Conservation analysis of the FERM domain of SNX27 using the ConSurf Server (https://consurf.tau.ac.il) shows that the SNX1-binding groove among the F3 submodule is strictly conserved. The surface of SNX27-FERM is colored as light gray (nonconserved) and purple (strictly conserved). SNX1 peptide is shown in cyan sticks. (B) Close-up view showing the detailed binding between the SNX1 DLF motif (cyan) and SNX27-FERM (partially transparent surface; blue and red represent positive and negative charge, respectively). Critical residues on SNX27-FERM important for SNX1 recognition are highlighted in stick mode; black dashed lines indicate the observed hydrogen bonds and salt bridges in the structure. (C) GST, GST-SNX168-90 WT, and mutants (E−5A, Q−3A, D−2A, L−1A, F0A, and DLF) pull down His6-SNX27-FEEM. Shown is a Coomassie Blue–stained SDS/PAGE gel of bound samples of GST in right and GST-SNX1 in left. * indicates the retained His6-SNX27-FERM. (D) Binding affinity between MBP-SNX27-FERM protein and WT or corresponding mutants of SNX168-90 peptides in C determined by ITC. Association constant (Ka) is shown together with errors from data fitting. (E) GST and GST-SNX168-90 pull-down of purified MBP-SNX27-FERM WT, SR, R438A, R438E, QI, and R498A, respectively. Shown is a Coomassie Blue–stained SDS/PAGE gel of bound samples of GST on the right and GST-SNX1 on the left. * indicates the retained MBP-SNX27-FERM. (F) Binding affinity between MBP-SNX27-FERM WT or mutants in E and SNX168-90 WT determined by ITC. Association constant (Ka) is shown together with errors from data fitting.
Fig. 5.
Fig. 5.
The interaction between SNX27 and SNX1 is critical for endosomal recycling of GLUT1. (A) A schematic diagram of SNX27 constructs used in this study. (B and C) Surface distribution of GLUT1 in HeLa cell lines. The SNX27 KO cells were transfected with mCherry, mCherry-SNX27 WT, mCherry-SNX27 SR, mCherry-SNX27 QI, mCherry-SNX27 NR, and mCherry-SNX27 Δ67 to Δ77 (Left), while control cells were left untreated. Cells were then incubated with antibody against GLUT1 (gray) and stained with phalloidin (green). (C) Colocalization analysis between GLUT1 and phalloidin in B. Each dot represents Pearson’s correlation coefficients from one cell. Data are presented as mean ± SD, and P values were calculated using one-way ANOVA and Tukey’s multiple comparisons test. *P < 0.05, 0.001 < ****P < 0.0001; figure is representative of n = 3 independent experiments with similar results. (D) Surface biotinylation level of GLUT1 and integrin A5 in HeLa cell strains. SNX27 KO cells were transfected with indicated plasmids in A (Top), while control cells were left untreated. Cells were then digested, washed, and subjected to biotin label reagent for 30 min at RT. Streptavidin agarose resin was utilized to capture biotinylated proteins. Samples were washed and used for immunoblotting (plasma membrane [PM]); mCherry-SNX27, endogenous SNX27, and GAPDH were detected in lysate. (E and F) Surface distribution of GLUT1 in HeLa cell lines. The SNX1+2 KO cells were transfected with YFP, YFP-SNX1 WT, YFP-SNX1 M1, YFP-SNX1 M2, and YFP-SNX1 M1M2 (Left), while control cells were left untreated. Cells were then incubated with antibody against GLUT1 (gray) and stained with phalloidin (red). (E) Colocalization analysis between GLUT1 and phalloidin in D. Each dot represents Pearson’s correlation coefficients from one cell. Data were presented as mean ± SD and P values were calculated using one-way ANOVA and Tukey’s multiple comparisons test. *P < 0.05, 0.001 < ****P < 0.0001, ns, not significant; figure is representative of n = 3 independent experiments with similar results.
Fig. 6.
Fig. 6.
Interaction with SNX1 and VPS26 mediates the endosomal recruitment of SNX27 in Jurkat T cells. Jurkat T cells were transfected with plasmids expressing YFP-SNX1 and mCherry-SNX27 (A and B) or with plasmids expressing mCherry-SNX27 (C and D) as indicated and conjugated with NALM6 B cells. (A) Representative images showing localization of SNX1 (green) and SNX27 (red) in T cells conjugated with staphylococcal enterotoxin E (SEE)-pulsed B cells (APC; blue). (B) Colocalization analysis between SNX1 and SNX27 within T cells conjugated with SEE-pulsed B cells. (C) Representative images showing localization of SNX27 (red) and endogenous VPS35 (green) in T cells conjugated with SEE-pulsed B cells (APC; blue). (D) Colocalization analysis between SNX27 and VPS35 within T cells conjugated with NALM6 B cells preloaded with or without SEE superantigen. (A and C) (Scale bar: 5 μm.) (B and D) Each dot represents a Pearson’s correlation coefficient from a single conjugated T cell, and error bars indicate SD. Data shown are representative (A and C) and combined (B and D) from four (A and B) and three (C and D) independent experiments. Statistical significance was determined using one-way ANOVA with Tukey’s multiple comparisons test. **P < 0.01, ***P < 0.001, ****P < 0.0001, ns, not significant.
Fig. 7.
Fig. 7.
The SNX1–SNX27 interaction is critical for neuronal growth and brain development in zebrafish. (A) Morphology of CaP axons from embryos at 36 hours postfertilization (hpf) injected with SNX27a MO and/or indicated mRNAs was determined, and representative images of at least three independent experiments were shown. All injections were performed at one-cell stage of the Tg [hb9: GFP]ml2 transgenic zebrafish embryos. (B) Statistical analysis of the length of CaP axons in embryos described as in A; each dot represents one CaP axons length in embryos, and error bars indicate the SD. The samples were measured using at least 55 axons from 11 embryos. P values were calculated using one-way ANOVA by Tukey’s honestly significant difference (HSD) test or t test. ****P < 0.0001; ***P < 0.001; **P < 0.01. (C) The proportion of each class upon injection of SNX27a MO only or coinjection of indicated mRNAs is shown. All injections are performed at one-cell stage of the development. The length of the axons is divided into two grades, normal and short. Normal means the length of axon is similar to that of WT, whereas short means the length of axon is shorter than that of WT. N represents the number of embryos used for statistical analysis. (D) HuC expression in Tg(HuC:GFP) transgenic zebrafish. The lateral view of zebrafish midbrain at 48 hpf was divided into three levels according to the size of midbrain area. C1, normal; C2, moderate defects in midbrain; C3, severe defects in midbrain. All injections were performed at the one-cell stage of development. The white squares label the position of the midbrain. Representative images of three independent experiments were shown. (E) The relative area of zebrafish midbrain was measured from lateral view. Eight embryos from each group were used for analysis. Results for individual zebrafishes were plotted, and the mean and SD for each group are shown; P values were calculated using one-way ANOVA by Tukey’s HSD test or t test. **P < 0.01; *P < 0.1. (F) The percentage of embryos in each class described in D and E are shown. N represents the numbers of embryos used for statistical analysis. P value was calculated using χ2 (and Fisher’s exact) test. P < 0.0001. (G) Colocalization analysis of GLUT1 with β-catenin within zebrafish. Results for individual zebrafish embryo cells are plotted, along with the mean and SD for each group. P values were calculated using one-way ANOVA by Tukey’s HSD test or t test. ****P < 0.0001, ns, not significant.

References

    1. Cullen P. J., Steinberg F., To degrade or not to degrade: Mechanisms and significance of endocytic recycling. Nat. Rev. Mol. Cell Biol. 19, 679–696 (2018). - PubMed
    1. Wang J., et al. ., Endosomal receptor trafficking: Retromer and beyond. Traffic 19, 578–590 (2018). - PMC - PubMed
    1. Burd C., Cullen P. J., Retromer: A master conductor of endosome sorting. Cold Spring Harb. Perspect. Biol. 6, a016774 (2014). - PMC - PubMed
    1. McMillan K. J., Korswagen H. C., Cullen P. J., The emerging role of retromer in neuroprotection. Curr. Opin. Cell Biol. 47, 72–82 (2017). - PMC - PubMed
    1. Small S. A., Petsko G. A., Retromer in Alzheimer disease, Parkinson disease and other neurological disorders. Nat. Rev. Neurosci. 16, 126–132 (2015). - PubMed

Publication types

Substances

LinkOut - more resources