

Early assessment of the relationship between the COVID-19 pandemic and births in high-income countries
- PMID: 34462356
- PMCID: PMC8433569
- DOI: 10.1073/pnas.2105709118
Early assessment of the relationship between the COVID-19 pandemic and births in high-income countries
Abstract
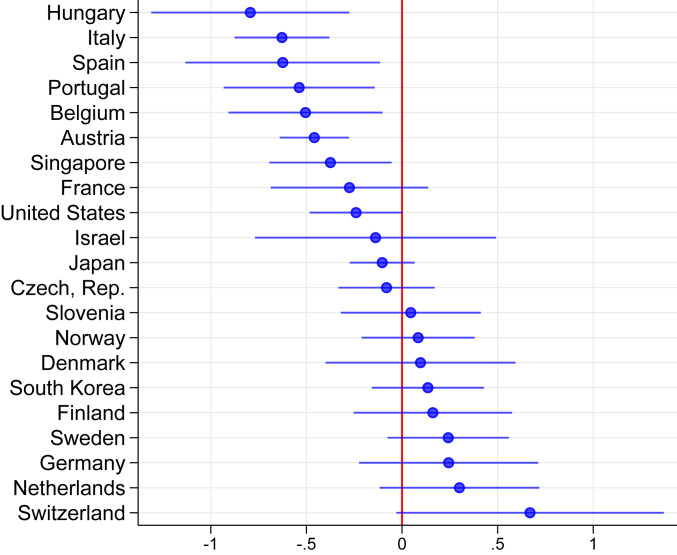
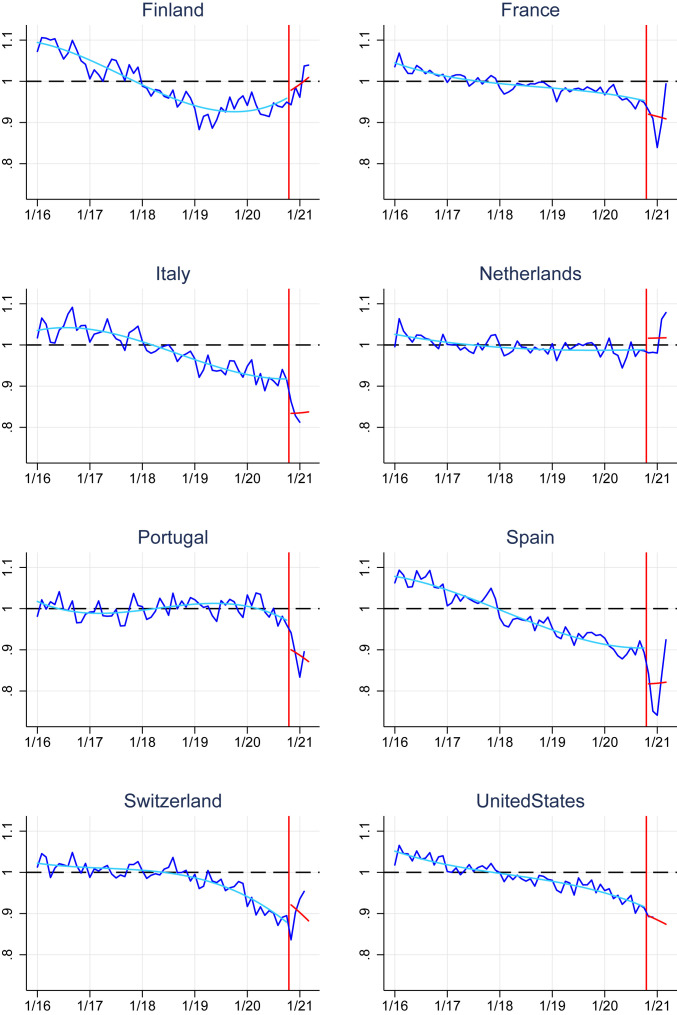
Drawing on past pandemics, scholars have suggested that the COVID-19 pandemic will bring about fertility decline. Evidence from actual birth data has so far been scarce. This brief report uses data on vital statistics from a selection of high-income countries, including the United States. The pandemic has been accompanied by a significant drop in crude birth rates beyond that predicted by past trends in 7 out of the 22 countries considered, with particularly strong declines in southern Europe: Italy (-9.1%), Spain (-8.4%), and Portugal (-6.6%). Substantial heterogeneities are, however, observed.
Keywords: COVID-19; baby bust; birth rates; fertility; pandemics.
Copyright © 2021 the Author(s). Published by PNAS.
Conflict of interest statement
The authors declare no competing interest.
Figures
References
-
- Bacci M. L., “Mortality crises in a historical perspective: The European experience” inThe Mortality Crisis in Transitional Economies, Cornia G. A., Paniccia R., Eds. (Oxford University Press, 2000), pp. 38–58.
-
- Mills I. D., The 1918-1919 influenza pandemic the Indian experience. Indian Econ. Soc. Hist. Rev. 23, 1–40 (1986). - PubMed
Publication types
MeSH terms
LinkOut - more resources
Full Text Sources
Miscellaneous
